Statistical Analysis of the CAPM I. Sharpe–Linter CAPM
Statistical Analysis of the CAPM I. Sharpe–Linter CAPM
Statistical Analysis of the CAPM I. Sharpe–Linter CAPM

Create successful ePaper yourself
Turn your PDF publications into a flip-book with our unique Google optimized e-Paper software.
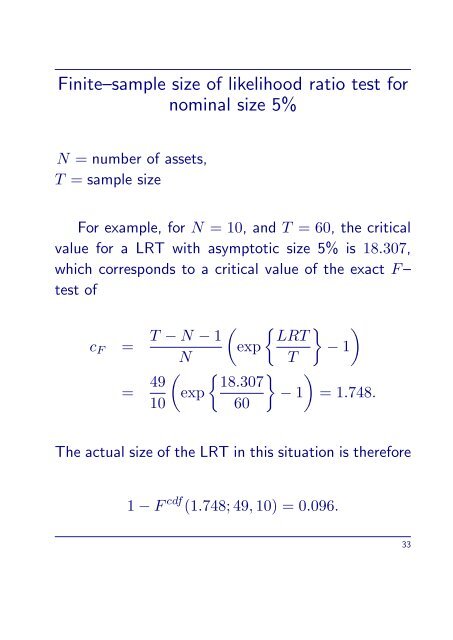
Finite–sample size <strong>of</strong> likelihood ratio test for<br />
nominal size 5%<br />
N = number <strong>of</strong> assets,<br />
T = sample size<br />
For example, for N = 10, and T = 60, <strong>the</strong> critical<br />
value for a LRT with asymptotic size 5% is 18.307,<br />
which corresponds to a critical value <strong>of</strong> <strong>the</strong> exact F –<br />
test <strong>of</strong><br />
cF =<br />
( { } )<br />
T − N − 1 LRT<br />
exp − 1<br />
N<br />
T<br />
= 49<br />
( { } )<br />
18.307<br />
exp − 1 = 1.748.<br />
10 60<br />
The actual size <strong>of</strong> <strong>the</strong> LRT in this situation is <strong>the</strong>refore<br />
1 − F cdf (1.748; 49, 10) = 0.096.<br />
33