Anti-inflammatory Amino Acid Derivatives from the Ascidian ...
Anti-inflammatory Amino Acid Derivatives from the Ascidian ...
Anti-inflammatory Amino Acid Derivatives from the Ascidian ...

You also want an ePaper? Increase the reach of your titles
YUMPU automatically turns print PDFs into web optimized ePapers that Google loves.
<strong>Anti</strong>-<strong>inflammatory</strong> <strong>Amino</strong> <strong>Acid</strong> <strong>Derivatives</strong> <strong>from</strong> <strong>the</strong> <strong>Ascidian</strong><br />
Herdmania momus<br />
Jian Lin Li, † Sang Chul Han, ‡ Eun Sook Yoo, ‡ Sook Shin, § Jongki Hong, ^ Zheng Cui, || Huayue Li, †<br />
and Jee H. Jung* ,†<br />
† College of Pharmacy, Pusan National University, Busan 609-735, Korea<br />
‡ School of Medicine, Jeju National University, Jeju 690-756, Korea<br />
§ Department of Life Science, Sahmyook University, Seoul 139-742, Korea<br />
^ College of Pharmacy, Kyung Hee University, Seoul 130-701, Korea<br />
Shenyang Pharmaceutical University, Shenyang 110016, People's Republic of China<br />
bS Supporting Information<br />
)<br />
ABSTRACT:<br />
Received: May 11, 2011<br />
Published: July 19, 2011<br />
ARTICLE<br />
pubs.acs.org/jnp<br />
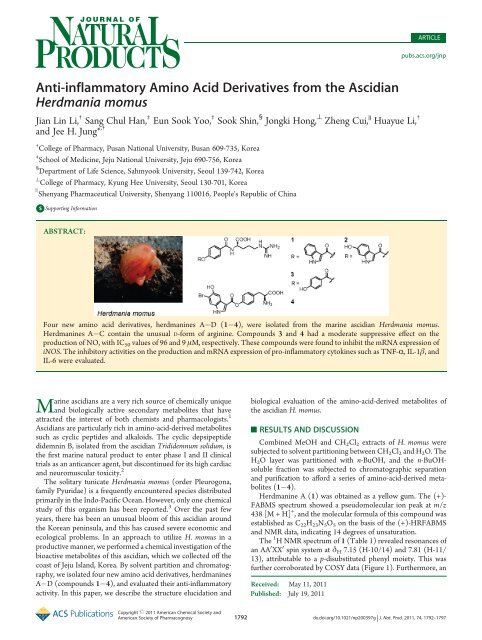
Four new amino acid derivatives, herdmanines A D(1 4), were isolated <strong>from</strong> <strong>the</strong> marine ascidian Herdmania momus.<br />
Herdmanines A C contain <strong>the</strong> unusual D-form of arginine. Compounds 3 and 4 had a moderate suppressive effect on <strong>the</strong><br />
production of NO, with IC50 values of 96 and 9 μM, respectively. These compounds were found to inhibit <strong>the</strong> mRNA expression of<br />
iNOS. The inhibitory activities on <strong>the</strong> production and mRNA expression of pro-<strong>inflammatory</strong> cytokines such as TNF-R, IL-1β, and<br />
IL-6 were evaluated.<br />
Marine ascidians are a very rich source of chemically unique<br />
and biologically active secondary metabolites that have<br />
attracted <strong>the</strong> interest of both chemists and pharmacologists. 1<br />
<strong>Ascidian</strong>s are particularly rich in amino-acid-derived metabolites<br />
such as cyclic peptides and alkaloids. The cyclic depsipeptide<br />
didemnin B, isolated <strong>from</strong> <strong>the</strong> ascidian Trididemnum solidum, is<br />
<strong>the</strong> first marine natural product to enter phase I and II clinical<br />
trials as an anticancer agent, but discontinued for its high cardiac<br />
and neuromuscular toxicity. 2<br />
The solitary tunicate Herdmania momus (order Pleurogona,<br />
family Pyuridae) is a frequently encountered species distributed<br />
primarily in <strong>the</strong> Indo-Pacific Ocean. However, only one chemical<br />
study of this organism has been reported. 3 Over <strong>the</strong> past few<br />
years, <strong>the</strong>re has been an unusual bloom of this ascidian around<br />
<strong>the</strong> Korean peninsula, and this has caused severe economic and<br />
ecological problems. In an approach to utilize H. momus in a<br />
productive manner, we performed a chemical investigation of <strong>the</strong><br />
bioactive metabolites of this ascidian, which we collected off <strong>the</strong><br />
coast of Jeju Island, Korea. By solvent partition and chromatography,<br />
we isolated four new amino acid derivatives, herdmanines<br />
A D (compounds 1 4), and evaluated <strong>the</strong>ir anti-<strong>inflammatory</strong><br />
activity. In this paper, we describe <strong>the</strong> structure elucidation and<br />
biological evaluation of <strong>the</strong> amino-acid-derived metabolites of<br />
<strong>the</strong> ascidian H. momus.<br />
’ RESULTS AND DISCUSSION<br />
Combined MeOH and CH2Cl2 extracts of H. momus were<br />
subjected to solvent partitioning between CH2Cl2 and H2O. The<br />
H 2O layer was partitioned with n-BuOH, and <strong>the</strong> n-BuOHsoluble<br />
fraction was subjected to chromatographic separation<br />
and purification to afford a series of amino-acid-derived metabolites<br />
(1 4).<br />
Herdmanine A (1) was obtained as a yellow gum. The (+)-<br />
FABMS spectrum showed a pseudomolecular ion peak at m/z<br />
438 [M + H] + , and <strong>the</strong> molecular formula of this compound was<br />
established as C 22H 23N 5O 5 on <strong>the</strong> basis of <strong>the</strong> (+)-HRFABMS<br />
and NMR data, indicating 14 degrees of unsaturation.<br />
The 1 H NMR spectrum of 1 (Table 1) revealed resonances of<br />
an AA 0 XX 0 spin system at δ H 7.15 (H-10/14) and 7.81 (H-11/<br />
13), attributable to a p-disubstituted phenyl moiety. This was<br />
fur<strong>the</strong>r corroborated by COSY data (Figure 1). Fur<strong>the</strong>rmore, an<br />
Copyright r 2011 American Chemical Society and<br />
American Society of Pharmacognosy 1792 dx.doi.org/10.1021/np200397g | J. Nat. Prod. 2011, 74, 1792–1797
Journal of Natural Products ARTICLE<br />
indole spin system was suggested, which was fur<strong>the</strong>r supported<br />
by <strong>the</strong> UV absorption at 283 nm. In <strong>the</strong> HMBC spectrum<br />
(Figure 1), <strong>the</strong> correlations <strong>from</strong> H-4 to C-3, C-6, and C-7a,<br />
<strong>from</strong> H-5 to C-3a and C-7, <strong>from</strong> H-6 to C-4 and C-7a, and <strong>from</strong><br />
H-7 to C-5 and C-3a were assigned to an indole moiety.<br />
Correlations <strong>from</strong> <strong>the</strong> indole proton H-2 to C-3, C-3a, and<br />
C-7a were also observed in <strong>the</strong> HMBC spectrum. The H-4 and<br />
H-2/C-2 signals were significantly shifted downfield owing to <strong>the</strong><br />
carbonyl substitution at C-3 of <strong>the</strong> indole group, and a correlation<br />
<strong>from</strong> H-2 to <strong>the</strong> carbonyl carbon C-8 (δC 163.8) was<br />
observed in <strong>the</strong> HMBC spectrum. The carbon resonance at δC<br />
55.1 and <strong>the</strong> resonance due to <strong>the</strong> associated proton at δ H 4.19<br />
indicated <strong>the</strong> presence of an amino acid moiety, and <strong>the</strong> carbon<br />
signal at δC 158.0 (C-22) was in good agreement with <strong>the</strong><br />
expected value for a terminal guanidyl group. The presence of <strong>the</strong><br />
guanidyl group was fur<strong>the</strong>r corroborated by <strong>the</strong> formation of a<br />
pyrimidine derivative in <strong>the</strong> reaction between 1 and acetylacetone<br />
(Figure 2). Peaks due to six methylene protons, a methine<br />
proton, and two exchangeable protons appeared at δ H 8.78 (16-<br />
NH) and 9.29 (21-NH), and <strong>the</strong>se protons were thought to be<br />
associated with a 2,5-diaminopentanoic acid moiety. Successive<br />
COSY connections <strong>from</strong> 16-NH to 21-NH suggested <strong>the</strong> presence<br />
of an arginine moiety. The amide proton (16-NH) and Rproton<br />
(H-17) of arginine showed HMBC correlations to <strong>the</strong><br />
carbonyl carbon C-15, which in turn showed correlations with<br />
<strong>the</strong> aromatic protons H-11/13, indicating that 1 contained a poxybenzoyl<br />
group directly attached to an arginine moiety. On <strong>the</strong><br />
basis of <strong>the</strong> molecular formula of 1, it was assumed that <strong>the</strong> N-(poxybenzoyl)arginine<br />
and 3-carboxyindole units were joined via<br />
an ester linkage. This was fur<strong>the</strong>r supported by <strong>the</strong> chemical<br />
shifts of C-8 (δC 163.8) and C-9 (δC 153.1) and <strong>the</strong> results of<br />
FAB-CID-MS/MS analysis (Figure 3). The arginine moiety was<br />
suggested to be in <strong>the</strong> D-form by comparison of <strong>the</strong> specific<br />
rotation of 1 ([R] 23 D 18) with that of <strong>the</strong> analogous D-arginine<br />
(5:[R] 20 D 133) and L-arginine model compounds (6:[R] 20 D<br />
+3.6; 7: [R] 23 D +14; 8: [R] 23 D +26; 9: [R] 23 D +19.5). 4,5 This<br />
Table 1. 1 H (500 MHz) and 13 C (100 MHz) NMR Data for 1 a<br />
and 2 b<br />
herdmanine A (1) herdmanine B (2)<br />
position δC δH (J in Hz) δC c<br />
δH (J in Hz)<br />
1-NH 12.17, brs<br />
2 134.7 8.33, s 133.4 8.01, s<br />
3 105.9 106.0<br />
3a 126.5 120.9<br />
4 121.0 8.02, dd (6.0, 1.0) 122.3 7.87, d (8.5)<br />
5 122.4 7.24, ddd (7.5, 6.0, 1.5) 113.1 6.78, dd (8.5, 2.0)<br />
6 123.4 7.26, ddd (7.5, 6.0, 1.0) 155.2<br />
7 113.3 7.42, dd (6.0, 1.5) 98.4 6.88, d (2.0)<br />
7a 137.2 139.4<br />
8 163.8 164.8<br />
9 153.1 155.7<br />
10 122.2 7.15, d (8.5) 123.3 7.33, dd (8.5, 2.0)<br />
11 129.0 7.81, d (8.5) 129.7 7.95, dd (8.5, 2.0)<br />
12 132.3 132.7<br />
13 129.0 7.81, d (8.5) 129.7 7.95, dd (8.5, 2.0)<br />
14 122.2 7.15, d (8.5) 123.3 7.33, dd (8.5, 2.0)<br />
15 165.1 168.5<br />
16-NH 8.78, d (9.0)<br />
17 55.1 4.19, m 55.8 4.50, dd (7.0, 5.0)<br />
18a 29.9 1.87, m 31.3 2.00, m<br />
18b 1.81, m 1.87, m<br />
19 25.3 1.58, m 26.1 1.68, quint (7.5)<br />
20 41.2 3.15, m 42.1 3.21, m<br />
21-NH 9.29, s<br />
22 158.0 157.6<br />
23-NH 7.20, brs<br />
24-NH2<br />
7.20, brs<br />
25-COOH d<br />
177.5 178.3<br />
a<br />
Spectra recorded in d6-DMSO. b Spectra recorded in CD3OD.<br />
c d<br />
Chemical shifts obtained <strong>from</strong> gHSQC and gHMBC spectra. Proton<br />
signals were not observed.<br />
was confirmed by Marfey’s method; 6 <strong>the</strong> pyrimidine derivative of<br />
1 (1a) was hydrolyzed and allowed to react with Marfey’s reagent<br />
to give 1c. TLC analysis showed that 1c was identical to <strong>the</strong><br />
compound derived <strong>from</strong> au<strong>the</strong>ntic D-arginine.<br />
Herdmanine B (2) was isolated as a white powder. The<br />
pseudomolecular ion [M + H] + peak at m/z 454.1755 in <strong>the</strong><br />
(+)-HRFABMS spectrum matched well with <strong>the</strong> expected<br />
formula C22H24N5O6. The spectroscopic properties of 2 were<br />
similar to those of 1. The only difference between <strong>the</strong> 1 HNMR<br />
spectra of 1 and 2 was in <strong>the</strong> signals associated with <strong>the</strong> indole<br />
moiety. COSY and 1 H NMR analysis indicated that three of<br />
<strong>the</strong> aromatic protons were part of an AMX system. Correlations<br />
were observed <strong>from</strong> H-4 to C-3, C-6, and C-7a, <strong>from</strong> H-5<br />
to C-3a and C-7, and <strong>from</strong> H-7 to C-5 and C-3a. The chemical<br />
shift of C-6 (δ C 155.2) was indicative of hydroxylation. The<br />
negative specific rotationof2 ([R] 23 D 33) suggested that it<br />
contained D-arginine, and this was confirmed by <strong>the</strong> analogy of<br />
<strong>the</strong> specific rotation with that observed for ( )-herdmanine<br />
A([R] 23 D 18).<br />
Herdmanine C (3) was isolated as a white powder, and <strong>the</strong><br />
(+)-HRFABMS data of this compound supported <strong>the</strong> molecular<br />
1793 dx.doi.org/10.1021/np200397g |J. Nat. Prod. 2011, 74, 1792–1797
Journal of Natural Products ARTICLE<br />
Figure 1. Selected HMBC and COSY correlations of compound 1.<br />
Figure 2. Derivatization of compound 1 for Marfey analysis: (i) H2O<br />
(25 μL), EtOH (50 μL), triethylamine (25 μL), and acetylacetone<br />
(50 μL), 110 °C, 4 h; (ii) 2 N HCl, 110 °C, 6 h; (iii) FDAA (1-fluoro-2,4dinitrophenyl-5-L-alanine<br />
amide), 40 °C, 2 h.<br />
formula C20H22N4O6. The 1 H NMR and 13 C NMR data of 3<br />
showed two sets of AA 0 XX 0 spin systems, suggesting <strong>the</strong> presence<br />
of two p-disubstituted phenyl moieties: δH 6.92 (H-2/6) and<br />
7.79 (H-3/5); δ H 7.10 (H-9/13) and 7.98 (H-10/12). The<br />
HMBC and COSY correlations for <strong>the</strong> remaining proton signals<br />
suggested <strong>the</strong> presence of an arginine moiety. Comparison of <strong>the</strong><br />
NMR data of 3 and 1 suggested that <strong>the</strong> 3-carboxyindole ring was<br />
replaced with a p-hydroxybenzoyl moiety in <strong>the</strong> former. The<br />
planar structure of 3, derived <strong>from</strong> <strong>the</strong> observations mentioned<br />
above, was fur<strong>the</strong>r corroborated by FAB-CID-MS/MS analysis<br />
(Figure 3). The negative specific rotation of 3 ([R] 23 D 22)<br />
suggested that it contained D-arginine.<br />
Herdmanine D (4) was obtained as a white powder. The (+)-<br />
FABMS spectrum showed isotopic [M + H] + ion peaks at m/z<br />
421/419 (<strong>the</strong> peak intensities were in a 1:1 ratio), which is<br />
characteristic of a monobrominated compound. The molecular<br />
formula of 4 was deduced as C18H15BrN2O5 on <strong>the</strong> basis of <strong>the</strong><br />
(+)-HRFABMS and NMR data. Peaks due to all 18 carbons were<br />
visible in <strong>the</strong> 13 C NMR spectrum, and HSQC analysis allowed<br />
<strong>the</strong> appropriate assignment of 10 carbon-bound protons (seven<br />
aromatic, one methine, and two methylene protons). The five<br />
remaining protons were exchangeable. 1 H NMR analyses and <strong>the</strong><br />
correlations observed in <strong>the</strong> COSY and HMBC spectrum indicated<br />
Figure 3. Prominent fragmentations of <strong>the</strong> [M + H] + ions of compounds<br />
1 3 in FAB-CID tandem mass spectrometry.<br />
that <strong>the</strong> molecule contained a 3,5,6-trisubstituted indole moiety and<br />
a tyrosine moiety. Comparison of <strong>the</strong> spectroscopic data with those<br />
of 6-bromo-5-hydroxyindole 6 and <strong>the</strong> chemical shift of <strong>the</strong> quaternary<br />
carbons of <strong>the</strong> indole ring, δC 150.0 (C-5) and 107.0 (C-6),<br />
indicated that those positions were substituted by a hydroxy group<br />
and a bromine atom, respectively. A correlation was observed between<br />
H-2 and C-8 (δC 163.2), indicating that <strong>the</strong> C-3 position<br />
of indole is substituted by a carboxy group. The molecular formula<br />
of 4 suggested that <strong>the</strong>se two moieties must be linked between<br />
C-8 and C-9 via an ester linkage. The negative specific rotation<br />
of 4 ([R] 23 D 4.7) suggested that <strong>the</strong> tyrosine moiety had <strong>the</strong><br />
L-configuration. This was corroborated by <strong>the</strong> hydrolysis of 4 and<br />
derivatization with Marfey’s reagent, followed by TLC analysis.<br />
Herdmanine D contains a rare 6-bromo-5-hydroxyindole moiety.<br />
This moiety has been found only in <strong>the</strong> metabolites of <strong>the</strong> muricid<br />
gastropod Drupella fragum, 7 <strong>the</strong> sponge Oceanapia bartschi, 8 and<br />
<strong>the</strong> ascidians Syncarpa oviformis 9 and Eudistoma olivaceum. 10<br />
Arginine derivatives (5 9) isolated <strong>from</strong> <strong>the</strong> ascidian Leptoclinides<br />
sp. 4,5 are analogous to compounds 1 3. However, it is<br />
noteworthy that compounds 1 3 include <strong>the</strong> less common Darginine<br />
unit. The occurrence of D-amino acids in vivo has been<br />
shown by several authors. 11,12 Specifically, microorganisms transform<br />
L-amino acids to D-isomers with amino acid oxidase,<br />
transaminases, and epimerases (racemases). 13,14 From <strong>the</strong> presence<br />
of <strong>the</strong> unusual D-arginine moiety, we can speculate that<br />
compounds 1 3 of this tunicate are <strong>the</strong> metabolites of symbiotic<br />
microorganisms with an arginine epimerase. On <strong>the</strong> o<strong>the</strong>r hand,<br />
it has been reported that <strong>the</strong> total tissue concentration of <strong>the</strong> Damino<br />
acids in 18 species of marine invertebrates ranges <strong>from</strong><br />
0.04 to 0.44 mM. 15 This may support ano<strong>the</strong>r suggestion that <strong>the</strong><br />
uncommon D-arginine originates <strong>from</strong> seawater, which contains<br />
significant amounts of D-amino acids. 15<br />
The effects of compounds 1, 3, and 4 on LPS-induced nitric<br />
oxide (NO) production in RAW 264.7 cells were screened by<br />
measuring <strong>the</strong> accumulated nitrite in <strong>the</strong> culture medium.<br />
Compounds 3 and 4 had moderate suppressive effects on <strong>the</strong><br />
production of NO, with IC50 values of 96 and 9 μM, respectively,<br />
and compound 4 had minimal cytotoxicity, with a IC 50 value of<br />
1794 dx.doi.org/10.1021/np200397g |J. Nat. Prod. 2011, 74, 1792–1797
Journal of Natural Products ARTICLE<br />
Figure 4. Inhibitory effect of compounds 1, 3, and 4 on NO production<br />
(A) and mRNA expression of iNOS of compounds 3 and 4 (B) in <strong>the</strong><br />
LPS-stimulated RAW264.7 cells. (A) Cells were stimulated for 24 h with<br />
pure LPS (1 μg/mL) or with LPS containing <strong>the</strong> test samples at different<br />
concentrations (250, 50, 10, and 2 μM). NO production (columns) was<br />
determined using <strong>the</strong> Griess reagent method. Cell viability (lines) was<br />
determined using <strong>the</strong> WST method. The data represent <strong>the</strong> mean ( SD<br />
of triplicate experiments. (B) Total RNA was isolated in an RNase-free<br />
environment, and iNOS mRNA expression was determined by Western<br />
blotting. β-Actin was used as an internal control.<br />
170 μM (Figure 4A). To examine whe<strong>the</strong>r this suppression of<br />
NO production was due to <strong>the</strong> reduced iNOS expression, RT-<br />
PCR analysis of LPS-stimulated cells was performed. Both compounds<br />
inhibited <strong>the</strong> mRNA expression of iNOS (Figure 4B). The<br />
results indicated that <strong>the</strong>se compounds inhibit NO production via<br />
modulation of iNOS gene expression. Compounds 3 and 4 were<br />
also applied to RAW 264.7 cells to investigate <strong>the</strong> inhibitory effect<br />
on <strong>the</strong> production of cyclooxygenase-2 (COX-2)-derived prostaglandin<br />
E 2 (PGE 2). As depicted in Figure 5A, compounds 3 and 4<br />
showed moderate inhibition of PGE2 production. The correlation<br />
of PGE2 production with <strong>the</strong> mRNA expression of COX-2 was<br />
confirmed (Figure 5B).<br />
In a subsequent investigation on <strong>the</strong> ability of <strong>the</strong> compounds<br />
to inhibit <strong>the</strong> production of pro-<strong>inflammatory</strong> cytokines (TNF-<br />
R, IL-1β, and IL-6), RAW 264.7 cells were cultured with 3 or 4 in<br />
<strong>the</strong> presence of LPS, and <strong>the</strong> respective cytokines were measured<br />
using ELISA. Compounds 3 and 4 showed moderate suppressive<br />
effects on <strong>the</strong> production of IL-6 (Figure 6A). Compound 4 also<br />
showed clear inhibition of <strong>the</strong> mRNA expression of IL-6<br />
(Figure 6B).<br />
Compounds 1, 3, and4 were also evaluated for antibacterial<br />
activity against human pathogenic bacteria (Staphylococcus aureus,<br />
Escherichia coli, Klebsiella aerogenes, Salmonella typhimurium, and<br />
Enterobacter cloacae)because3 and 4 were isolated <strong>from</strong> antibacterial<br />
Figure 5. Inhibitory effect of compounds 3 and 4 on PGE2 production<br />
(A) and mRNA expression of COX-2 (B) in <strong>the</strong> LPS-stimulated<br />
RAW264.7 cells. (A) Cells were stimulated for 24 h with LPS (1 μg/<br />
mL) only or with LPS containing <strong>the</strong> test samples at different concentrations<br />
(50 and 25 μM). PEG2 amounts in <strong>the</strong> culture supernatant were<br />
determined by ELISA. The data represent <strong>the</strong> mean ( SD of triplicate<br />
experiments. (B) mRNA expression was determined by RT-PCR. The<br />
graph represents <strong>the</strong> changes in <strong>the</strong> mRNA levels of COX-2 normalized<br />
by β-actin. The data represent <strong>the</strong> mean ( SD.<br />
fractions. However, <strong>the</strong> aforementioned three compounds did<br />
not show significant activity up to a concentration of 30 μg/disk<br />
(agar diffusion assay).<br />
’ EXPERIMENTAL SECTION<br />
General Experimental Procedures. Optical rotations were<br />
measured using a Jasco DIP-370 digital polarimeter. UV spectra were<br />
recorded using a Shimadzu UV-1601 UV/visible spectrophotometer.<br />
1D and 2D NMR spectra were recorded using Varian UNITY 400 and<br />
Varian INOVA 500 spectrometers, respectively. Chemical shifts were<br />
reported with reference to <strong>the</strong> respective residual solvent or deuterated<br />
solvent peaks (δ H 2.50 and δ C 39.7 for DMSO). FABMS data were<br />
obtained using a JEOL JMS SX-102A. HRFABMS data were obtained<br />
using a JEOL JMS-700 Mstation mass spectrometer. FAB accurate mass<br />
measurement was carried out at a resolution of 10 000. HPLC was<br />
performed using a Gilson 370 pump with a YMC-packed J’sphere ODS-<br />
H80 column (250 10 mm, 4 μm, 80 Å) and a Shodex packed NH-5E<br />
column (250 10 mm, 5 μm) using Shodex RI-71 and Jasco UV-975<br />
detectors.<br />
Animal Material. Herdmania momus was collected by hand with<br />
scuba (15 to 25 m depth) in 2008, off <strong>the</strong> coast of Jeju Island, Korea. The<br />
fresh specimens were immediately frozen and maintained at 20 °C<br />
until <strong>the</strong> chemical investigation. A voucher specimen (J08J-1) was<br />
taxonomically identified by one of <strong>the</strong> authors (S.S.) and deposited at<br />
<strong>the</strong> Laboratory of Phylogenetic Systematics, Sahmyook University.<br />
1795 dx.doi.org/10.1021/np200397g |J. Nat. Prod. 2011, 74, 1792–1797
Journal of Natural Products ARTICLE<br />
Figure 6. Inhibitory effect of compounds 3 and 4 on production (A)<br />
and mRNA expression (B) of cytokines (IL-6, IL-1β, and TNF-R) in <strong>the</strong><br />
LPS-stimulated RAW264.7 cells. (A) The RAW264.7 cells (1.5 10 5<br />
cells/mL) were stimulated for 24 h with pure LPS (1 μg/mL) or with<br />
LPS containing test samples at different concentrations (50 and 25 μM).<br />
The production of cytokines was determined using <strong>the</strong> Griess ELISA<br />
method. The data represent <strong>the</strong> mean ( SD of triplicate experiments.<br />
(B) Effects of compounds 3 and 4 on <strong>the</strong> mRNA expression of cytokines<br />
in <strong>the</strong> LPS-stimulated RAW 264.7 cells. Total RNA was isolated in an<br />
RNase-free environment, and <strong>the</strong> cytokine and β-actin mRNA levels<br />
were measured by RT-PCR.<br />
Extraction and Isolation. The frozen ascidians (0.4 kg) were<br />
chopped into small pieces and extracted with MeOH and CH 2Cl 2 at<br />
room temperature. The combined extract was partitioned between<br />
CH2Cl2 and H2O. The H2O layer was fur<strong>the</strong>r extracted by n-BuOH.<br />
The n-BuOH fraction (6 g) was subjected to reversed-phase MPLC<br />
column chromatography (YMC gel ODS-A, 60 Å, 230 mesh) with a step<br />
gradient solvent system, 30% to 100% MeOH/H2O, to afford 21<br />
fractions. Fraction 11 (37.3 mg), which gave interesting signals in <strong>the</strong><br />
1 H NMR spectrum, was subjected to reversed-phase HPLC (eluent:<br />
50% MeOH) to afford 1 (3.8 mg). Fraction 8 (136.9 mg), which gave 1 H<br />
NMR signals similar to those given by fraction 11, was first purified on a<br />
Shodex packed NH-5E column using 85% MeOH as <strong>the</strong> eluent and<br />
fur<strong>the</strong>r purified on a YMC-packed J’sphere ODS-H80 column using 35%<br />
MeOH as <strong>the</strong> eluent to afford 2 (1.0 mg). Fraction 9 (120.3 mg), one of<br />
<strong>the</strong> antibacterial fractions, was subjected to reversed-phase HPLC<br />
(eluent: 50% MeOH) to obtain 3 (2.6 mg) and 4 (5.8 mg).<br />
Herdmanine A (1): yellow gum; [R] 23 D 18 (c 0.10, MeOH); 1 H and<br />
13 C NMR (see Table 1); (+)-FABMS m/z 438 [M + H] + ; (+)-<br />
HRFABMS m/z 438.1774 (calcd for C22H24N5O5, 438.1771); FAB-<br />
CID-MS/MS m/z 438 (100), 421 (0.4), 294 (2.5), 264 (1.8), 144 (3.4),<br />
121 (0.7).<br />
Herdmanine B (2): white powder; [R] 23 D 33 (c 0.09, MeOH); 1 H<br />
and 13 C NMR (see Table 1); (+)-FABMS m/z 454 [M + H] + ; (+)-<br />
HRFABMS m/z 454.1755 (calcd for C 22H 24N 5O 6, 454.1727); FAB-<br />
CID-MS/MS m/z 454 (100), 437 (0.5), 294 (1.6), 280 (1.0), 160 (2.6).<br />
Herdmanine C (3): white powder; [R] 23 D 22 (c 0.10, MeOH); 1 H<br />
NMR (DMSO, 500 MHz) δ 9.17 (1H, brs, 20-NH), 8.85 (1H, d, J = 7.5<br />
Hz, 15-NH), 7.89 (2H, d, J = 9.0 Hz, H-10, H-12), 7.79 (2H, d, J = 8.5<br />
Hz, H-3, H-5), 7.26 (3H, brs, 22-NH, 23-NH2), 7.10 (2H, d, J = 9.0 Hz,<br />
H-9, H-13), 6.92 (2H, d, J = 8.5 Hz, H-2, H-4), 4.20 (1H, m, H-16), 3.15<br />
(2H, m, H-19), 1.89 (1H, m, H-17a), 1.81 (1H, m, H-17b), 1.57 (2H,<br />
quintet, J = 6.5 Hz, H-18); 13 C NMR (DMSO, 100 MHz) δ 177.6 (C-<br />
24), 165.0 (C-14), 164.7 (C-7), 163.5 (C-1), 157.9 (C-21), 153.1 (C-8),<br />
132.9 (C-3, C-5), 132.5 (C-11), 129.0 (C-10, C-12), 122.0 (C-9, C-13),<br />
119.8 (C-4), 116.3 (C-2, C-6), 55.0 (C-16), 41.2 (C-19), 29.9 (C-15),<br />
25.3 (C-18); (+)-FABMS m/z 415 [M + H] + ; (+)-HRFABMS m/z<br />
415.1595 (calcd for C 20H 23N 4O 6, 415.1618); FAB-CID-MS/MS m/z<br />
417 (100), 398 (1.2), 356 (0.7), 294 (2.0), 241 (3.4), 121 (1.8).<br />
Herdmanine D (4): white powder; [R] 23 D 4.7 (c 0.30, MeOH); 1 H<br />
NMR (DMSO, 500 MHz) δ 12.07 (1H, brs, 1-NH), 10.14 (1H, brs, 18-<br />
NH 2), 9.95 (1H, brs, 18-NH 2), 7.80 (1H, s, H-7), 7.61 (1H, s, H-4), 7.33<br />
(2H, d, J = 8.5 Hz, H-11, H-13), 7.16 (2H, d, J = 8.5 Hz, H-10, H-14),<br />
3.45 (1H, dd, J = 8.5, 4.5 Hz H-16), 3.16 (1H, dd, J = 14.5, 4.5 Hz<br />
H-15a), 2.91 (1H, dd, J = 14.5, 8.0 Hz H-15b); 13 C NMR (DMSO, 100<br />
MHz) δ 170.4 (C-17), 163.2 (C-8), 150.1 (C-9), 150.0 (C-5), 135.2 (C-<br />
12), 135.1 (C-2), 131.7 (C-7a), 130.9 (C-11, C-13), 127.0 (C-3a), 122.5<br />
(C-10, C-14), 116.8 (C-7), 107.0 (C-6), 106.3 (C-4), 105.3 (C-3), 56.1<br />
(C-16), 37.0 (C-15). (+)-FABMS m/z 421/419 [M + H] + , 375/373<br />
[M COOH] + ; (+)-HRFABMS m/z 421.0224/419.0223 (calcd for<br />
C18H16BrN2O5, 421.0222/419.0242).<br />
Preparation of Pyrimidine Derivative and Marfey Analysis<br />
of 1. To a 1 mL vial containing pure 1 (0.5 mg) was added a mixture of<br />
H2O (25 μL), EtOH (50 μL), triethylamine (25 μL), and acetylacetone<br />
(50 μL), and <strong>the</strong> resulting solution was maintained at 110 °C for 4 h in a<br />
screw-cap vial. The reaction mixture was evaporated to dryness under a<br />
stream of N2 to yield <strong>the</strong> dimethylpyrimidine derivative of 1 (1a).<br />
Compound 1a was dissolved in 6 N HCl (1 mL) and hydrolyzed at<br />
110 °C for 24 h. The acid hydrolysate was dried under N 2 to yield <strong>the</strong><br />
arginine dimethylpyrimidine derivative 1b. To <strong>the</strong> acid hydrolysate,<br />
0.1% FDAA (1-fluoro-2,4-dinitrophenyl-5-L-alanine amide) solution in<br />
acetone (100 μL) and 1 M NaHCO3 (20 μL) were added, and <strong>the</strong><br />
mixture was heated at 40 °C for 1 h. After cooling to room temperature,<br />
<strong>the</strong> reaction mixture containing 1c was neutralized with 2 M HCl<br />
(10 μL) and diluted with 0.5 mL of MeOH for TLC analysis (Figure 2).<br />
(1c and those derived <strong>from</strong> au<strong>the</strong>ntic D- and L-arginine showed Rf values<br />
of 0.36 and 0.41, respectively, on a silica gel TLC plate; mobile phase, 3:1<br />
CHCl3/MeOH.) 1 H NMR data of 1b in CD3OD: δH 6.38 (1H, s), 4.05<br />
(1H, t), 3.39 (2H, m), 2.21 (6H, s), 1.83 (2H, m), 1.65 (2H, m).<br />
<strong>Acid</strong> Hydrolysis and Marfey Analysis of 4. Compound 4 (0.5<br />
mg) was dissolved in 6 N HCl (1 mL) and hydrolyzed at 110 °C for 24 h.<br />
The acid hydrolysate was dried under N2. The residue was treated with<br />
FDAA prior to TLC analysis, as described above. (D-Tyr-FDAA and<br />
L-Tyr-FDAA showed R f values of 0.46 and 0.54, respectively, on an RP-<br />
18 F254 TLC plate; mobile phase, 1:1 MeOH/H2O.)<br />
Nitrite Assay. The production of NO was measured, as previously<br />
described by Ryu et al., 16 by using Griess reagent (Sigma). Briefly, RAW<br />
264.7 cells were stimulated with LPS (1 μg/mL), and 100 μL of <strong>the</strong><br />
supernatant was mixed with 100 μL of <strong>the</strong> Griess reagent (0.1%<br />
naphthalene diamine dihydrochloride, 1% sulfanilamide, and 2.5%<br />
H3PO4). The mixture was incubated for 10 min at room temperature.<br />
The absorbance at 540 nm was measured using an ELISA reader<br />
(Amersham Pharmacia Biotech), and <strong>the</strong> results were compared against<br />
a calibration curve using sodium nitrite as <strong>the</strong> standard.<br />
Cytotoxicity Assay. Cell viability was determined by <strong>the</strong> WST-1<br />
(4-[3-iodophenyl]-2-(4-nitrophenyl)-2H-5-tetrazolio)-1,3-benzene disulfonate)<br />
assay. Briefly, <strong>the</strong> cells were stimulated for 24 h with 1 μg/mL of<br />
pure LPS or LPS containing different concentrations of compounds 1, 3,<br />
and 4. Then, <strong>the</strong> cell proliferation reagent WST-1 was added, and <strong>the</strong> cells<br />
were reincubated for 2 h. Thereafter, <strong>the</strong> formazan formed was quantified<br />
by measuring <strong>the</strong> light absorbance at 450 nm using an ELISA plate reader.<br />
Determination of PGE 2. Raw 264.7 cells were seeded in wells and<br />
incubated for 24 h. After incubation, <strong>the</strong> cells were incubated with<br />
1796 dx.doi.org/10.1021/np200397g |J. Nat. Prod. 2011, 74, 1792–1797
Journal of Natural Products ARTICLE<br />
different concentrations of 3 and 4 in <strong>the</strong> presence of LPS (1 μg/mL) for<br />
24 h. The PGE 2 concentration in <strong>the</strong> culture medium was determined<br />
using an ELISA kit.<br />
Measurement of Production of Pro-<strong>inflammatory</strong> Cytokines<br />
(IL-6, IL-1β, and TNF-r). The inhibitory effects of <strong>the</strong> isolated<br />
compounds on IL-6, IL-1β, and TNF-R production were determined by<br />
<strong>the</strong> method previously described by Cho et al. 17 The samples were<br />
dissolved with EtOH and diluted with DMEM. The final concentration<br />
of chemical solvents did not exceed 0.1% in <strong>the</strong> culture medium. Under<br />
<strong>the</strong>se conditions, none of <strong>the</strong> solubilized solvents altered IL-6, IL-1β,or<br />
TNF-R production in RAW 264.7 cells. Before stimulation with LPS<br />
(1 μg/mL) and testing samples, RAW 264.7 cells were incubated for<br />
18 h in 24-well plates under <strong>the</strong> same conditions. Stimuli and <strong>the</strong> testing<br />
samples were <strong>the</strong>n added to <strong>the</strong> culture cells for 24 h. Supernatants were<br />
<strong>the</strong>n collected and assayed for IL-6, IL-1β, and TNF-R content using<br />
mouse ELISA kits (R & D Systems Inc.).<br />
RNA Preparation and RT-PCR. Total RNA was extracted <strong>from</strong><br />
cells in an RNase-free environment using <strong>the</strong> Tri-Reagent method<br />
(MRC) in accordance with <strong>the</strong> manufacturer’s instructions. Reverse<br />
transcription was performed using a First-Strand cDNA Syn<strong>the</strong>sis kit<br />
(Promega). Briefly, total RNA (1 μg) was incubated with oligo(dT) 18<br />
primer at 70 °C for 5 min and cooled on ice for 5 min. After <strong>the</strong> addition<br />
of M-MuLV reverse transcriptase (Promega), dNTP (0.5 μM), and 1 U<br />
RNase inhibitor, <strong>the</strong> reactions were incubated at 25 °C for 5 min and<br />
37 °C for 60 min. M-MuLV reverse transcriptase was inactivated by<br />
heating at 70 °C for 15 min. The PCR was performed using a DNA gene<br />
cycler (BIO-RAD), and <strong>the</strong> amplification was performed in 30 cycles:<br />
94 °C for 45 s (denaturing), 50 58 °C for 45 s (annealing), and 72 °C<br />
for 1 min (extension). The PCR products were separated on 1.2%<br />
agarose gel.<br />
’ ASSOCIATED CONTENT<br />
bS Supporting Information.<br />
1 13<br />
H and C NMR spectra of<br />
compounds 1 4. This material is available free of charge via <strong>the</strong><br />
Internet at http://pubs.acs.org.<br />
’ AUTHOR INFORMATION<br />
Corresponding Author<br />
*Tel: 82-51-510-2803. Fax: 82-51-513-6754. E-mail: jhjung@<br />
pusan.ac.kr.<br />
’ ACKNOWLEDGMENT<br />
This study was financially supported by grants (no. 20090400000<br />
and no. 20090083538) <strong>from</strong> <strong>the</strong> National Research Foundation<br />
of Korea.<br />
’ REFERENCES<br />
(1) Bradley, S. D. Chem. Rev. 1993, 93, 1771–1991.<br />
(2) Tourneau, C. L.; Raymond, E.; Faivre, S. Curr. Pharm. Des. 2007,<br />
13, 3427–3439.<br />
(3) Cheng, J.; Li, R.; Lin, G. Chin. J. Org. Chem. 1995, 15, 445–448.<br />
(4) García, A.; Vazquez, M. J.; Qui~noa, E.; Riguera, R.; Debitus, C.<br />
J. Nat. Prod. 1996, 59, 782–785.<br />
(5) Anthony, R. C.; Vicky, M. A. J. Nat. Prod. 2009, 72, 696–699.<br />
(6) Marfey, P. Carlsberg Res. Commun. 1984, 49, 591–596.<br />
(7) Ochi, M.; Kataoka, K.; Ariki, S.; Iwatsuki, C.; Kodama, M.;<br />
Fukuyama, Y. J. Nat. Prod. 1998, 61, 1043–1045.<br />
(8) Cafieri, C.; Fattorusso, E.; Mahajnah, Y.; Mangoni, A. Z.<br />
Naturforsch. B 1993, 48, 1408–1410.<br />
(9) Rinehart, K. L.; Kobayashi, J.; Harbour, G. C.; Hughes, R. G.;<br />
Mizsak, S. A.; Scahill, T. A. J. Am. Chem. Soc. 1984, 106, 1524–1526.<br />
(10) Elena, A. S.; Vladimir, A. D. Nat. Prod. Commun. 2008,<br />
3, 1617–1620.<br />
(11) Friedman, M. J. Agric. Food Chem. 1999, 47, 3457–3479.<br />
(12) Fujii, N.; Saito, T. Chem. Rec. 2004, 4, 267–278.<br />
(13) Yoshimura, T.; Goto, M. FEBS J. 2008, 275, 3527–3537.<br />
(14) Yoshimura, T.; Esak, N. J. Biosci. Bioeng. 2003, 96, 103–109.<br />
(15) Preston, R. L. Comp. Biochem. Physiol. 1987, 87B, 55–62.<br />
(16) Ryu, S. Y.; Oak, M. H.; Yoon, S. K.; Cho, D. I.; Yoo, G. S. Planta<br />
Med. 2000, 66, 358–360.<br />
(17) Cho, J. Y.; Baik, K. U.; Jung, J. H.; Park, M. H. Eur. J. Pharmacol.<br />
2000, 398, 399–407.<br />
1797 dx.doi.org/10.1021/np200397g |J. Nat. Prod. 2011, 74, 1792–1797