CP-VIZ - Cork Constraint Computation Centre - University College ...
CP-VIZ - Cork Constraint Computation Centre - University College ...
CP-VIZ - Cork Constraint Computation Centre - University College ...

You also want an ePaper? Increase the reach of your titles
YUMPU automatically turns print PDFs into web optimized ePapers that Google loves.
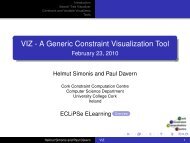
<strong>CP</strong>-<strong>VIZ</strong>: An Open Source Visualization<br />
Platform for <strong>CP</strong><br />
Helmut Simonis and Paul Davern ⋆<br />
<strong>Cork</strong> <strong>Constraint</strong> <strong>Computation</strong> <strong>Centre</strong><br />
Department of Computer Science, <strong>University</strong> <strong>College</strong> <strong>Cork</strong>, Ireland<br />
contact: h.simonis@4c.ucc.ie<br />
Visualization is one of the best techniques for understanding the behaviour<br />
of constraint programs, allowing us to directly observe the impact of changes<br />
by visual inspection instead of using tedious debugging. So far, most constraint<br />
visualization tools have been closely linked to specific solvers, making it difficult<br />
to compare alternative solvers and to reuse development effort spent on other<br />
systems. Previous attempts [1] at generic tools were unsuccessful largely due<br />
to the complexity of the specification. The new, light-weight <strong>CP</strong>-<strong>VIZ</strong> system<br />
provides a simple XML based interface for solvers, and can be easily extended<br />
for new systems and constraints. In <strong>CP</strong>-<strong>VIZ</strong>, we try to visualize the search<br />
tree and the state of variables and (global) constraints in parallel views. The<br />
search tree shows choices, assignments and failures, modelled on the tree display<br />
in the OZ Explorer [3] and later in CHIP [4]. <strong>Constraint</strong>s and variables are<br />
shown in a 2D layout defined by the user, individual global constraints are shown<br />
in custom visualizations similar to [5]. A new constraint can be added to the<br />
package by deriving a new class with a custom drawing method. The design of<br />
the visualization tool was driven by user-requirements, coming mainly from the<br />
development of an ECLiPSe ELearning course.<br />
– We decided to concentrate on post-mortem analysis, which minimizes the requirements<br />
of interaction between the constraint solver and the visualization<br />
environment, but still provides most of the information required for analysis.<br />
– The output of the visualization can be studied on-screen, but can also be<br />
provided as high-quality, vector based print output. Data feeds for other<br />
visualization tools are also provided.<br />
– The tools are solver independent, written in a general purpose language<br />
(Java) and can be easily extended and specialized.<br />
– We added invariant checking at each search node to the functionality, this allows<br />
a solver independent validation of the results, and can highlight missing<br />
propagation in individual constraints.<br />
– The system is platform independent, and is provided as open source. The<br />
system specific XML generation requires minimal effort.<br />
Figure 1 shows the basic architecture of the <strong>CP</strong>-<strong>VIZ</strong> system. The visualization<br />
is driven by annotations in the constraint program. When run in the solver, two<br />
⋆ This work was supported by Science Foundation Ireland (Grant Number<br />
05/IN/I886). The support of Cisco Systems and of the Silicon Valley Community<br />
Foundation is gratefully acknowledged.
XML log files (one for the search tree, the other for the constraint and variable<br />
visualization) are produced. These files are then parsed in the main <strong>CP</strong>-<strong>VIZ</strong><br />
application, producing graphical output as SVG, or as input for other tools<br />
(tree maps, graphs, statistics). The SVG output can be displayed interactively<br />
in the <strong>CP</strong>-<strong>VIZ</strong>Tool, or can be used in multiple ways to produce annotated or<br />
converted output for print or WEB media. Besides the initial interface to the<br />
Fig. 1. Architecture<br />
Program + Annotation<br />
<strong>CP</strong> Solver<br />
TreeLog VisualizationLog<br />
<strong>CP</strong>-<strong>VIZ</strong><br />
Treemap SVG Graph Statistics<br />
Inkscape Browser Batch <strong>CP</strong>-<strong>VIZ</strong>Tool<br />
Annotated Image PDF<br />
ECLiPSe constraint system, interfaces to SICStus Prolog, Choco and the JSR-<br />
331 reference implementations have been or are currently being developed.<br />
References<br />
1. Pierre Deransart. Main results of the OADymPPaC project. In Bart Demoen<br />
and Vladimir Lifschitz, editors, ICLP, volume 3132 of Lecture Notes in Computer<br />
Science, pages 456–457. Springer, 2004.<br />
2. Pierre Deransart, Manuel V. Hermenegildo, and Jan Maluszynski, editors. Analysis<br />
and Visualization Tools for <strong>Constraint</strong> Programming, <strong>Constraint</strong> Debugging (DiS-<br />
CiPl project), volume 1870 of Lecture Notes in Computer Science. Springer, 2000.<br />
3. Christian Schulte. Oz Explorer: A visual constraint programming tool. In ICLP,<br />
pages 286–300, 1997.<br />
4. Helmut Simonis and Abderrahmane Aggoun. Search-tree visualisation. In Deransart<br />
et al. [2], pages 191–208.<br />
5. Helmut Simonis, Abderrahmane Aggoun, Nicolas Beldiceanu, and Eric Bourreau.<br />
Complex constraint abstraction: Global constraint visualisation. In Deransart et al.<br />
[2], pages 299–317.