- Page 1 and 2: Fiifth IInternatiionall Conference
- Page 3 and 4: A Hosoi, K Takamura, N Sato, H Kawa
- Page 5 and 6: Fatigue behaviour of composite tube
- Page 7 and 8: M Quaresimin, R Talreja / Fatigue b
- Page 9 and 10: M Quaresimin, R Talreja / Fatigue b
- Page 11 and 12: M Quaresimin, R Talreja / Fatigue b
- Page 13 and 14: F Schmidt, P Horst / Damage mechani
- Page 15 and 16: F Schmidt, P Horst / Damage mechani
- Page 17 and 18: F Schmidt, P Horst / Damage mechani
- Page 19 and 20: F Schmidt, P Horst / Damage mechani
- Page 21 and 22: F Schmidt, P Horst / Damage mechani
- Page 23 and 24: F Schmidt, P Horst / Damage mechani
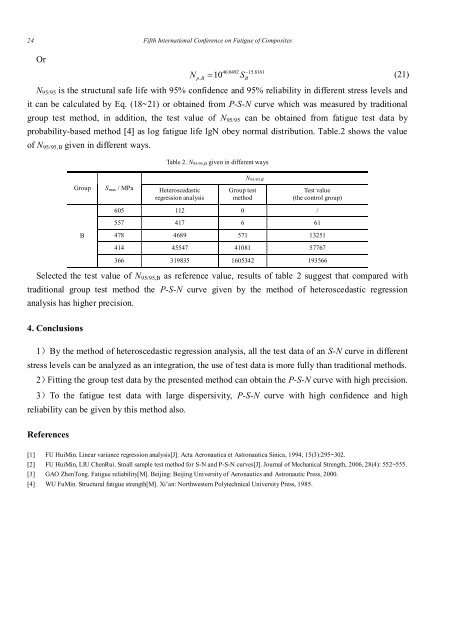
- Page 25 and 26: Abstract An effective method for P-
- Page 27: Where, ˆ, , ˆ0 deviator [3]. D Gu
- Page 31 and 32: M Kawai, Y Matuda, etc. / Constant
- Page 33 and 34: M Kawai, Y Matuda, etc. / Constant
- Page 35 and 36: M Kawai, Y Matuda, etc. / Constant
- Page 37 and 38: M Kawai, Y Matuda, etc. / Constant
- Page 39 and 40: M Kawai, Y Matuda, etc. / Constant
- Page 41 and 42: M Kawai, Y Matuda, etc. / Constant
- Page 43 and 44: M Kawai, Y Matuda, etc. / Constant
- Page 45 and 46: M Kawai, Y Matuda, etc. / Constant
- Page 47 and 48: M Kawai, Y Matuda, etc. / Constant
- Page 49 and 50: plies. K Ogi, R Kitahara, etc. / Ef
- Page 51 and 52: K Ogi, R Kitahara, etc. / Effect of
- Page 53 and 54: K Ogi, R Kitahara, etc. / Effect of
- Page 55 and 56: where 1 K Ogi, R Kitahara, etc. / E
- Page 57 and 58: K Ogi, R Kitahara, etc. / Effect of
- Page 59 and 60: J Lambert, A R Chambers, etc. / Fat
- Page 61 and 62: J Lambert, A R Chambers, etc. / Fat
- Page 63 and 64: J Lambert, A R Chambers, etc. / Fat
- Page 65 and 66: J Lambert, A R Chambers, etc. / Fat
- Page 67 and 68: Cyclic interlaminar crack growth in
- Page 69 and 70: S Stelzer, G Pinter, etc. / Cyclic
- Page 71 and 72: S Stelzer, G Pinter, etc. / Cyclic
- Page 73 and 74: S Stelzer, G Pinter, etc. / Cyclic
- Page 75 and 76: S Stelzer, G Pinter, etc. / Cyclic
- Page 77 and 78: S Stelzer, G Pinter, etc. / Cyclic
- Page 79 and 80:
S Stelzer, G Pinter, etc. / Cyclic
- Page 81 and 82:
Effect of Water Uptake on the Fatig
- Page 83 and 84:
Effect of Water Uptake on the Fatig
- Page 85 and 86:
Effect of Water Uptake on the Fatig
- Page 87 and 88:
Effect of Water Uptake on the Fatig
- Page 89 and 90:
Effect of Water Uptake on the Fatig
- Page 91 and 92:
Effect of Water Uptake on the Fatig
- Page 93 and 94:
Effect of Water Uptake on the Fatig
- Page 95 and 96:
5. Conclusions Effect of Water Upta
- Page 97 and 98:
Effect of Water Uptake on the Fatig
- Page 99 and 100:
Z Trojanová, etc. / Influence of t
- Page 101 and 102:
Z Trojanová, etc. / Influence of t
- Page 103 and 104:
Z Trojanová, etc. / Influence of t
- Page 105 and 106:
Z Trojanová, etc. / Influence of t
- Page 107 and 108:
Delamination during fatigue testing
- Page 109 and 110:
J Bassery, J Renard / Delamination
- Page 111 and 112:
J Bassery, J Renard / Delamination
- Page 113 and 114:
J Bassery, J Renard / Delamination
- Page 115 and 116:
Strength (N) Sample 1 Sample 2 Samp
- Page 117 and 118:
3.2.2 Creep/ recovery test J Basser
- Page 119 and 120:
J Bassery, J Renard / Delamination
- Page 121 and 122:
J Bassery, J Renard / Delamination
- Page 123 and 124:
Stress (MPa) 30 25 20 15 10 5 0 J B
- Page 125 and 126:
J Bassery, J Renard / Delamination
- Page 127 and 128:
4.2.2 Damage mechanism J Bassery, J
- Page 129 and 130:
J Bassery, J Renard / Delamination
- Page 131 and 132:
4.2.3 Stiffness degradation J Basse
- Page 133 and 134:
J Bassery, J Renard / Delamination
- Page 135 and 136:
Abstract A residual stiffness - res
- Page 137 and 138:
W Lian / A residual stiffness - res
- Page 139 and 140:
W Lian / A residual stiffness - res
- Page 141 and 142:
W Lian / A residual stiffness - res
- Page 143 and 144:
W Lian / A residual stiffness - res
- Page 145 and 146:
W Lian / A residual stiffness - res
- Page 147 and 148:
W Lian / A residual stiffness - res
- Page 149 and 150:
W Lian / A residual stiffness - res
- Page 151 and 152:
An Energy-Based Fatigue Approach fo
- Page 153:
An Energy-based Fatigue Approach fo
- Page 157 and 158:
An Energy-based Fatigue Approach fo
- Page 159 and 160:
An Energy-based Fatigue Approach fo
- Page 161 and 162:
An Energy-based Fatigue Approach fo
- Page 163 and 164:
Experimental characterization and a
- Page 165 and 166:
Abstract Calorimetric Analysis of d
- Page 167 and 168:
H Sawadogo, S Panier, S Hariri / Ca
- Page 169 and 170:
H Sawadogo, S Panier, S Hariri / Ca
- Page 171 and 172:
H Sawadogo, S Panier, S Hariri / Ca
- Page 173 and 174:
H Sawadogo, S Panier, S Hariri / Ca
- Page 175 and 176:
H Sawadogo, S Panier, S Hariri / Ca
- Page 177 and 178:
Fatigue-driven Residual Life Models
- Page 179 and 180:
Fatigue-driven Residual Life Models
- Page 181 and 182:
Fatigue-driven Residual Life Models
- Page 183 and 184:
Fatigue-driven Residual Life Models
- Page 185 and 186:
Fatigue-driven Residual Life Models
- Page 187 and 188:
Fatigue-driven Residual Life Models
- Page 189 and 190:
Fatigue-driven Residual Life Models
- Page 191 and 192:
A Hosoi, K Takamura, N Sato, H Kawa
- Page 193 and 194:
A Hosoi, K Takamura, N Sato, H Kawa
- Page 195 and 196:
A Hosoi, K Takamura, N Sato, H Kawa
- Page 197 and 198:
A Hosoi, K Takamura, N Sato, H Kawa
- Page 199 and 200:
M Hojo, Y Matsushita, etc. / Interf
- Page 201 and 202:
M Hojo, Y Matsushita, etc. / Interf
- Page 203 and 204:
M Hojo, Y Matsushita, etc. / Interf
- Page 205 and 206:
M Hojo, Y Matsushita, etc. / Interf
- Page 207 and 208:
M Hojo, Y Matsushita, etc. / Interf
- Page 209 and 210:
M Hojo, Y Matsushita, etc. / Interf
- Page 211 and 212:
M Hojo, Y Matsushita, etc. / Interf
- Page 213 and 214:
Experimental analysis and modelling
- Page 215 and 216:
P Nimdum, J Renard. / Experimental
- Page 217 and 218:
P Nimdum, J Renard. / Experimental
- Page 219 and 220:
P Nimdum, J Renard. / Experimental
- Page 221 and 222:
4. FEM analysis 4.1 Configuration P
- Page 223 and 224:
P Nimdum, J Renard. / Experimental
- Page 225 and 226:
P Nimdum, J Renard. / Experimental
- Page 227 and 228:
P Nimdum, J Renard. / Experimental
- Page 229 and 230:
P Nimdum, J Renard. / Experimental
- Page 231 and 232:
P Nimdum, J Renard. / Experimental
- Page 233 and 234:
References P Nimdum, J Renard. / Ex
- Page 235 and 236:
F Schmidt, T J Adam, P Horst. / Fat
- Page 237 and 238:
F Schmidt, T J Adam, P Horst. / Fat
- Page 239 and 240:
F Schmidt, T J Adam, P Horst. / Fat
- Page 241 and 242:
F Schmidt, T J Adam, P Horst. / Fat
- Page 243 and 244:
F Schmidt, T J Adam, P Horst. / Fat
- Page 245 and 246:
Abstract Fatigue Damage initiation
- Page 247 and 248:
B Esmaeillou, P Fereirra, V Belleng
- Page 249 and 250:
B Esmaeillou, P Fereirra, V Belleng
- Page 251 and 252:
B Esmaeillou, P Fereirra, V Belleng
- Page 253 and 254:
B Esmaeillou, P Fereirra, V Belleng
- Page 255 and 256:
F Q Wu, W X Yao. / Fatigue life pre
- Page 257 and 258:
F Q Wu, W X Yao. / Fatigue life pre
- Page 259 and 260:
F Q Wu, W X Yao. / Fatigue life pre
- Page 261 and 262:
Composite Glass/Epoxy [1] Graphite/
- Page 263 and 264:
F Q Wu, W X Yao. / Fatigue life pre
- Page 265 and 266:
F Q Wu, W X Yao. / Fatigue life pre
- Page 267 and 268:
F Q Wu, W X Yao. / Fatigue life pre
- Page 269 and 270:
2. Experimental procedures C S Shin
- Page 271 and 272:
C S Shin, S W Yang. / Post-Impact F
- Page 273 and 274:
C S Shin, S W Yang. / Post-Impact F
- Page 275 and 276:
C S Shin, S W Yang. / Post-Impact F
- Page 277 and 278:
Delamination detection in CFRP lami
- Page 279 and 280:
N Hu, Y L Liu, H Fukunaga, Y Li. /
- Page 281 and 282:
N Hu, Y L Liu, H Fukunaga, Y Li. /
- Page 283 and 284:
N Hu, Y L Liu, H Fukunaga, Y Li. /
- Page 285 and 286:
N Hu, Y L Liu, H Fukunaga, Y Li. /
- Page 287 and 288:
N Hu, Y L Liu, H Fukunaga, Y Li. /
- Page 289 and 290:
N Hu, Y L Liu, H Fukunaga, Y Li. /
- Page 291 and 292:
5. Conclusion N Hu, Y L Liu, H Fuku
- Page 293 and 294:
S J Zhu, M Kichise, A Usuki, M Kato
- Page 295 and 296:
Fatigue Behavior of Unidirectional
- Page 297 and 298:
2.3 Fatigue Testing H Katogi, Y Shi
- Page 299 and 300:
H Katogi, Y Shimamura, K Tohgo, T F
- Page 301 and 302:
H Katogi, Y Shimamura, K Tohgo, T F
- Page 303 and 304:
H Katogi, Y Shimamura, K Tohgo, T F
- Page 305 and 306:
H Katogi, Y Shimamura, K Tohgo, T F
- Page 307 and 308:
J K Lee, S P Lee, J H Byun. / An ev
- Page 309 and 310:
J K Lee, S P Lee, J H Byun. / An ev
- Page 311 and 312:
J K Lee, S P Lee, J H Byun. / An ev
- Page 313 and 314:
M-H R Jen, Y-C Sung, etc. / Fabrica
- Page 315 and 316:
M-H R Jen, Y-C Sung, etc. / Fabrica
- Page 317 and 318:
M-H R Jen, Y-C Sung, etc. / Fabrica
- Page 319 and 320:
M-H R Jen, Y-C Sung, etc. / Fabrica
- Page 321 and 322:
Fatigue and Fracture of Elastomeric
- Page 323 and 324:
C Bathias, S Y Dong. / Fatigue and
- Page 325 and 326:
C Bathias, S Y Dong. / Fatigue and
- Page 327 and 328:
C Bathias, S Y Dong. / Fatigue and
- Page 329 and 330:
fatigue conditions. C Bathias, S Y
- Page 331 and 332:
Correlation between crack propagati
- Page 333 and 334:
V Trappe, S Günzel / Correlation b
- Page 335 and 336:
Thermal fatigue of AX41 magnesium a
- Page 337 and 338:
Z Drozd, etc. / Thermal fatigue of
- Page 339 and 340:
4. Discussion Z Drozd, etc. / Therm
- Page 341 and 342:
Z Drozd, etc. / Thermal fatigue of
- Page 343 and 344:
Abstract Fatigue behaviour of woven
- Page 345 and 346:
J Y Zhang, Y Fu, L B Zhao, X Z Lian
- Page 347 and 348:
J Y Zhang, Y Fu, L B Zhao, X Z Lian
- Page 349 and 350:
J Y Zhang, Y Fu, L B Zhao, X Z Lian
- Page 351 and 352:
J Y Zhang, Y Fu, L B Zhao, X Z Lian
- Page 353 and 354:
J Y Zhang, Y Fu, L B Zhao, X Z Lian
- Page 355 and 356:
J Y Zhang, Y Fu, L B Zhao, X Z Lian
- Page 357 and 358:
J Y Zhang, Y Fu, L B Zhao, X Z Lian
- Page 359 and 360:
Damage in thermoplastic composite s
- Page 361 and 362:
C Thomas, F Nony, etc. / Damage in
- Page 363 and 364:
C Thomas, F Nony, etc. / Damage in
- Page 365 and 366:
C Thomas, F Nony, etc. / Damage in
- Page 367 and 368:
C Thomas, F Nony, etc. / Damage in
- Page 369 and 370:
C Thomas, F Nony, etc. / Damage in
- Page 371 and 372:
Abstract Residual life predictions
- Page 373 and 374:
H Wu, A Imad, N Benseddi / Residual
- Page 375 and 376:
H Wu, A Imad, N Benseddi / Residual
- Page 377 and 378:
H Wu, A Imad, N Benseddi / Residual
- Page 379 and 380:
H Wu, A Imad, N Benseddi / Residual
- Page 381 and 382:
F Balle, D Eifler / Monotonic and c
- Page 383 and 384:
F Balle, D Eifler / Monotonic and c
- Page 385 and 386:
F Balle, D Eifler / Monotonic and c
- Page 387 and 388:
F Balle, D Eifler / Monotonic and c
- Page 389 and 390:
F Balle, D Eifler / Monotonic and c


![Introduction to RF Stealth [Book Review] - Antennas and ...](https://img.yumpu.com/16857890/1/190x245/introduction-to-rf-stealth-book-review-antennas-and-.jpg?quality=85)