Synthesis, electrical and dielectric properties of lithium iron oxide
Synthesis, electrical and dielectric properties of lithium iron oxide
Synthesis, electrical and dielectric properties of lithium iron oxide

Create successful ePaper yourself
Turn your PDF publications into a flip-book with our unique Google optimized e-Paper software.
Research Article Adv. Mat. Lett. 2013, 4(4), 288-295 ADVANCED MATERIALS Letters<br />
www.amlett.com, www.amlett.org, DOI: 10.5185/amlett.2012.8416 Published online by the VBRI press in 2013<br />
<strong>Synthesis</strong>, <strong>electrical</strong> <strong>and</strong> di<strong>electrical</strong> <strong>properties</strong><br />
<strong>of</strong> <strong>lithium</strong> <strong>iron</strong> <strong>oxide</strong><br />
P. Rosaiah, O. M. Hussain *<br />
Thin film Laboratory, Department <strong>of</strong> Physics, Sri Venkateswara University, Tirupati 517 502, India<br />
* Corresponding author. E-mail: hussainsvu@gmail.com<br />
Received: 31 August 2012, Revised: 16 October 2012 <strong>and</strong> Accepted: 10 November 2012<br />
ABSTRACT<br />
Lithium <strong>iron</strong> <strong>oxide</strong> (LiFeO2) cathode material was prepared by using hydrothermal synthesis. The XRD spectrum exhibited<br />
predominant (200) orientation peak at 2 43.63 o corresponding to cubic rock-salt structure with Fm3m space group <strong>and</strong> the<br />
estimated lattice parameter <strong>of</strong> the sample is 4.176 Å. Electric <strong>and</strong> <strong>dielectric</strong> <strong>properties</strong> were studied over a frequency range <strong>of</strong><br />
1 Hz – 1 MHz <strong>and</strong> in the temperature range from 300 K to 573 K. The ionic conductivity <strong>of</strong> the sample was found to be 1.9 x<br />
10 -6 S/m at 373 K. The temperature dependent conductivity was conformed from the Arrhenius relation <strong>and</strong> the activation<br />
energy was found to be 0.39 eV. A mixed, ionic <strong>and</strong> electronic conduction was observed from the analysis. The <strong>electrical</strong><br />
conductivity was found to be decreased with increasing temperature. The <strong>dielectric</strong> <strong>properties</strong> were analyzed in the framework<br />
<strong>of</strong> complex <strong>dielectric</strong> permittivity <strong>and</strong> complex electric modulus formalisms. The evolution <strong>of</strong> the complex permittivity as a<br />
function <strong>of</strong> frequency <strong>and</strong> temperature was investigated. Several important parameters such as activation energy, ionic hopping<br />
frequency, carrier concentration, ionic mobility <strong>and</strong> diffusion coefficient etc, were determined. Copyright © 2013 VBRI press.<br />
Keywords: Hydrothermal synthesis; LiFeO2 cathode material; <strong>electrical</strong> <strong>and</strong> <strong>dielectric</strong> analysis.<br />
P. Rosaiah was born in 1984. He received<br />
M.Sc. <strong>and</strong> M.Phil. in Physics from Sri<br />
Venkateswara University, Tirupati, India in<br />
2007 <strong>and</strong> 2010. He is pursuing Ph.D. in the<br />
field <strong>of</strong> thin films. He has published 3 papers in<br />
refereed journals. He has presented more than<br />
10 papers in National/International conferences.<br />
He is currently working in the area <strong>of</strong> metal<br />
<strong>oxide</strong> thin film cathodes for micro-battery<br />
applications.<br />
O. M. Hussain has received M.Sc. <strong>and</strong> Ph.D.<br />
degrees in Physics from Sri Venkateswara<br />
University, Tirupati, India in 1984 <strong>and</strong> 1990.<br />
Later, he worked as Post Doctoral Fellow<br />
during 1991-92 in Universite Pierre et Marie<br />
Curie, Paris, France. He joined as a faculty<br />
member in 1992 in the Department <strong>of</strong> Physics,<br />
S.V.University <strong>and</strong> currently working as a<br />
pr<strong>of</strong>essor. His research interests are growth <strong>of</strong><br />
poly crystalline <strong>and</strong> nanocrystalline metal <strong>oxide</strong><br />
thin films for electrochemical, electrochromic<br />
<strong>and</strong> gas sensor applications. So far, he has guided 09 Ph.D. students <strong>and</strong><br />
07 M.Phil. students <strong>and</strong> published about 115 research articles in peer<br />
reviewed journals. He has successfully completed several major research<br />
projects funded by University Grants Commission (UGC), Department <strong>of</strong><br />
Science <strong>and</strong> Technology (DST), Defense Research Development<br />
Organization (DRDO) etc.<br />
Introduction<br />
Lithium ion batteries have become the dominant power<br />
sources for portable electronic devices because <strong>of</strong> their<br />
high energy density. Many researchers have investigated<br />
different cathode materials for the <strong>lithium</strong> secondary<br />
batteries such as layered <strong>oxide</strong>s, LiMO2 (M: Co, Ni, Mn,<br />
Fe) [1-4]. Layered <strong>lithium</strong> metal <strong>oxide</strong> materials have rocksalt<br />
structure where <strong>lithium</strong> <strong>and</strong> transition metal ion<br />
occupying alternate layer <strong>of</strong> octahedral sites in a distorted<br />
close-packed oxygen ion lattice. LiCoO2 has been most<br />
widely used cathode material in commercial <strong>lithium</strong> ion<br />
batteries. But, It has many problems such as high toxic,<br />
high cost, low practical capacity etc [5-6]. Therefore<br />
alternate cathode materials with low cost <strong>and</strong> non toxicity<br />
have been studied in recent years. Among <strong>lithium</strong> transition<br />
metal <strong>oxide</strong>s, LiFeO2 with similar rock-salt structure to<br />
LiCoO2, has been paid more attention due to most<br />
abundance <strong>and</strong> non-toxicity <strong>of</strong> <strong>iron</strong>. In recent years, great<br />
progress has been made recently on its preparation,<br />
structure <strong>and</strong> modification due to extensive use <strong>of</strong> new<br />
synthesis methods [7].<br />
LiFeO2 has various crystalline structures such as α-<br />
LiFeO2, β-LiFeO2, γ-LiFeO2, Layered LiFeO2, Corrugated<br />
LiFeO2, Goethite type LiFeO2 etc [8-9]. The crystalline<br />
structure <strong>of</strong> LiFeO2 depends mainly on the preparation<br />
methods. Many researches prepared LiFeO2 with different<br />
structures. V.R. Galakhov et al. prepared α-LiFeO2 with<br />
Adv. Mat. Lett. 2013, 4(4), 288-295 Copyright © 2013 VBRI press
Research Article Adv. Mat. Lett. 2013, 4(4), 288-295 ADVANCED MATERIALS Letters<br />
Fm-3m space group by using solid state reaction <strong>and</strong> M.<br />
Tabuchi et al. prepared α-LiFeO2 with Fm3m space group<br />
by hydrothermal synthesis [10]. Similarly, β-LiFeO2, γ-<br />
LiFeO2 <strong>and</strong> layered LiFeO2 are prepared by hydrothermal<br />
synthesis <strong>and</strong> other methods [11-12]. Corrugated LiFeO2<br />
<strong>and</strong> Goethite type LiFeO2 are prepared by ion exchange<br />
method [13]. In comparison with the conventional solidphase<br />
synthesis methods [14], hydrothermal method is one<br />
<strong>of</strong> the simplest <strong>and</strong> best methods to prepare <strong>lithium</strong> based<br />
cathode materials. The hydrothermal process is a relatively<br />
low temperature process <strong>and</strong> has many advantages such as<br />
fast reaction kinetics, short processing times, high<br />
crystallinity, high yield, cost effective <strong>and</strong> env<strong>iron</strong>mentally<br />
benign. Also, complex <strong>oxide</strong> materials with phase purity<br />
along with controlled <strong>and</strong> homogeneous particle sizes can<br />
be achieved by properly controlling the process parameters.<br />
Hence, in the present investigation α-LiFeO2 was prepared<br />
by using hydrothermal synthesis.<br />
Studies on the conductivity <strong>of</strong> lithiated cathode<br />
materials are important in order to gain a better imminent<br />
on the ionic conduction mechanism especially in its usage<br />
for <strong>lithium</strong>-ion batteries. Dielectric <strong>and</strong> impedance<br />
spectroscopy is widely used for investigating the <strong>electrical</strong><br />
<strong>and</strong> electrochemical <strong>properties</strong> [15]. The application <strong>of</strong> ac<br />
technique <strong>of</strong> complex impedance analysis is important <strong>and</strong><br />
eliminates pseudo effects if any in the material. Complex<br />
impedance analysis makes it possible to separate the<br />
contribution due to grain, grain boundary <strong>and</strong> interfacial<br />
effects. Generally, these <strong>properties</strong> depend on the resistive<br />
<strong>and</strong> capacitive components in the material. So that, the<br />
result obtained from these analyses provide true<br />
representation <strong>of</strong> <strong>electrical</strong> behavior <strong>of</strong> the sample. In case<br />
<strong>of</strong> the <strong>electrical</strong> <strong>properties</strong> <strong>of</strong> the <strong>oxide</strong>s, grain boundaries<br />
play an important role. The measurement <strong>of</strong> conductivity<br />
<strong>and</strong> permittivity shows dispersion behavior which <strong>of</strong>fers an<br />
opportunity to gain some information <strong>of</strong> ionic migration<br />
process. Considering the significance, the <strong>electrical</strong><br />
conductivity studies on various <strong>lithium</strong>-based <strong>oxide</strong>s such<br />
as LiCoO2, LiCeO2, LiSmO2, Li2SnO3, Li2MnO3, LiMn2O4,<br />
<strong>and</strong> Li2V2O5, <strong>and</strong> others have been reported in the literature<br />
[16-19]. However, to the best <strong>of</strong> our knowledge, there are<br />
meager reports on <strong>electrical</strong> <strong>and</strong> <strong>dielectric</strong> <strong>properties</strong> <strong>of</strong><br />
LiFeO2. A detailed study on the temperature <strong>and</strong> frequency<br />
depended <strong>electrical</strong> <strong>properties</strong> is necessary to underst<strong>and</strong><br />
the conduction mechanism in LiFeO2 for effective<br />
utilization as cathode material in the fabrication <strong>of</strong> <strong>lithium</strong><br />
ion batteries. Hence, in the present study, -LiFeO2<br />
nanocrystalline powder is synthesized from hydrothermal<br />
process <strong>and</strong> systematically characterized. The main<br />
emphasis has been focused on the study <strong>of</strong> <strong>electrical</strong><br />
conduction mechanism <strong>and</strong> <strong>dielectric</strong> behavior. From the<br />
conductivity studies, various important parameters such as<br />
activation energy, ionic hopping frequency, carrier<br />
concentration, ionic mobility, diffusion coefficient etc. are<br />
estimated <strong>and</strong> the results are discussed.<br />
Experimental<br />
α-LiFeO2 with Fm3m space group was prepared by using<br />
hydrothermal synthesis. For that, α-FOOH, Kanto<br />
Chemical Co., (High purity) <strong>and</strong> LiOH.H2O, Aldrich (98%<br />
purity) were used as initial materials. To prepare α-LiFeO2,<br />
α-FOOH was mixed with LiOH.H2O in distilled water<br />
(Li/Fe molar ratio = 30) using a Teflon beaker to avoid<br />
reaction with the vessel. The mixture was treated<br />
hydrothermally at 250 o C <strong>and</strong> 25 Kgf/cm 2 for 6 h. The<br />
product washed repeatedly with distilled water to eliminate<br />
residual LiOH.H2O <strong>and</strong> dried at 100 o C for long time. The<br />
prepared powder was pressed into 12 mm diameter pellet<br />
with the thickness <strong>of</strong> 1 mm <strong>and</strong> then annealed at 500 o C for<br />
5 h to eliminate impurity phases, if any <strong>and</strong> to enhance the<br />
crystallinity <strong>of</strong> the sample.<br />
The structure <strong>of</strong> the prepared sample is studied by the<br />
X-ray diffraction technique (Siefert computerized X-ray<br />
diffractometer, model 3003 TT) using CuK1 radiation<br />
(λ=0.15406 nm) source filtered by Ni thin film at a scan<br />
speed <strong>of</strong> 0.05 degree per second in the 2 – 50 o<br />
<strong>and</strong> operated at a voltage <strong>of</strong> 40 KV <strong>and</strong> a current 30 mA.<br />
The peak positions are determined precisely using<br />
RAYFLEX-Analyze s<strong>of</strong>tware. The particle size <strong>and</strong> shape<br />
was observed by Scanning electron microscope (SEM,<br />
HITACHI, Model: S-3400N) operated in High Vacuum<br />
mode. The Composition <strong>of</strong> the sample is analyzed by<br />
EDAX system (Oxford Instruments, UK). The impedance<br />
measurements were performed using a Phase Sensitive<br />
Multimeter (Model: PSM 1700, UK) in the range <strong>of</strong> 1 Hz<br />
to 1 MHz at different temperatures ranging from room<br />
temperature to 573 K. The measurements were made on a<br />
pressed sintered LiFeO2 pellets coated on both sides with<br />
gold paste in a controlled env<strong>iron</strong>ment. The data was<br />
corrected for sample geometry (area/thickness) prior to<br />
analysis, the parallel capacitance <strong>of</strong> the jig <strong>and</strong> series<br />
resistance <strong>of</strong> the leads <strong>and</strong> electrodes. The experimental<br />
data in real <strong>and</strong> imaginary part <strong>of</strong> the formulism Z, M <strong>and</strong> є<br />
versus frequency at different temperatures are recorded.<br />
Electrical <strong>and</strong> <strong>dielectric</strong> calculations<br />
The <strong>electrical</strong> parameters such as impedance Z, real part <strong>of</strong><br />
the <strong>dielectric</strong> permittivity ’, imaginary part <strong>of</strong> <strong>dielectric</strong><br />
permittivity or <strong>dielectric</strong> loss ’’ ac conductivity ac were<br />
measured by using Phase Sensitive LCR meter. The<br />
<strong>dielectric</strong> constant ’, <strong>and</strong> <strong>dielectric</strong> loss ’’ <strong>of</strong> LiFeO2<br />
sample were calculated by using following relationship.<br />
Dielectric constant (’) = ct/ <br />
Dielectric loss’’) = ac/ <br />
<br />
where ‘t’ is thickness <strong>of</strong> the pellet, ‘A’ is the cross sectional<br />
area <strong>of</strong> the sample, is the permittivity <strong>of</strong> the free space<br />
<strong>and</strong> ac is the ac conductivity <strong>of</strong> the sample.<br />
The ac conductivity is calculated by using conductance<br />
(G) as follows:<br />
ac conductivity (ac) = tG/A (3)<br />
The values <strong>of</strong> ’ <strong>and</strong> ’’ were used to determine the<br />
loss tangent (tanusing following expression:<br />
’’ = ’ tan <br />
Adv. Mat. Lett. 2013, 4(4), 288-295 Copyright © 2013 VBRI press.
where is the phase angle between the electric field <strong>and</strong><br />
the polarization <strong>of</strong> the <strong>dielectric</strong>.<br />
The calculated values <strong>of</strong> the ’ <strong>and</strong> ’’ were used to<br />
calculate the real part (M’) <strong>and</strong> imaginary part (M”) <strong>of</strong> the<br />
electric modulus as follows:<br />
M’ = ’/(’ 2 +’’ 2 ) (5)<br />
M’’ = ’’/(’ 2 +’’ 2 ) (6)<br />
(a)<br />
(b)<br />
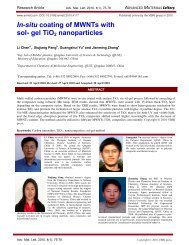
Fig. 1. (a) X-ray diffraction <strong>and</strong> (b) EDAX spectra <strong>of</strong> LiFeO2. Inset figure<br />
shows the SEM image.<br />
Results <strong>and</strong> discussion<br />
Structural analysis<br />
Fig. 1 (a) shows the XRD pattern <strong>of</strong> LiFeO2 sample. All<br />
the diffraction peaks were indexed with α-LiFeO2. The<br />
XRD spectrum exhibited predominant peak (200)<br />
orientation at 2= 43.63 o along with other characteristic<br />
orientations (110), (220), (311), (222) at 37.56 o , 63.34 o ,<br />
75.95 o <strong>and</strong> 80.00 o respectively corresponding to cubic<br />
rock-salt structure with Fm3m space group. The estimated<br />
lattice parameter <strong>of</strong> the sample is 4.176 Å [20]. The<br />
crystallite size <strong>of</strong> the prepared sample was estimated using<br />
Debye-Scherrer formula:<br />
L = K x / x cos <br />
where is the full width half maximum (FWHM) in<br />
radians, is the wavelength <strong>of</strong> the X-ray, is the<br />
Rosaiah <strong>and</strong> Hussain<br />
corresponding Bragg angle <strong>and</strong> K is the constant (k=0.9).<br />
The estimated crystallite size is about 60 nm. The EDAX<br />
experiments were used for the chemical analysis <strong>of</strong> the<br />
sample.<br />
Adv. Mat. Lett. 2013, 4(4), 288-295 Copyright © 2013 VBRI press 290<br />
(c)<br />
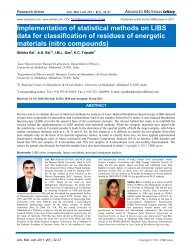
Fig. 2. (a) <strong>and</strong> (b) Variation <strong>of</strong> the real part <strong>of</strong> impedance with respect to<br />
frequency at various temperatures; (c) <strong>and</strong> (d) variation <strong>of</strong> the imaginary<br />
part <strong>of</strong> impedance with respect to frequency at various temperatures; <strong>and</strong><br />
(e) frequency dependence <strong>of</strong> Z’ <strong>and</strong> Z” at 373 K.
Research Article Adv. Mat. Lett. 2013, 4(4), 288-295 ADVANCED MATERIALS Letters<br />
The EDAX spectrum <strong>of</strong> the LiFeO2 sample is shown in<br />
Fig. 1(b) <strong>and</strong> the SEM image is shown as an inset <strong>of</strong> Fig.<br />
1(b). The EDAX spectrum displays the characteristic peaks<br />
corresponding to the binding energy state <strong>of</strong> <strong>iron</strong> <strong>and</strong><br />
oxygen. The peak positions identified are Fe K, Fe L <strong>and</strong><br />
O K1. No other impurity peaks are detected in the<br />
spectrum, which is an indication <strong>of</strong> the chemical purity <strong>of</strong><br />
the sample. Lithium binding energy state can not be<br />
possible to detect from EDAX data for the obvious reason<br />
that the X-ray fluorescence yield is extremely low for Li.<br />
The estimation Fe to O ratio (Fe/O) value is obtained the<br />
0.52. The SEM analysis revealed that the sample consists<br />
<strong>of</strong> homogeneously distributed cubical shaped microcrystals<br />
with an average grain size <strong>of</strong> about 500 nm.<br />
Electrical analysis<br />
The response <strong>of</strong> the real components <strong>of</strong> impedance (Z’)<br />
with frequency for the LiFeO2 sample at different<br />
temperatures is shown in Fig. 2(a) <strong>and</strong> (b). Figure shows<br />
three regions for all temperatures: At higher frequency ><br />
10 3 <strong>and</strong> at low frequencies < 10 Hz. At higher frequencies<br />
> 10 3 Hz, Z’ is almost independent <strong>of</strong> frequency, which is<br />
attributed to the resistance effect. In the frequency range<br />
between these limits, Z’ considerably decreases as the<br />
frequency increases. This indicates that the components <strong>of</strong><br />
capacity <strong>and</strong> resistance <strong>of</strong> the equivalent circuit are active<br />
in this range <strong>of</strong> frequencies. However, for the frequencies <<br />
10 3 Hz, Z’ decreases as temperature increases, implying a<br />
decrease in the total resistance <strong>of</strong> the LiFeO2 sample. The<br />
real component <strong>of</strong> impedance (Z’) is gradually decreased as<br />
the temperature increases. The normalized Z’ is observed<br />
to shift slightly towards higher temperature region as<br />
frequency increases.<br />
Fig. 2(c) <strong>and</strong> (d) show the variation <strong>of</strong> the imaginary<br />
component <strong>of</strong> the impedance (Z”) with the frequency for<br />
different temperature <strong>of</strong> LiFeO2. The Figure shows<br />
relaxation or Debye-type peaks in the low frequency region<br />
<strong>and</strong> the peak intensity <strong>and</strong> peak shift towards higher<br />
frequency region as temperature increases. The increase in<br />
the imaginary component <strong>of</strong> the impedance (Z”) indicates<br />
that the total resistance <strong>of</strong> the sample is decreases whereas<br />
the shift indicates increasing <strong>of</strong> relaxation time (), loss in<br />
the material. The Z”max values are proportional to grain<br />
resistance (Rg) given by the relation Z” = Rg[/(1 +<br />
( 2 )]. The value has been calculated from the peak <strong>of</strong><br />
Z” <strong>and</strong> the asymmetric broadening <strong>of</strong> the peak suggest the<br />
spread <strong>of</strong> at a temperature. If ‘’increase, the relaxation<br />
process become slower <strong>and</strong> vice versa. From the Fig. 2(e),<br />
it is observed that the Z’ as well as Z” curves merges above<br />
100 kHz for all temperatures. This may be due to the<br />
reduction <strong>of</strong> the space charge effect. The contribution <strong>of</strong><br />
the impedance from the grain predominates over the grain<br />
boundary at higher frequencies [21]. Fig. 3 shows the Cole-<br />
Cole plots <strong>of</strong> LiFeO2 sample with different temperature.<br />
These plots allow the resistances related to grain interiors<br />
(bulk), grain boundaries <strong>and</strong> sample/electrode interfaces to<br />
be separated because each <strong>of</strong> them has different relaxation<br />
times, resulting in separate semicircles in the complex<br />
impedance plane. The relaxation frequency for the bulk is<br />
one or two orders <strong>of</strong> magnitude higher than the relaxation<br />
frequency for grain boundaries <strong>and</strong> the relaxation<br />
frequency resulting from the electrode process is much<br />
smaller than relaxation frequency <strong>of</strong> grain boundaries [22].<br />
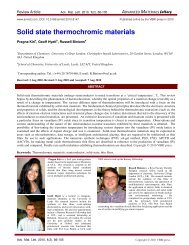
Fig. 3. (a), (b) <strong>and</strong> (c) Cole-Cole plots <strong>of</strong> LiFeO2 at various temperatures.<br />
In Fig. 3, the complex plane <strong>of</strong> LiFeO2 sample, there<br />
are two regions for all temperature, which indicates<br />
different polarization mechanisms within the sample. At<br />
higher frequencies, the figure shows the semicircular arc,<br />
which is attributed to the <strong>electrical</strong> <strong>properties</strong> <strong>of</strong> a parallel<br />
combination <strong>of</strong> bulk resistance <strong>and</strong> capacitance <strong>of</strong> the<br />
LiFeO2 sample. At intermediate <strong>and</strong> low frequencies, the<br />
complex impedance plots for all temperatures show two<br />
overlapped semicircular arcs, which are attributed to the<br />
distribution <strong>of</strong> the grain boundary <strong>and</strong> the sample/electrode<br />
Adv. Mat. Lett. 2013, 4(4), 288-295 Copyright © 2013 VBRI press.
interfaces <strong>of</strong> the LiFeO2. However, the overlapping <strong>of</strong> the<br />
grain boundary <strong>and</strong> sample/electrode interfaces semicircles<br />
is more visible at higher temperatures. The radii <strong>of</strong> the<br />
bulk, grain boundary <strong>and</strong> sample/electrode interface semi<br />
circles decreases as temperature increases from room<br />
temperature to 573 K, which indicates decrease in the total<br />
resistance <strong>of</strong> the sample <strong>and</strong> this explains the decrease <strong>of</strong><br />
Z’ <strong>and</strong> Z” as shown in Fig. 2(a) <strong>and</strong> Fig. 2(d) [23]. The<br />
decrement in the grain <strong>and</strong> grain boundary resistance is<br />
attributed to the conduction mechanism at the grain – grain<br />
boundary.<br />
The bulk conductivity (value has been calculated<br />
using the formula [24],<br />
L/RbA S m -1 (7)<br />
where, Rb is bulk resistance <strong>of</strong> the sample, L is the<br />
thickness <strong>of</strong> the pellet, A is the effective area.<br />
The conductivity values are calculated from the above<br />
relation <strong>and</strong> it is observed that the ionic conductivity<br />
increases with respect to temperature <strong>and</strong> it has been found<br />
to be 1.9 x 10 -6 S/m at 373 K.<br />
(a)<br />
(b)<br />
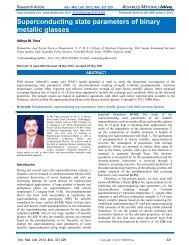
Fig. 4. (a) Graph between ‘’ versus log() at 373 K. (b). Log () versus<br />
1000/T <strong>of</strong> LiFeO2 sample.<br />
Fig. 4 represents the graph versus log for<br />
LiFeO2 sample at 373 K. The figure clearly show two<br />
distinct regions; a low frequency plateau indicating the dc<br />
Rosaiah <strong>and</strong> Hussain<br />
conductivity <strong>of</strong> the material <strong>and</strong> high frequency dispersion<br />
region which obeys the power law feature<br />
proportional to s . The material obeys the Jonsher’s<br />
universal power law equation given by-<br />
acA s (8)<br />
where is the conductivity at zero frequency, which is<br />
normally called the dc conductivity, A is a constant, <strong>and</strong> s<br />
is a characteristic parameter (0
Research Article Adv. Mat. Lett. 2013, 4(4), 288-295 ADVANCED MATERIALS Letters<br />
Fig. 5. (a) <strong>and</strong> (b) Variation <strong>of</strong> the real part <strong>of</strong> <strong>dielectric</strong> constant with<br />
respect to frequency at various temperatures; (c) <strong>and</strong> (d) Variation <strong>of</strong> the<br />
imaginary part <strong>of</strong> <strong>dielectric</strong> constant with respect to frequency at various<br />
temperatures.<br />
Fig. 4(b) shows the temperature dependence <strong>of</strong><br />
conductivity for LiFeO2 sample. From the plot <strong>of</strong> ln <br />
versus for LiFeO2 sample, the temperature<br />
dependence <strong>of</strong> ionic conductivity obeys Arrhenius rule:<br />
exp(-Ea/kT) (12)<br />
Where is a pre-exponential factor, Ea is the<br />
activation energy <strong>of</strong> conduction, T is temperature in Kelvin<br />
<strong>and</strong> k is Boltzmann constant. From the slope <strong>of</strong> the graph,<br />
activation energy can calculate. The estimated activation<br />
energy for LiFeO2 is 0.39 eV [27]. It is observed that the<br />
conductivity increases linearly with temperature gives that<br />
the conduction is thermally activated process.<br />
Adv. Mat. Lett. 2013, 4(4), 288-295 Copyright © 2013 VBRI press.<br />
(b)<br />
Fig. 6. (a) <strong>and</strong> (b) Variation <strong>of</strong> real <strong>and</strong> imaginary part <strong>of</strong> modulus <strong>of</strong><br />
LiFeO2 at various temperatures.<br />
Dielectric studies<br />
The real part <strong>of</strong> the <strong>dielectric</strong> permittivity or <strong>dielectric</strong><br />
constant, ’ <strong>and</strong> imaginary part <strong>of</strong> <strong>dielectric</strong> permittivity or<br />
<strong>dielectric</strong> loss, ’’, for LiFeO2 sample measured in the<br />
frequency range 1 Hz to 1 MHz various temperatures is<br />
shown in Fig. 5(a) <strong>and</strong> (b). It is observed that the <strong>dielectric</strong><br />
constant, ’() is decreased rapidly at lower frequencies<br />
<strong>and</strong> showed almost frequency independent behavior at<br />
higher frequency region[28]. The bulk polarization <strong>of</strong> the<br />
sample results from the presence <strong>of</strong> electrodes, which do
not allow transfer <strong>of</strong> the charge species into the external<br />
circuit. At higher temperatures, ’() is observed to be<br />
increased <strong>and</strong> it might be due to migration <strong>of</strong> the <strong>lithium</strong><br />
ion. The behavior <strong>of</strong> the <strong>dielectric</strong> permittivity with<br />
frequency is related to the applied field, which assists<br />
electron hopping between two different sites <strong>of</strong> the sample.<br />
At higher frequency region, the charge carriers will no<br />
longer be able to rotate sufficiently rapidly, so their<br />
oscillation will begin to lay behind this field resulting in a<br />
decrease <strong>of</strong> <strong>dielectric</strong> permittivity, ’(). Generally, the<br />
relaxation phenomena in <strong>dielectric</strong> materials are associated<br />
with frequency dependent orientational polarization. At low<br />
frequency region, the permanent dipoles align themselves<br />
along the field <strong>and</strong> contribute fully to the total polarization<br />
<strong>of</strong> the <strong>dielectric</strong>. At higher frequency region, the variation<br />
in the field is very rapid for the dipoles to align themselves,<br />
so their contribution to the polarization <strong>and</strong> hence, to<br />
<strong>dielectric</strong> permittivity can become negligible. Therefore,<br />
the <strong>dielectric</strong> permittivity, ’() decreases with increasing<br />
frequency. The decrease <strong>of</strong> the <strong>dielectric</strong> constant ’ can<br />
also explain from interfacial polarization. The interfacial<br />
polarization arises as a result <strong>of</strong> difference in conducting<br />
phase, but is interrupted at grain boundary due to lower<br />
conductivity. Generally in polycrystalline materials, the<br />
grains exhibits semi conducting behavior while the grain<br />
boundary are insulators.<br />
The frequency dependence <strong>of</strong> the <strong>dielectric</strong> loss, ’’()<br />
at different temperatures is shown in Fig. 5(c). The<br />
maximum in the ’’() peak is shifts towards higher<br />
frequency region as the temperature increase indicating a<br />
thermally activated behavior. Generally, the <strong>dielectric</strong><br />
losses at high frequencies are much lower than those<br />
occurring at lower frequencies at specific temperature. This<br />
kind <strong>of</strong> dependence <strong>of</strong> ’’() on frequency is typically<br />
associated with losses by conduction.<br />
An alternate approach to analyze <strong>electrical</strong> relaxation is<br />
electric modulus. The electric modulus M* can be defined<br />
in terms <strong>of</strong> the reciprocal <strong>of</strong> the complex <strong>dielectric</strong> constant<br />
*() as,<br />
M* = 1/*() = M’(M’’( <br />
<br />
where real part <strong>of</strong> complex modulus M’ <strong>and</strong> imaginary<br />
part <strong>of</strong> complex modulus M” can be calculated by using<br />
equations (5) <strong>and</strong> (6).<br />
The frequency dependence <strong>of</strong> M’( <strong>and</strong> M’’( <strong>of</strong><br />
LiFeO2 at different temperatures is shown in Fig. 6. These<br />
Figures explain the relaxation nature <strong>of</strong> <strong>dielectric</strong><br />
<strong>properties</strong> <strong>of</strong> the sample. The M’(is increases with<br />
temperature <strong>and</strong> the maximum in the M’’(shifts towards<br />
higher frequency region with increasing temperature [29].<br />
The frequency above peak maximum M’’(determines<br />
the range in which charge carriers are mobile on long<br />
distances. At frequency above peak maximum M’’( , the<br />
carriers are spatially confined to potential wells, being<br />
mobile on short distances making only localized motion<br />
within the wells. The relaxation time, also calculated<br />
from the M’’( peak by using the following relation, =<br />
1/peak <strong>and</strong> is observed to decrease with increasing<br />
temperature as shown in Fig. 7.<br />
Fig. 7. Relaxation time () versus temperature.<br />
Conclusion<br />
Rosaiah <strong>and</strong> Hussain<br />
LiFeO2 cathode material was synthesized by hydrothermal<br />
method. The X-ray diffraction pattern <strong>of</strong> the prepared<br />
powder was conformed the formation <strong>of</strong> -LiFeO2 with<br />
face centered cubic rock salt structure. The estimated<br />
particle size <strong>of</strong> the LiFeO2 from SEM studies is about 500<br />
nm. The plot <strong>of</strong> log conductivity against reciprocal<br />
temperature obeys Arrhenius rule. Transport parameters<br />
such as activation energy, ionic hopping frequency, carrier<br />
concentration, ionic mobility <strong>and</strong> diffusion coefficient have<br />
been calculated. The activation energy calculated from the<br />
Arrhenius plots was found to be 0.39 eV. The <strong>dielectric</strong><br />
constant was observed to decrease with increase in<br />
frequency. The variation <strong>of</strong> M” as a function <strong>of</strong> frequency<br />
shows the shifting <strong>of</strong> the peaks towards the high frequency<br />
as temperature increases which implies that there is a<br />
distribution <strong>of</strong> ionic relaxation time. The ionic conductivity<br />
<strong>of</strong> the sample was found to be varied from 2.95 x 10 -7 S/m<br />
to 1.74 x 10 -4 S/m by increase in temperature from room<br />
temperature to 573 K.<br />
Acknowledgements<br />
Authors would like to thank University Grants Commission, New Delhi<br />
for providing financial assistance.<br />
References:<br />
1. Jeevan Kumar, P.; Jayanth Babu, K.; Hussain, O.M. Adv. Sci. Eng.<br />
Med. 2012, 4, 190.<br />
DOI: 10.1166/asem.2012.1147<br />
2. Sheu, S.P.; Shih, I.C.; Yao, C.Y.; Chen, J.M.; Hurng, W.M. J. Power<br />
Sources 1997, 68, 558.<br />
DOI: 10.1016/S0378-7753(97)02526-3<br />
3. Jinhan Yao.; ChaoqiShen.; PinjieZhang.; Duncan Gregory, H.;<br />
Lianbang Wang. J. Phys. Chem. Solids 2012, 73, 1390.<br />
DOI: 10.1016/j.jpcs.2012.07.006<br />
4. Lee, Y.S.; Sato, S.; Sun, Y.K.; Kobayakawa, K.; Sato, Y. J. Power<br />
Sources 2003, 119, 258.<br />
DOI: 10.1016/S0378-7753(03)00152-6<br />
5. Robert Armstrong, A.; Daniel Tee, W.; Fabio La Mantia.; Petr Nova,<br />
k.; Peter Bruce, G. J. Amer. Chem. Soc. 2008, 130, 3554.<br />
DOI: 10.1021/ja077651g. ISSN: 0002-7863<br />
6. Heike Gabrisch.; Yasunori Ozawa.; Rachid Yazami. Electrochimica<br />
Acta 2006, 52 1499.<br />
DOI: 10.1016/j.electacta.2006.02.050<br />
7. Abdel-Ghany, A.E.; Mauger, A.; Zaghib, H.; Julien, C.M. J. Power<br />
Sources 2012, 197, 285.<br />
Adv. Mat. Lett. 2013, 4(4), 288-295 Copyright © 2013 VBRI press 294
Research Article Adv. Mat. Lett. 2013, 4(4), 288-295 ADVANCED MATERIALS Letters<br />
DOI : 10.1016/j.powsour.2011.09.054<br />
8. Lee, Y.S.; Sato, S.; Tabuchi, M.; Yoon, C.S.; Sun, Y.K.;<br />
Kobayakawa, K.; Sato, Y. Electrochem. Commun. 2003, 5, 549.<br />
DOI: 10.1016/S1388-2481(03)00118-8<br />
9. Masaaki Hirayama.; Hiroki Tomita.; Kei Kubota.; Ryoji Kanno.; J.<br />
Power Sources 2011, 196, 6809.<br />
DOI: 10.1016/j.jpowsour.2010.10.009<br />
10. Galakhov, V.R.; Kurmaev, E.Z.; Uhlenbrock, S. Solid State<br />
Commun. 1995, 95, 347.<br />
DOI: 10.1016/0038-1098(95)00279-0<br />
11. Michele Catti.; Merced Montero-Campillo.; J. Power Sources 2011,<br />
196, 3955.<br />
DOI: 10.1016/j.jpowsour.2010.11.062<br />
12. Santos-Pena, J.; Crosinier, O.; Brousse, T. Electrochimica Acta<br />
2010, 55, 7511.<br />
DOI: 10.1016/j.electacta.2009.12.069<br />
13. Lee, Y.S.; Sato, S.; Tabuchi, M. Electrochem. Commun. 2003, 5,<br />
549.<br />
DOI: 10.1016/S1388-2481(03)00118-8<br />
14. Ashutosh Tiwar.; Ajay Mishra, K.; Hisatoshi Kobayashi.; Anthony<br />
Turner, P.F. Wiley, USA, ISBN 978-04-709387-99, 2012.<br />
15. Jingwen Yao.; Feng Wu.; Xinping Qiu.; Ning Li.; Yuefeng Su.<br />
Electrochimica Acta 2011, 56, 5587.<br />
DOI: 10.1016/j.electacta.2011.03.141<br />
16. Prabu, M.; Selvasekarap<strong>and</strong>ian, S.; Kulkarni, A.R.; Hirankumar , G.;<br />
Sanjeeviraja, C. J. Rare Earths 2010, 28, 435.<br />
DOI: 10.1016/S1002-0721(09)60128-9<br />
17. Prabu, M.; Selvasekarap<strong>and</strong>ian, S.; Kulkarni, A. R; Hirankumar, G.;<br />
Sakunthala. A. Solid State Ionics 2010, 16, 317.<br />
DOI : 10.1007/s11581-010-0420-7<br />
18. Sung-Woo Kim,.; Su-Il Pyun. J. Electroanalytical. Chem. 2002, 528,<br />
114.<br />
DOI: S0022-0728(02)00900-2<br />
19. Vijayakumar, M.; Selvasekarap<strong>and</strong>ian, S.; Kesavamoorthy, R.;<br />
Koichi Nakamura.; Tatsuo Kanashiro. Mater. Lett. 2003, 57, 3618.<br />
DOI: 10.1016/S0167-577X(03)00137-X<br />
20. Julian Morales.; Jesus Santos-Pena. Electrochem. Commun. 2007, 9,<br />
2116.<br />
DOI: 10.1016/j.elecom.2007.06.013<br />
21. Rao, K.S.; Krishna, P.M.; Prasad, D.M.; Latha, T.S.; Hussain, M.<br />
Euro. Phys. J. Appl. Phys. 2007, 39, 24.<br />
DOI: 10.1051/epjap:2007125<br />
22. Prakash, D.; Yoshitake Masuda.; Sanjeeviraja, C. Solid State Ionics<br />
2012, 18, 35.<br />
DOI : 10.1007/s11581-011-0595-6<br />
23. Subrat, K.; Barik.; Choudhary, R.N.P.; Singh, A.K. Adv. Mat. Lett.<br />
2011, 2, 419.<br />
DOI: 10.5185/amlett.2011.2228<br />
24. Jonscher, A.K. Dielectric relaxation in solids (Chelsea Press, London,<br />
1983).<br />
25. Almond, DP.; West, AR. Solid State Ionics 1987, 23, 27.<br />
DOI: 10.1016/0167-2738(87)90078-6<br />
26. Vijayakumar, M.; Hirankumar, G.; Bhuvaneswari, M.S.;<br />
Selvasekarap<strong>and</strong>ian, S. J. Power Sources 2003, 117, 143.<br />
DOI: 10.1016/S0378-7753(03)00110-1<br />
27. Sohn, R S T M.; Macedo, A A M.; Costa, M M.; Mazzetto, S E.;<br />
Sombra, A S B. Physica Scripta, 2010, 82, 6.<br />
DOI: 10.1088/0031-8949/82/05/055702<br />
28. Ch<strong>and</strong>ra babu, B.; Naresh, V.; Jaya Prakash, B.; Buddhudu, S.<br />
Ferroelectrics Lett. 2011, 38, 124.<br />
DOI: 10.1080/07315171.2011.623610<br />
29. Louati, B.; Guindara, K. Mater. Sci. Eng. B 2012, 117, 838.<br />
DOI: 10.1016/j.mseb.2012.03.050<br />
Adv. Mat. Lett. 2013, 4(4), 288-295 Copyright © 2013 VBRI press.