MRI Spectroscopy in Screening of Prostate Cancer - Anticancer ...
MRI Spectroscopy in Screening of Prostate Cancer - Anticancer ...
MRI Spectroscopy in Screening of Prostate Cancer - Anticancer ...

You also want an ePaper? Increase the reach of your titles
YUMPU automatically turns print PDFs into web optimized ePapers that Google loves.
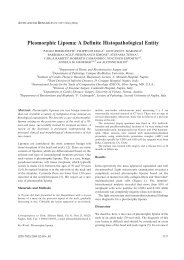
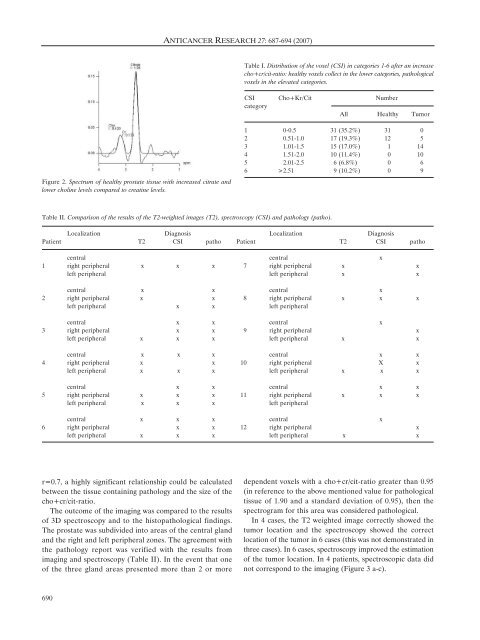
Figure 2. Spectrum <strong>of</strong> healthy prostate tissue with <strong>in</strong>creased citrate and<br />
lower chol<strong>in</strong>e levels compared to creat<strong>in</strong>e levels.<br />
r=0.7, a highly significant relationship could be calculated<br />
between the tissue conta<strong>in</strong><strong>in</strong>g pathology and the size <strong>of</strong> the<br />
cho+cr/cit-ratio.<br />
The outcome <strong>of</strong> the imag<strong>in</strong>g was compared to the results<br />
<strong>of</strong> 3D spectroscopy and to the histopathological f<strong>in</strong>d<strong>in</strong>gs.<br />
The prostate was subdivided <strong>in</strong>to areas <strong>of</strong> the central gland<br />
and the right and left peripheral zones. The agreement with<br />
the pathology report was verified with the results from<br />
imag<strong>in</strong>g and spectroscopy (Table II). In the event that one<br />
<strong>of</strong> the three gland areas presented more than 2 or more<br />
690<br />
ANTICANCER RESEARCH 27: 687-694 (2007)<br />
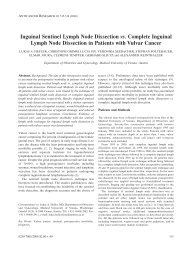
Table II. Comparison <strong>of</strong> the results <strong>of</strong> the T2-weighted images (T2), spectroscopy (CSI) and pathology (patho).<br />
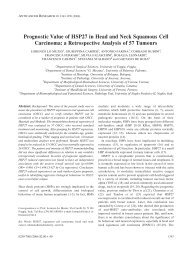
Table I. Distribution <strong>of</strong> the voxel (CSI) <strong>in</strong> categories 1-6 after an <strong>in</strong>crease<br />
cho+cr/cit-ratio: healthy voxels collect <strong>in</strong> the lower categories, pathological<br />
voxels <strong>in</strong> the elevated categories.<br />
CSI Cho+Kr/Cit Number<br />
category<br />
All Healthy Tumor<br />
1 0-0.5 31 (35.2%) 31 0<br />
2 0.51-1.0 17 (19.3%) 12 5<br />
3 1.01-1.5 15 (17.0%) 1 14<br />
4 1.51-2.0 10 (11.4%) 0 10<br />
5 2.01-2.5 6 (6.8%) 0 6<br />
6 >2.51 9 (10.2%) 0 9<br />
Localization Diagnosis Localization Diagnosis<br />
Patient T2 CSI patho Patient T2 CSI patho<br />
central central x<br />
1 right peripheral x x x 7 right peripheral x x<br />
left peripheral left peripheral x x<br />
central x x central x<br />
2 right peripheral x x 8 right peripheral x x x<br />
left peripheral x x left peripheral<br />
central x x central x<br />
3 right peripheral x x 9 right peripheral x<br />
left peripheral x x x left peripheral x x<br />
central x x x central x x<br />
4 right peripheral x x 10 right peripheral X x<br />
left peripheral x x x left peripheral x x x<br />
central x x central x x<br />
5 right peripheral x x x 11 right peripheral x x x<br />
left peripheral x x x left peripheral<br />
central x x x central x<br />
6 right peripheral x x 12 right peripheral x<br />
left peripheral x x x left peripheral x x<br />
dependent voxels with a cho+cr/cit-ratio greater than 0.95<br />
(<strong>in</strong> reference to the above mentioned value for pathological<br />
tissue <strong>of</strong> 1.90 and a standard deviation <strong>of</strong> 0.95), then the<br />
spectrogram for this area was considered pathological.<br />
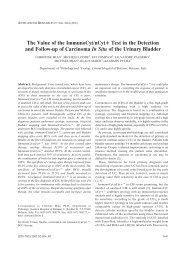
In 4 cases, the T2 weighted image correctly showed the<br />
tumor location and the spectroscopy showed the correct<br />
location <strong>of</strong> the tumor <strong>in</strong> 6 cases (this was not demonstrated <strong>in</strong><br />
three cases). In 6 cases, spectroscopy improved the estimation<br />
<strong>of</strong> the tumor location. In 4 patients, spectroscopic data did<br />
not correspond to the imag<strong>in</strong>g (Figure 3 a-c).