MRI Spectroscopy in Screening of Prostate Cancer - Anticancer ...
MRI Spectroscopy in Screening of Prostate Cancer - Anticancer ...
MRI Spectroscopy in Screening of Prostate Cancer - Anticancer ...
Create successful ePaper yourself
Turn your PDF publications into a flip-book with our unique Google optimized e-Paper software.
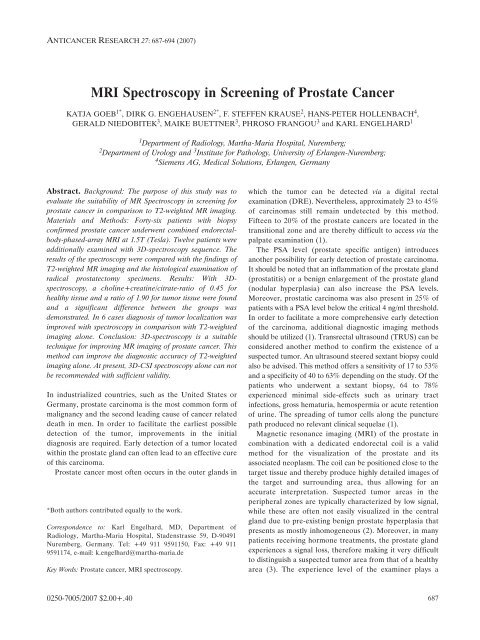
ANTICANCER RESEARCH 27: 687-694 (2007)<br />
<strong>MRI</strong> <strong>Spectroscopy</strong> <strong>in</strong> Screen<strong>in</strong>g <strong>of</strong> <strong>Prostate</strong> <strong>Cancer</strong><br />
KATJA GOEB 1* , DIRK G. ENGEHAUSEN 2* , F. STEFFEN KRAUSE 2 , HANS-PETER HOLLENBACH 4 ,<br />
GERALD NIEDOBITEK 3 , MAIKE BUETTNER 3 , PHROSO FRANGOU 3 and KARL ENGELHARD 1<br />
Abstract. Background: The purpose <strong>of</strong> this study was to<br />
evaluate the suitability <strong>of</strong> MR <strong>Spectroscopy</strong> <strong>in</strong> screen<strong>in</strong>g for<br />
prostate cancer <strong>in</strong> comparison to T2-weighted MR imag<strong>in</strong>g.<br />
Materials and Methods: Forty-six patients with biopsy<br />
confirmed prostate cancer underwent comb<strong>in</strong>ed endorectalbody-phased-array<br />
<strong>MRI</strong> at 1.5T (Tesla). Twelve patients were<br />
additionally exam<strong>in</strong>ed with 3D-spectroscopy sequence. The<br />
results <strong>of</strong> the spectroscopy were compared with the f<strong>in</strong>d<strong>in</strong>gs <strong>of</strong><br />
T2-weighted MR imag<strong>in</strong>g and the histological exam<strong>in</strong>ation <strong>of</strong><br />
radical prostatectomy specimens. Results: With 3Dspectroscopy,<br />
a chol<strong>in</strong>e+creat<strong>in</strong>e/citrate-ratio <strong>of</strong> 0.45 for<br />
healthy tissue and a ratio <strong>of</strong> 1.90 for tumor tissue were found<br />
and a significant difference between the groups was<br />
demonstrated. In 6 cases diagnosis <strong>of</strong> tumor localization was<br />
improved with spectroscopy <strong>in</strong> comparison with T2-weighted<br />
imag<strong>in</strong>g alone. Conclusion: 3D-spectroscopy is a suitable<br />
technique for improv<strong>in</strong>g MR imag<strong>in</strong>g <strong>of</strong> prostate cancer. This<br />
method can improve the diagnostic accuracy <strong>of</strong> T2-weighted<br />
imag<strong>in</strong>g alone. At present, 3D-CSI spectroscopy alone can not<br />
be recommended with sufficient validity.<br />
In <strong>in</strong>dustrialized countries, such as the United States or<br />
Germany, prostate carc<strong>in</strong>oma is the most common form <strong>of</strong><br />
malignancy and the second lead<strong>in</strong>g cause <strong>of</strong> cancer related<br />
death <strong>in</strong> men. In order to facilitate the earliest possible<br />
detection <strong>of</strong> the tumor, improvements <strong>in</strong> the <strong>in</strong>itial<br />
diagnosis are required. Early detection <strong>of</strong> a tumor located<br />
with<strong>in</strong> the prostate gland can <strong>of</strong>ten lead to an effective cure<br />
<strong>of</strong> this carc<strong>in</strong>oma.<br />
<strong>Prostate</strong> cancer most <strong>of</strong>ten occurs <strong>in</strong> the outer glands <strong>in</strong><br />
*Both authors contributed equally to the work.<br />
Correspondence to: Karl Engelhard, MD, Department <strong>of</strong><br />
Radiology, Martha-Maria Hospital, Stadenstrasse 59, D-90491<br />
Nuremberg, Germany. Tel: +49 911 9591150, Fax: +49 911<br />
9591174, e-mail: k.engelhard@martha-maria.de<br />
Key Words: <strong>Prostate</strong> cancer, <strong>MRI</strong> spectroscopy.<br />
0250-7005/2007 $2.00+.40<br />
1 Department <strong>of</strong> Radiology, Martha-Maria Hospital, Nuremberg;<br />
2 Department <strong>of</strong> Urology and 3 Institute for Pathology, University <strong>of</strong> Erlangen-Nuremberg;<br />
4 Siemens AG, Medical Solutions, Erlangen, Germany<br />
which the tumor can be detected via a digital rectal<br />
exam<strong>in</strong>ation (DRE). Nevertheless, approximately 23 to 45%<br />
<strong>of</strong> carc<strong>in</strong>omas still rema<strong>in</strong> undetected by this method.<br />
Fifteen to 20% <strong>of</strong> the prostate cancers are located <strong>in</strong> the<br />
transitional zone and are thereby difficult to access via the<br />
palpate exam<strong>in</strong>ation (1).<br />
The PSA level (prostate specific antigen) <strong>in</strong>troduces<br />
another possibility for early detection <strong>of</strong> prostate carc<strong>in</strong>oma.<br />
It should be noted that an <strong>in</strong>flammation <strong>of</strong> the prostate gland<br />
(prostatitis) or a benign enlargement <strong>of</strong> the prostate gland<br />
(nodular hyperplasia) can also <strong>in</strong>crease the PSA levels.<br />
Moreover, prostatic carc<strong>in</strong>oma was also present <strong>in</strong> 25% <strong>of</strong><br />
patients with a PSA level below the critical 4 ng/ml threshold.<br />
In order to facilitate a more comprehensive early detection<br />
<strong>of</strong> the carc<strong>in</strong>oma, additional diagnostic imag<strong>in</strong>g methods<br />
should be utilized (1). Transrectal ultrasound (TRUS) can be<br />
considered another method to confirm the existence <strong>of</strong> a<br />
suspected tumor. An ultrasound steered sextant biopsy could<br />
also be advised. This method <strong>of</strong>fers a sensitivity <strong>of</strong> 17 to 53%<br />
and a specificity <strong>of</strong> 40 to 63% depend<strong>in</strong>g on the study. Of the<br />
patients who underwent a sextant biopsy, 64 to 78%<br />
experienced m<strong>in</strong>imal side-effects such as ur<strong>in</strong>ary tract<br />
<strong>in</strong>fections, gross hematuria, hemospermia or acute retention<br />
<strong>of</strong> ur<strong>in</strong>e. The spread<strong>in</strong>g <strong>of</strong> tumor cells along the puncture<br />
path produced no relevant cl<strong>in</strong>ical sequelae (1).<br />
Magnetic resonance imag<strong>in</strong>g (<strong>MRI</strong>) <strong>of</strong> the prostate <strong>in</strong><br />
comb<strong>in</strong>ation with a dedicated endorectal coil is a valid<br />
method for the visualization <strong>of</strong> the prostate and its<br />
associated neoplasm. The coil can be positioned close to the<br />
target tissue and thereby produce highly detailed images <strong>of</strong><br />
the target and surround<strong>in</strong>g area, thus allow<strong>in</strong>g for an<br />
accurate <strong>in</strong>terpretation. Suspected tumor areas <strong>in</strong> the<br />
peripheral zones are typically characterized by low signal,<br />
while these are <strong>of</strong>ten not easily visualized <strong>in</strong> the central<br />
gland due to pre-exist<strong>in</strong>g benign prostate hyperplasia that<br />
presents as mostly <strong>in</strong>homogeneous (2). Moreover, <strong>in</strong> many<br />
patients receiv<strong>in</strong>g hormone treatments, the prostate gland<br />
experiences a signal loss, therefore mak<strong>in</strong>g it very difficult<br />
to dist<strong>in</strong>guish a suspected tumor area from that <strong>of</strong> a healthy<br />
area (3). The experience level <strong>of</strong> the exam<strong>in</strong>er plays a<br />
687
critical role <strong>in</strong> these cases (4, 5). H-spectroscopy (magnetic<br />
resonance spectroscopy=MRS) <strong>of</strong> the prostate is a method<br />
that can be comb<strong>in</strong>ed with standard imag<strong>in</strong>g <strong>in</strong> order to<br />
m<strong>in</strong>imize or reduce these factors (2). The purpose <strong>of</strong> this<br />
study was to test the significance <strong>of</strong> endorectal <strong>MRI</strong> us<strong>in</strong>g<br />
T2 weighted imag<strong>in</strong>g as compared to MR spectroscopy <strong>of</strong><br />
the prostate as well as verify <strong>in</strong> the spectrogram a significant<br />
difference <strong>of</strong> the atta<strong>in</strong>ed quantitative values <strong>of</strong> tumor and<br />
healthy tissue <strong>of</strong> the prostate.<br />
Materials and Methods<br />
Patient population. Endorectal <strong>MRI</strong> exam<strong>in</strong>ations were conducted<br />
on 46 patients from 23.03.2001 to 20.11.2005. The average age at<br />
the time <strong>of</strong> the <strong>MRI</strong> exam<strong>in</strong>ation was 65.1 years (49-77). All<br />
patients previously received a biopsy confirm<strong>in</strong>g the presence <strong>of</strong><br />
prostate carc<strong>in</strong>oma. Four patients, as <strong>in</strong>dicated <strong>in</strong> their case history,<br />
also received transurethral resections (TUR) <strong>of</strong> the prostate. Thirtyone<br />
patients received a pre-operative hormone treatment with an<br />
anti-androgen therapy which caused the previously <strong>in</strong>creased PSA<br />
levels to drop <strong>of</strong>f. The <strong>in</strong>itial PSA level was on average 11.24 ng/ml<br />
and the pre-operative levels averaged at 3.49 ng/ml. All patients<br />
were treated by radical prostatectomy. Twelve patients (average age<br />
<strong>of</strong> 63.3 years) also received a 3D-spectroscopy <strong>of</strong> the prostate; all<br />
<strong>of</strong> them received total cross sections.<br />
<strong>MRI</strong> exam<strong>in</strong>ation. The <strong>MRI</strong> exam<strong>in</strong>ation was conducted on a 1.5T<br />
system (Siemens Medical Solutions, Erlangen, Germany:<br />
"Symphony") comb<strong>in</strong>ed with a endorectal-body phased array coil<br />
(Medrad, Pittsburgh, PA, USA). A T2 weighted Turbo Sp<strong>in</strong> Echo<br />
(TSE) sequence <strong>in</strong> the axial, coronal and sagittal planes with an<br />
slice thickness <strong>of</strong> 3 mm was implemented <strong>in</strong> order to cover the total<br />
prostate from the apex to the base, <strong>in</strong>clud<strong>in</strong>g the sem<strong>in</strong>al vesicle.<br />
Additionally, T1 weighted axial images <strong>of</strong> the complete pelvis<br />
<strong>in</strong>clud<strong>in</strong>g the promontory (slice thickness 7 mm) were utilized <strong>in</strong><br />
order to localize hemorrhage after previous biopsy or suspected<br />
lymph nodes.<br />
The axial, coronal and sagittal T2 weighted images enabled the<br />
position<strong>in</strong>g for the measurement <strong>of</strong> the volume <strong>of</strong> the prostate<br />
(VOI=volume <strong>of</strong> <strong>in</strong>terest) for the 3D spectroscopy which was<br />
accompanied only by the endorectal receiver coil. The exam<strong>in</strong>er<br />
positioned the VOI <strong>of</strong> the MRS exam<strong>in</strong>ation on the images show<strong>in</strong>g<br />
the largest diameter <strong>of</strong> the prostate <strong>in</strong> all three planes. Presats<br />
(satbands) were positioned <strong>in</strong> all directions around the prostate.<br />
Outer volume suppression <strong>in</strong> directions around the prostate must be<br />
utilized <strong>in</strong> order to elim<strong>in</strong>ate disturbances <strong>of</strong> the spectra caused by<br />
periprostatic tissue, fat, rectum or the coil. The VOI presented a<br />
matrix <strong>of</strong> 16x16x8 or 16x16x16 (Figures 1a and 3a). The nom<strong>in</strong>al voxel<br />
size was 13x5x5 respectfully, 5x5x5 mm. Additionally a manual shim<br />
(tun<strong>in</strong>g <strong>of</strong> the gradients) was performed <strong>in</strong> order to compensate for<br />
<strong>in</strong>homogeneities <strong>of</strong> the magnet field.<br />
The scan for the spectroscopy lasted approximately 8 to 10 m<strong>in</strong>.<br />
The entire exam<strong>in</strong>ation <strong>in</strong>clud<strong>in</strong>g the preparation <strong>of</strong> the patient<br />
and the measurement required about 1 hour. Additionally, the<br />
<strong>in</strong>dividual spectra were evaluated via an <strong>in</strong>teractive post process<strong>in</strong>g<br />
computer program.<br />
The 3D-spectroscopy resulted from the excitation <strong>of</strong> hydrogen<br />
molecules that were <strong>in</strong>duced by the HF pulses. Thereby, a 3D<br />
version <strong>of</strong> a PRESS sequence (po<strong>in</strong>t resolved spectroscopy) was<br />
688<br />
ANTICANCER RESEARCH 27: 687-694 (2007)<br />
utilized to exactly localize the VOI. The VOI was then subdivided<br />
<strong>in</strong>to a matrix <strong>of</strong> voxels us<strong>in</strong>g phase encod<strong>in</strong>g <strong>in</strong> 3 dimensions<br />
(chemical shift imag<strong>in</strong>g-CSI or MR spectroscopic imag<strong>in</strong>g MRSI).<br />
The different metabolites <strong>in</strong> the exam<strong>in</strong>ed tissue were excited<br />
through wide band RF pulses. The atta<strong>in</strong>ed signal was composed<br />
<strong>of</strong> a mixed frequency (FID) which, via the Fourier transform, could<br />
be separated accord<strong>in</strong>g to their frequencies and <strong>in</strong>to a spectrum<br />
which was then depicted by a diagram.<br />
The cl<strong>in</strong>ical MRS <strong>of</strong> the prostate is able to clearly image<br />
substances conta<strong>in</strong><strong>in</strong>g chol<strong>in</strong>e, citrate and creat<strong>in</strong>e. They appeared<br />
<strong>in</strong> def<strong>in</strong>ite locations on the X-axis: citrate at 2.6 ppm, creat<strong>in</strong>e at<br />
3.00 ppm and chol<strong>in</strong>e at 3.2 ppm (4, 6).<br />
In tumorous tissue, it is characteristic to see a reduction <strong>of</strong> the<br />
citrate and an <strong>in</strong>crease <strong>of</strong> the chol<strong>in</strong>e and creat<strong>in</strong>e concentrations<br />
(Figure 1b) <strong>in</strong> contrast to healthy tissue, where a high citrate and a<br />
lower chol<strong>in</strong>e and creat<strong>in</strong>e (Figure 2) are normally seen (6).<br />
The chol<strong>in</strong>e and creat<strong>in</strong>e peaks typically lay close to one<br />
another. For this reason, chol<strong>in</strong>e and creat<strong>in</strong>e <strong>of</strong>ten comb<strong>in</strong>e to one<br />
value and this total was then evaluated as a relationship to citrate<br />
(chol<strong>in</strong>e + creat<strong>in</strong>e/citrate ratio=cho+cr/cit-ratio). The <strong>in</strong>tegral <strong>of</strong><br />
these peaks was then calculated and the ratio <strong>of</strong> both <strong>in</strong>tegrals was<br />
applied. The result<strong>in</strong>g area under the spectrum was proportional<br />
to the concentration <strong>of</strong> the sp<strong>in</strong>s and the metabolites. Post<br />
process<strong>in</strong>g <strong>of</strong> these po<strong>in</strong>ts was performed <strong>in</strong> order to facilitate a<br />
quantified spectrum (6).<br />
Pathology. In all 46 patients, pelvic lymph nodes were removed<br />
together with radical prostatectomy <strong>in</strong>clud<strong>in</strong>g capsule, sem<strong>in</strong>al<br />
vesicles and ampules. Twenty-eight specimens were available for<br />
histopathological exam<strong>in</strong>ation us<strong>in</strong>g total cross sections and slices<br />
that conta<strong>in</strong>ed the largest area <strong>of</strong> tumor growth were analyzed.<br />
Histological sections were scanned and the extent <strong>of</strong> tumor growth<br />
was <strong>in</strong>dicated, so that a comparison to the <strong>MRI</strong> images and the<br />
spectroscopy was possible. In 18 rema<strong>in</strong><strong>in</strong>g cases, only<br />
histopathology reports were available for analysis. Prostatic<br />
carc<strong>in</strong>oma was restricted to one lobe (pT2a/b) <strong>in</strong> 19 cases, both<br />
lobes were affected by disease (pT2c) <strong>in</strong> 10 cases, 5 tumors showed<br />
growth outside the capsule (pT3a), 8 an <strong>in</strong>filtration <strong>of</strong> the sem<strong>in</strong>al<br />
vesicle (pT3b) and 4 expanded beyond the organ (pT4). In 7<br />
patients regional lymph node metastases were present (N1). The<br />
Gleason Score was on the average <strong>of</strong> 6.5 (Gleason 3-9).<br />
Comparison <strong>of</strong> the <strong>MRI</strong> images and the spectroscopy with the<br />
pathology. The images <strong>of</strong> the exam<strong>in</strong>ed patients were analyzed by<br />
two <strong>in</strong>dependent radiologists experienced <strong>in</strong> prostate <strong>MRI</strong>. The<br />
estimation <strong>of</strong> the tumor and the subsequent stag<strong>in</strong>g <strong>of</strong> the cancer<br />
were agreed upon by the pr<strong>of</strong>essionals. The <strong>MRI</strong> f<strong>in</strong>d<strong>in</strong>gs were<br />
compared with the pathological f<strong>in</strong>d<strong>in</strong>gs and the results were<br />
shown <strong>in</strong> a four field chart. The evaluation <strong>of</strong> the spectroscopy was<br />
performed on a voxel-by-voxel basis so that each voxel could be<br />
def<strong>in</strong>ed with its appropriate cho+cr/cit-ratio. Voxels positioned<br />
outside the marg<strong>in</strong>s <strong>of</strong> the prostate, voxels not display<strong>in</strong>g the<br />
typical characteristics and voxels which did not clearly refer to<br />
pathology or normal tissue were not considered. In addition, the<br />
spectroscopic data <strong>of</strong> 12 patients, the image f<strong>in</strong>d<strong>in</strong>gs and the<br />
pathology were correlated.<br />
The exam<strong>in</strong>er <strong>of</strong> the specimens marked with<strong>in</strong> the tumor area 2 to<br />
7 voxels (depend<strong>in</strong>g upon the size <strong>of</strong> the tumor) as pathological. In<br />
order to create a comparison with the tissues show<strong>in</strong>g pathology, the<br />
same number <strong>of</strong> voxels was required from normal tissue (Figure 2).
Statistics. The comparison <strong>of</strong> the <strong>MRI</strong> images and the pathology<br />
were shown <strong>in</strong> a four field chart. The sensitivity, specificity and the<br />
total accuracy were then calculated. The results from imag<strong>in</strong>g were<br />
then compared with the spectroscopy and the pathology. The<br />
values from the 3D spectroscopy <strong>of</strong> the pathological and healthy<br />
tissues were checked for a significant difference as <strong>in</strong>dicated by the<br />
t-test for <strong>in</strong>dependent random samples and the pre-performed<br />
Levene test. In addition, the values for the cho+cr/cit ratio were<br />
categorized and correlated.<br />
Results<br />
Endorectal <strong>MRI</strong>. A sensitivity <strong>of</strong> 59%, a specificity <strong>of</strong> 66%<br />
and a total accuracy <strong>of</strong> 63% for the growth <strong>of</strong> the tumor<br />
outside the capsule was atta<strong>in</strong>ed. The <strong>in</strong>filtration <strong>of</strong> sem<strong>in</strong>al<br />
vesicle was determ<strong>in</strong>ed to have a sensitivity <strong>of</strong> 27%, a<br />
specificity <strong>of</strong> 89% and a total accuracy <strong>of</strong> 74%. The<br />
<strong>in</strong>volvement <strong>of</strong> the lymph nodes was diagnosed with a<br />
sensitivity <strong>of</strong> 29%, a specificity <strong>of</strong> 97% and a total accuracy<br />
<strong>of</strong> 86%.<br />
Goeb et al: <strong>MRI</strong> <strong>Spectroscopy</strong> <strong>in</strong> <strong>Prostate</strong> <strong>Cancer</strong><br />
Figure 1. a-c) Comparison <strong>of</strong> the 3D-spectroscopy and the specimen <strong>in</strong><br />
the tumor area. a) Position<strong>in</strong>g <strong>of</strong> the volume <strong>of</strong> <strong>in</strong>terest (VOI) above the<br />
prostate. The 16x16-matrix is <strong>in</strong> the background. The selected voxels reside<br />
<strong>in</strong> a signal poor area on the left side <strong>of</strong> the peripheral zone. b) Spectrum<br />
<strong>of</strong> a displayed voxel. Chol<strong>in</strong>e levels compared to creat<strong>in</strong>e levels are clearly<br />
<strong>in</strong>creased, while citrate levels are reduced. c) Specimens from the same<br />
patient. The tumor area is color coded. Correlation with spectroscopy.<br />
3D spectroscopy. In a comparison <strong>of</strong> the spectroscopy to the<br />
pathological f<strong>in</strong>d<strong>in</strong>gs <strong>of</strong> the biopsy specimen, it was<br />
determ<strong>in</strong>ed that 44 voxels conta<strong>in</strong>ed healthy tissue and 44<br />
conta<strong>in</strong>ed tumor tissue. The average value for healthy tissue<br />
was 0.45 with a standard deviation <strong>of</strong> 0.21. The tissue<br />
conta<strong>in</strong><strong>in</strong>g cancer cells had an average value <strong>of</strong> 1.90 with a<br />
standard deviation <strong>of</strong> 0.95. Both groups were exam<strong>in</strong>ed<br />
us<strong>in</strong>g the t-test for <strong>in</strong>dependent random samples to<br />
determ<strong>in</strong>e the differences <strong>in</strong> their average values. A highly<br />
significant conclusion was that the two groups differentiated<br />
themselves with an error probability <strong>of</strong> p
Figure 2. Spectrum <strong>of</strong> healthy prostate tissue with <strong>in</strong>creased citrate and<br />
lower chol<strong>in</strong>e levels compared to creat<strong>in</strong>e levels.<br />
r=0.7, a highly significant relationship could be calculated<br />
between the tissue conta<strong>in</strong><strong>in</strong>g pathology and the size <strong>of</strong> the<br />
cho+cr/cit-ratio.<br />
The outcome <strong>of</strong> the imag<strong>in</strong>g was compared to the results<br />
<strong>of</strong> 3D spectroscopy and to the histopathological f<strong>in</strong>d<strong>in</strong>gs.<br />
The prostate was subdivided <strong>in</strong>to areas <strong>of</strong> the central gland<br />
and the right and left peripheral zones. The agreement with<br />
the pathology report was verified with the results from<br />
imag<strong>in</strong>g and spectroscopy (Table II). In the event that one<br />
<strong>of</strong> the three gland areas presented more than 2 or more<br />
690<br />
ANTICANCER RESEARCH 27: 687-694 (2007)<br />
Table II. Comparison <strong>of</strong> the results <strong>of</strong> the T2-weighted images (T2), spectroscopy (CSI) and pathology (patho).<br />
Table I. Distribution <strong>of</strong> the voxel (CSI) <strong>in</strong> categories 1-6 after an <strong>in</strong>crease<br />
cho+cr/cit-ratio: healthy voxels collect <strong>in</strong> the lower categories, pathological<br />
voxels <strong>in</strong> the elevated categories.<br />
CSI Cho+Kr/Cit Number<br />
category<br />
All Healthy Tumor<br />
1 0-0.5 31 (35.2%) 31 0<br />
2 0.51-1.0 17 (19.3%) 12 5<br />
3 1.01-1.5 15 (17.0%) 1 14<br />
4 1.51-2.0 10 (11.4%) 0 10<br />
5 2.01-2.5 6 (6.8%) 0 6<br />
6 >2.51 9 (10.2%) 0 9<br />
Localization Diagnosis Localization Diagnosis<br />
Patient T2 CSI patho Patient T2 CSI patho<br />
central central x<br />
1 right peripheral x x x 7 right peripheral x x<br />
left peripheral left peripheral x x<br />
central x x central x<br />
2 right peripheral x x 8 right peripheral x x x<br />
left peripheral x x left peripheral<br />
central x x central x<br />
3 right peripheral x x 9 right peripheral x<br />
left peripheral x x x left peripheral x x<br />
central x x x central x x<br />
4 right peripheral x x 10 right peripheral X x<br />
left peripheral x x x left peripheral x x x<br />
central x x central x x<br />
5 right peripheral x x x 11 right peripheral x x x<br />
left peripheral x x x left peripheral<br />
central x x x central x<br />
6 right peripheral x x 12 right peripheral x<br />
left peripheral x x x left peripheral x x<br />
dependent voxels with a cho+cr/cit-ratio greater than 0.95<br />
(<strong>in</strong> reference to the above mentioned value for pathological<br />
tissue <strong>of</strong> 1.90 and a standard deviation <strong>of</strong> 0.95), then the<br />
spectrogram for this area was considered pathological.<br />
In 4 cases, the T2 weighted image correctly showed the<br />
tumor location and the spectroscopy showed the correct<br />
location <strong>of</strong> the tumor <strong>in</strong> 6 cases (this was not demonstrated <strong>in</strong><br />
three cases). In 6 cases, spectroscopy improved the estimation<br />
<strong>of</strong> the tumor location. In 4 patients, spectroscopic data did<br />
not correspond to the imag<strong>in</strong>g (Figure 3 a-c).
Discussion<br />
The prostate tumor stag<strong>in</strong>g results obta<strong>in</strong>ed <strong>in</strong> this study<br />
were less accurate, <strong>in</strong> comparison with the results <strong>of</strong> other<br />
researchers. For tumor growth outside the prostate capsule<br />
and tumour <strong>in</strong>vasion <strong>in</strong>to the sem<strong>in</strong>al vesicle, a sensitivity <strong>of</strong><br />
59% and 27%, respectively, a specificity <strong>of</strong> 66% and 89%,<br />
respectively, and a total accuracy <strong>of</strong> 63% and 74%,<br />
respectively were obta<strong>in</strong>ed. Pegios et al. (7) achieved higher<br />
values for tumor growth (sensitivity 100%, specificity 87-<br />
93% and a target accuracy <strong>of</strong> 94-97%) as well as for the<br />
sem<strong>in</strong>al vesicle (sensitivity 100%, specificity 84% and a<br />
target accuracy <strong>of</strong> 88%). Comet-Batlle et al. atta<strong>in</strong>ed a<br />
sensitivity <strong>of</strong> 80%, a specificity <strong>of</strong> 76.12% and a total<br />
accuracy <strong>of</strong> 77.17%, although only needle biopsies but not<br />
large sections <strong>of</strong> radical prostatectomy specimens were<br />
available for comparison (8). It is important to note that<br />
needle biopsies for cancer confirmation can be <strong>in</strong>accurate<br />
<strong>in</strong> grad<strong>in</strong>g. Another cause for our lower stag<strong>in</strong>g results<br />
could be due to the fact that 31 patients at the time <strong>of</strong> the<br />
Goeb et al: <strong>MRI</strong> <strong>Spectroscopy</strong> <strong>in</strong> <strong>Prostate</strong> <strong>Cancer</strong><br />
Figure 3. a-c) False-positive spectroscopy. a) Voxel <strong>in</strong> the central gland. b)<br />
Spectrum <strong>of</strong> shown voxel. Chol<strong>in</strong>e levels compared to creat<strong>in</strong>e levels are<br />
clearly <strong>in</strong>creased, while citrate levels are somewhat reduced. c) Specimen<br />
from the same patient. The tumor area is color coded. No correlation with<br />
spectroscopy.<br />
<strong>MRI</strong> exam<strong>in</strong>ation had undergone hormone treatment. As a<br />
result, <strong>of</strong> an <strong>in</strong>volution <strong>of</strong> the gland caused a signal loss <strong>of</strong><br />
the organ which can render recognition <strong>of</strong> the tumor very<br />
difficult (3).<br />
The <strong>in</strong>volvement <strong>of</strong> the lymph nodes was determ<strong>in</strong>ed with<br />
results (sensitivity 29%, specificity 97%) similar to those<br />
reported by Pegios et al. (7) who reported a sensitivity <strong>of</strong><br />
25% and a specificity <strong>of</strong> 95%. The question arises as to<br />
whether or not it is possible to use spectroscopy as a method<br />
to improve tumor diagnosis dur<strong>in</strong>g the <strong>MRI</strong> exam. First, the<br />
validity <strong>of</strong> the method was verified. 3-D spectroscopy<br />
verified the middle values <strong>of</strong> the cho+cr/cit-ratio <strong>of</strong> the<br />
spectrum for healthy and tumorous areas <strong>of</strong> the prostate,<br />
reveal<strong>in</strong>g a significant difference <strong>in</strong> these values. In healthy<br />
tissue values <strong>of</strong> 0.45 (±0.21) were obta<strong>in</strong>ed, while <strong>in</strong><br />
cancerous tissue a value <strong>of</strong> 1.90 (±0.95) was obta<strong>in</strong>ed and<br />
was somewhat elevated compared to other studies. Joung et<br />
al. used the textbook value <strong>of</strong> 0.22±0.013 as the gold<br />
standard for normal tissue, which was also confirmed by<br />
their exam<strong>in</strong>ation (0.25±0.12) (9). Tissues def<strong>in</strong>ed by values<br />
691
greater than 0.22 + 3 standard deviations were highly<br />
suspected as tumorous. Mueller-Lisse et al. (10) concluded<br />
that 0.24±0.13 were values for healthy tissue and those<br />
tissues with 3 standard deviations were considered<br />
tumorous. Scheidler et al. (4) reported results somewhat less<br />
accurate and stated that tissue with a ratio less than 0.75<br />
was healthy and tissue greater than 0.75 was tumorous.<br />
Nevertheless, these studies only considered high quality<br />
voxels for the spectroscopy, which would expla<strong>in</strong> the higher<br />
values obta<strong>in</strong>ed <strong>in</strong> our exam<strong>in</strong>ation (spectroscopy was not<br />
always optimal). In particular, elderly patients could not<br />
always be positioned comfortably <strong>in</strong> order to m<strong>in</strong>imize the<br />
motion effect artefact. Another criterion for the quality <strong>of</strong><br />
the measurement was the position<strong>in</strong>g <strong>of</strong> the presets <strong>in</strong> the<br />
periprostatic space <strong>in</strong> order to mask disturb<strong>in</strong>g fat signals<br />
(outer volume suppression). Depend<strong>in</strong>g on the form and<br />
size <strong>of</strong> the prostate, complete suppression could not always<br />
be guaranteed. Gradient shimm<strong>in</strong>g could not compensate<br />
for all <strong>of</strong> the <strong>in</strong>homogenities <strong>in</strong>herent to the magnet field.<br />
As a result, the bandwidth <strong>of</strong> the spectrum caused a loss <strong>in</strong><br />
the accuracy.<br />
Another limitation was the voxel selection. In the above<br />
mentioned studies (9, 10) only the voxels from the<br />
peripheral zone were selected. In this location, 60 to 75%<br />
<strong>of</strong> the prostate carc<strong>in</strong>omas are generally found, while 10 to<br />
15% <strong>of</strong> tumors are located <strong>in</strong> the transitional zone (1). Kaji<br />
et al. confirmed with healthy volunteers a normal<br />
cho+cr/cit-ratio range from 0.58±0.38 for the peripheral<br />
zone and from 0.72±0.51 for the transitional zone <strong>of</strong> the<br />
gland (11). Similar conclusions were reported by<br />
Kurhanewicz et al. with 0.54±0.11 and 0.83±0.34 for the<br />
peripheral zones and central gland, respectively (12). We<br />
can thus expect to obta<strong>in</strong> lower values for the cho+cr/cit<br />
ratio <strong>in</strong> the peripheral areas than <strong>in</strong> the central glands. For<br />
this reason, our results <strong>in</strong>clud<strong>in</strong>g high values from the<br />
central gland and low values from the peripheral zone<br />
comply with those values previously reported.<br />
S<strong>in</strong>ce a significant difference could be proved regard<strong>in</strong>g<br />
the metabolic ratio <strong>of</strong> healthy and tumorous tissue, it<br />
appears that 3D spectroscopy was an appropriate tool for<br />
the discovery <strong>of</strong> primary tumors <strong>in</strong> the prostate.<br />
Compared to a standard T2 weighted exam<strong>in</strong>ation, a<br />
comb<strong>in</strong>ation <strong>of</strong> 3D spectroscopy and the pathology clearly<br />
improved the accuracy <strong>of</strong> the <strong>in</strong>terpretation <strong>in</strong> 6 out <strong>of</strong> 12<br />
cases (50%). Scheidler et al. (4) was also <strong>in</strong>creased the<br />
MRSI sensitivity and specificity for tumor identification by<br />
comb<strong>in</strong><strong>in</strong>g these techniques, as opposed to us<strong>in</strong>g a s<strong>in</strong>gle<br />
imag<strong>in</strong>g technique.<br />
Kurhanewicz et al. <strong>in</strong>creased the target accuracy with the<br />
confirmation <strong>of</strong> the tumor volume and location us<strong>in</strong>g<br />
spectroscopy (4). The tumor volume could also provide<br />
<strong>in</strong>formation regard<strong>in</strong>g the extent <strong>of</strong> the tumor beyond the<br />
capsule. S<strong>in</strong>ce the MRSI aids <strong>in</strong> differentiat<strong>in</strong>g <strong>of</strong> the stag<strong>in</strong>g<br />
692<br />
ANTICANCER RESEARCH 27: 687-694 (2007)<br />
<strong>of</strong> the tumor between T2 and T3 (5). Differentiation <strong>in</strong> the<br />
central zone <strong>of</strong> the BHP <strong>of</strong> a prostate carc<strong>in</strong>oma can become<br />
mean<strong>in</strong>gful with spectroscopy as a tumor can easily be<br />
<strong>in</strong>terpreted as a BHP if only the s<strong>in</strong>gle imag<strong>in</strong>g technique is<br />
used (13). Therefore, the spectroscopy study can help to<br />
more accurately make the differentiation between tumor and<br />
BHP. MR spectroscopy can also provide helpful diagnostic<br />
<strong>in</strong>formation <strong>in</strong> def<strong>in</strong><strong>in</strong>g the location <strong>of</strong> tumors <strong>in</strong> patients<br />
with excessive bleed<strong>in</strong>g follow<strong>in</strong>g biopsy procedures (14).<br />
However, 3 cases (12.25%) showed no correlation<br />
between the tumor location by spectroscopy and the<br />
pathology, lead<strong>in</strong>g to a false positive result (Figure 3a-c).<br />
Jung et al. (9) demonstrated that the specificity <strong>of</strong> 69.2%<br />
(207 out <strong>of</strong> 299 voxels) to 89.3% (267 out <strong>of</strong> 299 voxels) as<br />
malignant or benign depended upon the exam<strong>in</strong>er as well as<br />
the group<strong>in</strong>g criteria. This group also reported false positive<br />
<strong>in</strong>dications (92 <strong>in</strong> 32 out <strong>of</strong> 299 voxels).<br />
Stanka et al. (13) only confirmed tumor size with both the<br />
images and histology <strong>in</strong> only 6 out <strong>of</strong> 18 cases, <strong>in</strong> which the<br />
size was lower than the actual size <strong>in</strong> three cases and where<br />
the size was greater than the actual size <strong>in</strong> n<strong>in</strong>e. In the<br />
metabolite map, 7 out <strong>of</strong> 18 cases were correctly estimated<br />
while <strong>in</strong> 8 cases the size were overestimated. Despite the<br />
fact that the imag<strong>in</strong>g was improved, there were false positive<br />
results regard<strong>in</strong>g the overestimation <strong>of</strong> tumor size.<br />
<strong>Spectroscopy</strong> should not be used alone to determ<strong>in</strong>e tumor<br />
size s<strong>in</strong>ce false positive results can also be obta<strong>in</strong>ed due to<br />
the <strong>in</strong>accuracy <strong>of</strong> the measurement or a large hyperplastic<br />
nodule <strong>in</strong> the <strong>in</strong>ner gland. (Kurhanewicz et al. (12): small<br />
overlaps <strong>of</strong> the cho+cr/cit-ratio <strong>of</strong> normal tissue <strong>of</strong> the<br />
peripheral zone and BHP).<br />
Our calculations ignored s<strong>in</strong>gle voxels with <strong>in</strong>creased<br />
cho+cr/cit-ratio and only regions conta<strong>in</strong><strong>in</strong>g 2 or more voxels<br />
suspected as pathological were considered. Therefore, small<br />
tumours which could <strong>in</strong>fluence the spectrum <strong>of</strong> s<strong>in</strong>gle voxels<br />
were not identified by spectroscopy.<br />
<strong>Spectroscopy</strong> <strong>in</strong> comb<strong>in</strong>ation with <strong>MRI</strong> appears to be an<br />
appropriate method for determ<strong>in</strong><strong>in</strong>g the location and<br />
diagnosis <strong>of</strong> prostate carc<strong>in</strong>oma. Based on our exam<strong>in</strong>ations,<br />
we do not recommend the use <strong>of</strong> spectroscopy alone as the<br />
primary tool for the recognition <strong>of</strong> prostate carc<strong>in</strong>omas.<br />
References<br />
1 Muller-Lisse UL and H<strong>of</strong>stetter A: Urological diagnosis <strong>of</strong><br />
prostate carc<strong>in</strong>oma. Radiologe 43(6): 432-440, 2003.<br />
2 Heuck A, Scheidler J, Sommer B, Graser A, Muller-Lisse UG,<br />
Massmann J: MR imag<strong>in</strong>g <strong>of</strong> prostate cancer. Radiologe 43(6):<br />
464-473, 2003.<br />
3 Padhani AR, MacVicar AD, Gap<strong>in</strong>ski CJ, Dearnaley DP,<br />
Parker GJ, Suckl<strong>in</strong>g J, Leach MO and Husband JE: Effects <strong>of</strong><br />
androgen deprivation on prostatic morphology and vascular<br />
permeability evaluated with MR imag<strong>in</strong>g. Radiology 218(2):<br />
365-374, 2001.
4 Scheidler J, Hricak H, Vigneron DB, Yu KK, Sokolov DL, Huang<br />
LR, Zaloudek CJ, Nelson SJ, Carroll PR and Kurhanewicz J:<br />
<strong>Prostate</strong> cancer: localization with three-dimensional proton MR<br />
spectroscopic imag<strong>in</strong>g–cl<strong>in</strong>icopathologic study. Radiology 213(2):<br />
473-480, 1999.<br />
5 Yu KK, Vigneron DB, Zaloudek CJ, Males RG, Nelson SJ,<br />
Carroll PR and Kurhanewicz J: <strong>Prostate</strong> cancer: prediction <strong>of</strong><br />
extracapsular extension with endorectal MR imag<strong>in</strong>g and threedimensional<br />
proton MR spectroscopic imag<strong>in</strong>g. Radiology<br />
213(2): 481-488, 1999.<br />
6 Salibi N and Brown MA (eds): Cl<strong>in</strong>ical MR spectroscopy.<br />
Chapter 2. Wiley-Liss, 1998.<br />
7 Pegios W, Bentas W, Wittmann L, Mack MG, Zangos S,<br />
Sollner O, B<strong>in</strong>der J, Fellbaum C, Jonas D and Vogl TJ: <strong>MRI</strong><br />
stag<strong>in</strong>g <strong>of</strong> prostate cancer with the comb<strong>in</strong>ed endorectal body<br />
phased-array coil and histologic correlation R<strong>of</strong>o 175(12): 1660-<br />
1666, 2003.<br />
8 Comet-Batlle J, Vilanova-Busquets JC, Saladie-Roig JM,<br />
Gelabert-Mas A and Barcelo-Vidal C: The value <strong>of</strong> endorectal<br />
<strong>MRI</strong> <strong>in</strong> the early diagnosis <strong>of</strong> prostate cancer. Eur Urol 44(2):<br />
201-208, 2003.<br />
9 Jung JA, Coakley FV, Vigneron DB, Swanson MG, Qayyum A,<br />
We<strong>in</strong>berg V, Jones KD, Carroll PR and Kurhanewicz J:<br />
<strong>Prostate</strong> depiction at endorectal MR spectroscopic imag<strong>in</strong>g:<br />
<strong>in</strong>vestigation <strong>of</strong> a standardized evaluation system. Radiology<br />
233(3): 701-708, 2004.<br />
10 Mueller-Lisse UG, Swanson MG, Vigneron DB, Hricak H,<br />
Bessette A, Males RG, Wood PJ, Noworolski S, Nelson SJ,<br />
Barken I, Carroll PR and Kurhanewicz J: Time-dependent<br />
effects <strong>of</strong> hormone-deprivation therapy on prostate metabolism<br />
as detected by comb<strong>in</strong>ed magnetic resonance imag<strong>in</strong>g and 3D<br />
magnetic resonance spectroscopic imag<strong>in</strong>g. Magn Reson Med<br />
46(1): 49-57, 2001.<br />
Goeb et al: <strong>MRI</strong> <strong>Spectroscopy</strong> <strong>in</strong> <strong>Prostate</strong> <strong>Cancer</strong><br />
11 Kaji Y, Wada A, Imaoka I, Matsuo M, Terachi T, Kobashi Y,<br />
Sugimura K, Fujii M, Maruyama K and Takizawa O: Proton<br />
two-dimensional chemical shift imag<strong>in</strong>g for evaluation <strong>of</strong><br />
prostate cancer: external surface coil vs. endorectal surface coil.<br />
J Magn Reson Imag<strong>in</strong>g 16(6): 697-706, 2002.<br />
12 Kurhanewicz J, Vigneron DB, Hricak H, Narayan P, Carroll P<br />
and Nelson SJ: Three-dimensional H-1 MR spectroscopic<br />
imag<strong>in</strong>g <strong>of</strong> the <strong>in</strong> situ human prostate with high (0.24-0.7-cm 3 )<br />
spatial resolution. Radiology 198(3): 795-805, 1996.<br />
13 Stanka M, Eltze E, Semjonow A, Sievert KD, Maier A and<br />
Pfleiderer B: Spectroscopic imag<strong>in</strong>g (1H-2D-CSI) <strong>of</strong> the<br />
prostate: sequence optimization and correlation with<br />
histopathological results R<strong>of</strong>o 172(7): 623-629, 2000.<br />
14 Kaji Y, Kurhanewicz J, Hricak H, Sokolov DL, Huang LR,<br />
Nelson SJ and Vigneron DB: Localiz<strong>in</strong>g prostate cancer <strong>in</strong> the<br />
presence <strong>of</strong> postbiopsy changes on MR images: role <strong>of</strong> proton<br />
MR spectroscopic imag<strong>in</strong>g. Radiology 206(3): 785-790, 1998.<br />
Received October 20, 2006<br />
Accepted December 7, 2006<br />
693


