The 21cm Signal
The 21cm Signal
The 21cm Signal
You also want an ePaper? Increase the reach of your titles
YUMPU automatically turns print PDFs into web optimized ePapers that Google loves.
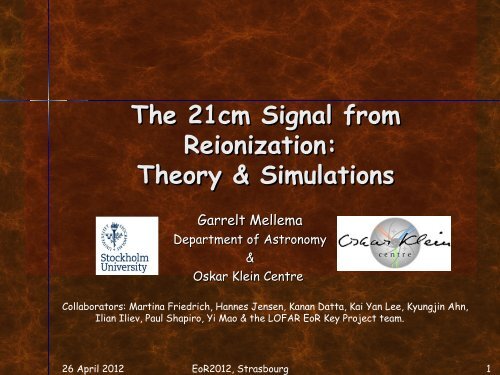
<strong>The</strong> <strong>21cm</strong> <strong>Signal</strong> from<br />
Reionization:<br />
<strong>The</strong>ory & Simulations<br />
Garrelt Mellema<br />
Department of Astronomy<br />
&<br />
Oskar Klein Centre<br />
Collaborators: Martina Friedrich, Hannes Jensen, Kanan Datta, Kai Yan Lee, Kyungjin Ahn,<br />
Ilian Iliev, Paul Shapiro, Yi Mao & the LOFAR EoR Key Project team.<br />
26 April 2012 EoR2012, Strasbourg 1
Contents<br />
<strong>The</strong> <strong>21cm</strong> signal<br />
<strong>21cm</strong> tomography<br />
Statistical analysis methods<br />
Example of telling scenarios apart<br />
26 April 2012 EoR2012, Strasbourg 2
<strong>The</strong> <strong>21cm</strong> <strong>Signal</strong><br />
A forbidden hyperfine transition between the two 1 2s1/2 1/2 ground<br />
level states of neutral hydrogen. Energy difference: λ=<strong>21cm</strong>, =<strong>21cm</strong>,<br />
ν=1.4GHz. 1.4GHz.<br />
IGM during the EoR has as measurable signal, differential<br />
brightness temperature,<br />
temperature,<br />
δTb )<br />
Astrophysical quantities:<br />
– n(HI) : neutral hydrogen density = x(HI)n(H)<br />
– Ts: : spin or excitation temperature<br />
– V ||: || : line of sight velocity<br />
26 April 2012 EoR2012, Strasbourg 3
<strong>The</strong> <strong>21cm</strong> <strong>Signal</strong><br />
Scaled with WMAP7 cosmological parameters:<br />
Mean signal is weak (for T s » T CMB ) :<br />
– 22 – 33 mK between z=6 – 15 (200 – 90 MHz).<br />
Spatial fluctuations due to fluctuations in<br />
– x(HI) δ T<br />
Ts s V ||<br />
26 April 2012 EoR2012, Strasbourg 4
Spin Temperature<br />
Populations of the triplet and singlet states of HI follow<br />
Boltzmann distribution, with an excitation temperature,<br />
temperature,<br />
a.k.a. the spin temperature.<br />
n1/n /n0 0 = 3 exp(0.068 K / T s). ).<br />
Processes affecting spin temperature:<br />
– Collisions (T s → T k )<br />
– Radiative<br />
CMB photons (T s<br />
s → T<br />
TCMB CMB )<br />
Ly-αphotons Ly- photons (T s → TLy-α≈<br />
T k) ) (”Wouthuysen-Field effect”)<br />
T Ly-<br />
IGM @ EoR: competition between CMB and Ly-αphotons.<br />
Ly- photons.<br />
26 April 2012 EoR2012, Strasbourg 5
Spin Temperature Regions<br />
in the IGM<br />
Depending on T k and<br />
local Ly-αflux: Ly- flux:<br />
different regions of<br />
<strong>21cm</strong> signals in IGM<br />
(for z 0 δT b < 0<br />
No Ly-α<br />
present<br />
CMB, , and Ly-α Ly- present: δTb > 0<br />
– In this case: δTb independent of T s .<br />
Cosmic Dawn: T IGM
Dark<br />
Ages<br />
Cosmic<br />
Dawn<br />
EoR<br />
History of Temperatures<br />
∝<br />
(1+z)<br />
TCMB CMB<br />
-1<br />
(1+z)<br />
-2<br />
Tkin,IGM kin,IGM ∝<br />
(1+z) -2 (1+z)<br />
z >90: collisions couple T s to T IGM<br />
(< T CMB for z
425/h Mpc<br />
simulation<br />
δT b ∝ x HI δ<br />
<strong>The</strong> Redshifted <strong>21cm</strong> Sky<br />
Just as the CMB, the redshifted <strong>21cm</strong> signal fills the sky<br />
with a fluctuating signal.<br />
– Gas density of the IGM (δ) (<br />
Count total number of<br />
– Appearance of ionized regions (x HI ) ionizing photons!<br />
– Excitation variations (T s )<br />
δT b<br />
3’ beam<br />
26 April 2012 EoR2012, Strasbourg 8<br />
Iliev, GM, et al (2012)
<strong>The</strong> Redshifted <strong>21cm</strong> Volume<br />
Unlike the CMB, <strong>21cm</strong> signal is<br />
line line emission: carries spatial,<br />
temporal, and velocity<br />
information.<br />
Frequency Redshift<br />
<strong>The</strong> image cube: images<br />
stacked in frequency space<br />
26 April 2012 EoR2012, Strasbourg 9<br />
z<br />
ν<br />
time θ<br />
425/h Mpc simulation<br />
θ
Flying through Time and Space<br />
Reionization has a<br />
complex geometry of<br />
growing and<br />
overlapping bubbles.<br />
Here illustrated<br />
evolving redshifted<br />
<strong>21cm</strong> signal:<br />
– High density neutral<br />
regions are yellow<br />
– Ionized regions are<br />
blue/black blue black.<br />
LOFAR-like beam: 3’<br />
resolution & average<br />
signal is zero.<br />
425/h Mpc simulation<br />
26 April 2012 EoR2012, Strasbourg 10
Tomography<br />
Analysis of 3D data is called tomography.<br />
tomography<br />
Examples of tomographic methods:<br />
– Bubble size distributions (Zahn et al. 2007; Friedrich et al. 2011)<br />
– Topological measures, e.g. Euler characteristic (Gleser et al. 2006;<br />
Shin et al. 2008; Friedrich et al. 2011).<br />
26 April 2012 EoR2012, Strasbourg 11<br />
Euler characterisitic<br />
Friedrich, GM et al. (2011)
Imaging for First<br />
Generation Experiments<br />
Sensitivity of the upcoming EoR experiments will be too<br />
low to image <strong>21cm</strong> from reionization pixel by pixel: S/N ~<br />
0.2.<br />
Ways around:<br />
End of reionization: reionization:<br />
Low resolution imaging<br />
(resolution > 20’) of large neutral patches (Zaroubi et al.<br />
2012)<br />
Middle of reionization: reionization:<br />
Matched filter searches for<br />
isolated large “bubbles” (Datta et al. 2007, 2008, 2009,<br />
Friedrich et al. 2012)<br />
26 April 2012 EoR2012, Strasbourg 12
Matched Filter Searches<br />
Friedrich, Datta, GM et al.<br />
(2012)<br />
Introduce bright QSO to<br />
a ’stellar’ reionization<br />
simulation.<br />
NEW version of C 2-Ray -Ray<br />
(helium + power law<br />
sources).<br />
Region A (QSO) and B<br />
(cluster) are both<br />
detectable with spherical<br />
matched filter on<br />
visibilities (1200 h of<br />
LOFAR observations).<br />
No QSO QSO<br />
Filter size<br />
26 April 2012 EoR2012, Strasbourg 13
Statistical Measurements<br />
Alternative & complement for imaging: Statistical<br />
measurements.<br />
– First goal: goal:<br />
to reliably detect signatures from reionization.<br />
– Second goal: goal:<br />
to interpret them in terms of astrophysics.<br />
<strong>The</strong> <strong>21cm</strong> line signal is rich in properties:<br />
properties<br />
1. Global signals: signals:<br />
fluctuations.<br />
2. Angular properties: properties:<br />
power spectra<br />
3. Frequency properties: properties:<br />
cross-correlation (ν ( 1, , ν2 )<br />
4. Non-Gaussianity: Non-Gaussianity:<br />
skewness, kurtosis<br />
5. Redshift space effects: effects:<br />
distortions, light cone effect<br />
26 April 2012 EoR2012, Strasbourg 14
Global <strong>Signal</strong>s<br />
A single dish telescope<br />
(EDGES): measure the<br />
global signal as function<br />
of frequency.<br />
An interferometer<br />
(LOFAR, MWA, GMRT):<br />
measures the <strong>21cm</strong> (rms)<br />
fluctuations.<br />
fluctuations<br />
Peak of fluctuations:<br />
xHII~0.6-0.7 HII~0.6-0.7<br />
(3’ resolution).<br />
425/h Mpc simulation<br />
3’, 0.5 MHz resolution<br />
26 April 2012 EoR2012, Strasbourg 15
Global <strong>Signal</strong>s<br />
A single dish telescope<br />
(EDGES): measure the<br />
global signal as function<br />
of frequency.<br />
An interferometer<br />
(LOFAR, MWA, GMRT):<br />
measures the <strong>21cm</strong> (rms)<br />
fluctuations.<br />
fluctuations<br />
Peak of fluctuations:<br />
xHII~0.6-0.7 HII~0.6-0.7<br />
(3’ resolution).<br />
425/h Mpc simulation<br />
3’, 0.5 MHz resolution<br />
26 April 2012 EoR2012, Strasbourg 16
Power Spectra<br />
Information about the size<br />
scales can be obtained<br />
from the power spectra.<br />
Simulations show evolution:<br />
– power shifting to larger<br />
scales.<br />
– flattening of the power<br />
spectra.<br />
– drop for < 0.06 h/Mpc<br />
(120/h cMpc).<br />
Different models agree on<br />
general evolution (see e.g.<br />
Lidz et al. 2007).<br />
3D Power Spectra<br />
425/h Mpc simulation<br />
26 April 2012 EoR2012, Strasbourg 17
Correlation Distance<br />
Correlation distance: distance:<br />
Δνwhere Δνwhere<br />
Corr(ν, Corr( , ν+Δν Δν) ) falls<br />
below threshold.<br />
Evolution during reionization:<br />
increases from ~200 kHz to<br />
~1 MHz (3’ resolution):<br />
formation of larger HII<br />
regions<br />
Foregrounds correlated over<br />
the entire frequency range!<br />
114/h Mpc simulation<br />
3’ resolution<br />
26 April 2012 EoR2012, Strasbourg 18
Correlation Distance:<br />
Dependence of Scale<br />
114/h Mpc<br />
simulation<br />
26 April 2012 EoR2012, Strasbourg 19
Non-Gaussianity<br />
Probability distribution<br />
functions of the <strong>21cm</strong><br />
signal are non-Gaussian,<br />
even when smoothed.<br />
Largest effect at end<br />
of reionization.<br />
Ultimate statistic of<br />
δTb .<br />
Ciardi & Madau (2003),<br />
Mellema et al. (2006), Oh<br />
et al. (2009), Ichikawa et<br />
al. (2010), Gluscevic &<br />
Barkana (2010).<br />
3’, 200 kHz<br />
intrinsic<br />
114/h Mpc<br />
simulation<br />
26 April 2012 EoR2012, Strasbourg 20
Higher Order Statistics<br />
<strong>The</strong> non-gaussianity of the<br />
signal suggests the use of<br />
higher order statistics: statistics<br />
– Skewness<br />
– Kurtosis<br />
– Bi-spectrum<br />
Skewness and kurtosis<br />
useful additional<br />
measurements: Wyithe &<br />
Morales (2007); Harker et al.<br />
(2009, 2010); Chapman et al.<br />
(2012).<br />
Skewness & kurtosis:<br />
characteristic evolution<br />
425/h Mpc simulation<br />
3’, 0.5 MHz resolution<br />
26 April 2012 EoR2012, Strasbourg 21
Higher Order Statistics<br />
<strong>The</strong> non-gaussianity of the<br />
signal suggests the use of<br />
higher order statistics: statistics<br />
– Skewness<br />
– Kurtosis<br />
– Bi-spectrum<br />
Skewness and kurtosis<br />
useful additional<br />
measurements: Wyithe &<br />
Morales (2007); Harker et al.<br />
(2009, 2010); Chapman et al.<br />
(2012).<br />
Skewness & kurtosis:<br />
characteristic evolution<br />
425/h Mpc simulation<br />
3’, 0.5 MHz resolution<br />
26 April 2012 EoR2012, Strasbourg 22
Redshift Space Effects:<br />
1) Distortions<br />
Peculiar velocity field displaces signal from cosmological<br />
redshift.<br />
`Kaiser Kaiser effect´ effect´<br />
or `velocity `velocity<br />
compression´: compression´:<br />
due to infall, infall,<br />
signal concentrates at the high density peaks.<br />
This is clearly seen in the simulations and gives ~30%<br />
increase in fluctuations (and up to a factor of 2).<br />
In linear theory the velocity is an independent measure of<br />
the matter density field δ → Cosmology!<br />
– Bharadhway & Ali (2005)<br />
– Barkana & Loeb (2005)<br />
– Wang & Hu (2006)<br />
– Mao et al. (2012)<br />
26 April 2012 EoR2012, Strasbourg 23
Redshift Space Effects:<br />
2) Light Cone Effect<br />
3D power spectrum from <strong>21cm</strong> observations: one axis is<br />
the LOS axis → Evolving signal.<br />
Limits the band width over which 3D power spectrum can<br />
be extracted.<br />
Barkana & Loeb (2006); Datta, GM, et al. (2011)<br />
26 April 2012 EoR2012, Strasbourg 24
Telling Different Scenarios<br />
Apart<br />
How well can <strong>21cm</strong> observations tell different source<br />
scenarios apart?<br />
Since the amount of escaping ionizing photons depends on<br />
the combination of IMF, f SF and f esc, esc,<br />
<strong>21cm</strong> measurements<br />
alone alone cannot distinguish these.<br />
Can <strong>21cm</strong> measurements tell different source populations<br />
apart?<br />
26 April 2012 EoR2012, Strasbourg 25
Identical Reionization, Different<br />
Sources<br />
h H H H<br />
High and low mass halos<br />
contribute; low mass<br />
halos suppressible<br />
Only high mass halos<br />
contribute.<br />
Iliev, GM et al. (2011)<br />
Only very high mass halos<br />
(> 10 10 M ) contribute.<br />
26 April 2012 EoR2012, Strasbourg 26
<strong>21cm</strong> Fluctuations<br />
Figure shows<br />
integrated<br />
fluctuation signal<br />
(rms noise) at LOFAR<br />
resolution.<br />
Amplitude of<br />
fluctuations clearly<br />
tells the cases apart.<br />
Also : simulations<br />
with worse mass<br />
resolution give very<br />
different results.<br />
26 April 2012 EoR2012, Strasbourg 27<br />
H<br />
H<br />
Iliev, GM et al. (2012)<br />
h H
Conclusions<br />
Redshifted <strong>21cm</strong> measurements (e.g. LOFAR) will shed new<br />
light on reionization and the galaxy population beyond z=6.<br />
Limited tomography possible even with LOFAR.<br />
Rich slew of statistical measurements available.<br />
Some source populations can be told apart by LOFAR.<br />
Be careful with mass resolution in simulations!<br />
26 April 2012 EoR2012, Strasbourg 28
26 April 2012 EoR2012, Strasbourg 29


