Download
Download
Download

Create successful ePaper yourself
Turn your PDF publications into a flip-book with our unique Google optimized e-Paper software.
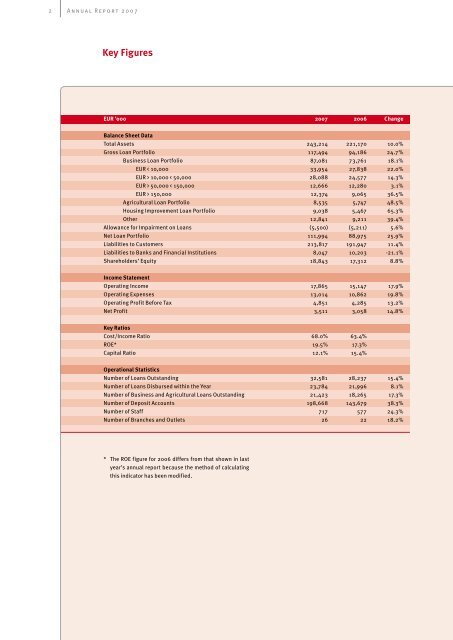
A n n u a l R e p o r t 2 0 0 7<br />
Key Figures<br />
EUR ’000 2007 2006 Change<br />
Balance Sheet Data<br />
Total Assets 243,214 221,170 10.0%<br />
Gross Loan Portfolio 117,494 94,186 24.7%<br />
Business Loan Portfolio 87,081 73,761 18.1%<br />
EUR < 10,000 33,954 27,838 22.0%<br />
EUR > 10,000 < 50,000 28,088 24,577 14.3%<br />
EUR > 50,000 < 150,000 12,666 12,280 3.1%<br />
EUR > 150,000 12,374 9,065 36.5%<br />
Agricultural Loan Portfolio 8,535 5,747 48.5%<br />
Housing Improvement Loan Portfolio 9,038 5,467 65.3%<br />
Other 12,841 9,211 39.4%<br />
Allowance for Impairment on Loans (5,500) (5,211) 5.6%<br />
Net Loan Portfolio 111,994 88,975 25.9%<br />
Liabilities to Customers 213,817 191,947 11.4%<br />
Liabilities to Banks and Financial Institutions 8,047 10,203 -21.1%<br />
Shareholders’ Equity 18,843 17,312 8.8%<br />
Income Statement<br />
Operating Income 17,865 15,147 17.9%<br />
Operating Expenses 13,014 10,862 19.8%<br />
Operating Profit Before Tax 4,851 4,285 13.2%<br />
Net Profit 3,511 3,058 14.8%<br />
Key Ratios<br />
Cost/Income Ratio 68.0% 63.4%<br />
ROE* 19.5% 17.3%<br />
Capital Ratio 12.1% 15.4%<br />
Operational Statistics<br />
Number of Loans Outstanding 32,581 28,237 15.4%<br />
Number of Loans Disbursed within the Year 23,784 21,996 8.1%<br />
Number of Business and Agricultural Loans Outstanding 21,423 18,265 17.3%<br />
Number of Deposit Accounts 198,668 143,679 38.3%<br />
Number of Staff 717 577 24.3%<br />
Number of Branches and Outlets 26 22 18.2%<br />
* The ROE figure for 2006 differs from that shown in last<br />
year’s annual report because the method of calculating<br />
this indicator has been modified.