STK - CCRMA - Stanford University
STK - CCRMA - Stanford University
STK - CCRMA - Stanford University

You also want an ePaper? Increase the reach of your titles
YUMPU automatically turns print PDFs into web optimized ePapers that Google loves.
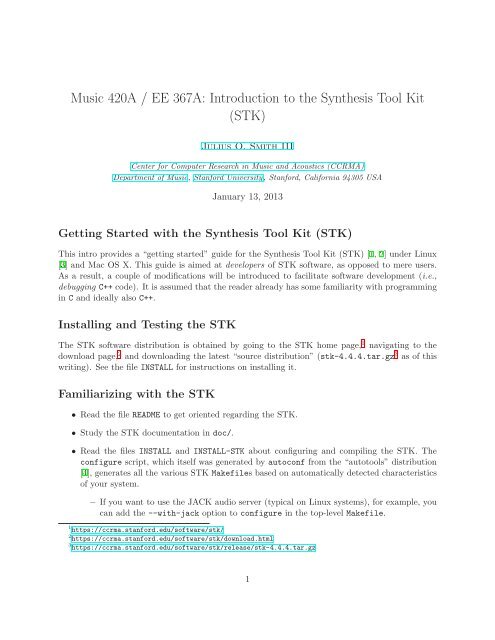
Music 420A / EE 367A: Introduction to the Synthesis Tool Kit<br />
(<strong>STK</strong>)<br />
Julius O. Smith III<br />
Center for Computer Research in Music and Acoustics (<strong>CCRMA</strong>)<br />
Department of Music, <strong>Stanford</strong> <strong>University</strong>, <strong>Stanford</strong>, California 94305 USA<br />
January 13, 2013<br />
Getting Started with the Synthesis Tool Kit (<strong>STK</strong>)<br />
This intro provides a “getting started” guide for the Synthesis Tool Kit (<strong>STK</strong>) [1, 2] under Linux<br />
[3] and Mac OS X. This guide is aimed at developers of <strong>STK</strong> software, as opposed to mere users.<br />
As a result, a couple of modifications will be introduced to facilitate software development (i.e.,<br />
debugging C++ code). It is assumed that the reader already has some familiarity with programming<br />
in C and ideally also C++.<br />
Installing and Testing the <strong>STK</strong><br />
The <strong>STK</strong> software distribution is obtained by going to the <strong>STK</strong> home page, 1 navigating to the<br />
download page, 2 and downloading the latest “source distribution” (stk-4.4.4.tar.gz 3 as of this<br />
writing). See the file INSTALL for instructions on installing it.<br />
Familiarizing with the <strong>STK</strong><br />
• Read the file README to get oriented regarding the <strong>STK</strong>.<br />
• Study the <strong>STK</strong> documentation in doc/.<br />
• Read the files INSTALL and INSTALL-<strong>STK</strong> about configuring and compiling the <strong>STK</strong>. The<br />
configure script, which itself was generated by autoconf from the “autotools” distribution<br />
[4], generates all the various <strong>STK</strong> Makefiles based on automatically detected characteristics<br />
of your system.<br />
– If you want to use the JACK audio server (typical on Linux systems), for example, you<br />
can add the --with-jack option to configure in the top-level Makefile.<br />
1 https://ccrma.stanford.edu/software/stk/<br />
2 https://ccrma.stanford.edu/software/stk/download.html<br />
3 https://ccrma.stanford.edu/software/stk/release/stk-4.4.4.tar.gz<br />
1
• A fairly comprehensive <strong>STK</strong> test is to make and run the main demo:<br />
cd projects/demo<br />
make<br />
StkDemo<br />
Be sure to try selecting different instruments in the Instruments pull-down menu.<br />
<strong>STK</strong> Subdirectory Overview<br />
Now cd to top-level <strong>STK</strong> directory and follow along:<br />
• The doc directory contains a copy of the <strong>STK</strong> documentation, including the release notes,<br />
platform-specific README files, and some papers (doc/html/papers/). Other doc, such an<br />
introductory tutorial 4 and C++ class documentation 5 can be browsed online. (The C++ class<br />
documentation was generated from the source files by the doxygen utility.)<br />
• The src directory contains C++ source files for the <strong>STK</strong> library. The library is built by going<br />
to that directory and typing make.<br />
• The include directory contains C++ header files for the <strong>STK</strong> library.<br />
• The rawwaves directory contains “raw” 16-bit soundfiles, i.e., no header of any kind. 6<br />
• The projects directory contains a variety of subdirectories holding programs which exercise<br />
the <strong>STK</strong>:<br />
> ls -F<br />
demo/ effects/ eguitar/ examples/ ragamatic/<br />
– Above, > denotes the shell command prompt (i.e., don’t type it).<br />
– The demo directory contains some demo programs. Below we will go into that directory<br />
and try out a demo.<br />
– The effects directory contains source for the effects program which applies various<br />
digitalaudioeffectstomicrophoneinputinrealtime(muchfun!). SeeREADME-effects.txt<br />
in that directory for more info.<br />
– The eguitar directory contains a basic electric-guitar example.<br />
– The examples directory contains a variety of short programs illustrating various programming<br />
techniques in the <strong>STK</strong>.<br />
– The ragamatic project is a larger demo which plays automatically generated meditative<br />
music on sitar, drones, and tabla. There are sliders for configuring parameters of the<br />
performance and various raga presets.<br />
4 https://ccrma.stanford.edu/software/stk/tutorial.html<br />
5 https://ccrma.stanford.edu/software/stk/classes.html<br />
6 The <strong>STK</strong> has a compile-time macro called RAWWAVE PATH which defaults to “../../rawwaves/”. This works for<br />
programs located in directories such as projects/someproject/ within the top-level <strong>STK</strong> directory. One can set the<br />
rawwaves path at run time with the message Stk::setRawwavePath() sent to the global Stk object; similar messages<br />
set other global variables such as the sampling rate.<br />
2
Overview of <strong>STK</strong> Demos<br />
Avarietyofinterestingdemoscripts(extension.bat)arecontainedinthedemosdirectoryprojects/demo/:<br />
• Drums: Provides Tcl/Tk selection-buttons for the Bass, Snare, LoTom, MidTom, HiTom,<br />
Homer, Hat, Ride, Crash, CowBel, Tamb (tambourine), and Homer (“doh!”) patch presets<br />
• Modal: Has demo-select buttons for the Marimba, Vibraphone, Agogo, Wood1, Reso, Wood2,<br />
Beats, 2fix, and Clump presets<br />
• Shakers: DemostheMaraca, Sekere, WaterDrops, Tambourine, SleighBells, Maraca, Sekere,<br />
Cabasa, Bamboo, Water Drops, Tambourine, Sleigh Bells, Guiro, Sticks, Crunch, Wrench,<br />
Sand Paper, Coke Can, NeXT Mug, Mug & Penny, Mug & Nickle, Mug & Dime, Mug &<br />
Quarter, Mug & Franc, Mug & Peso, Big Rocks, Little Rocks, and Tuned Bamboo patches<br />
• Physical: Includes Clarinet, BlowHole, Saxofony, Flute, Brass, BlowBotl, Bowed, Plucked,<br />
StifKarp, Sitar, and Mandolin patches<br />
• Voice: Includes FMVoice and Formant example patches for singing voice<br />
• Banded: Demos the Bar, Marimba, GlassHarmonica, and PrayerBowl<br />
• StkDemo: This master demo script uses a menu to select patches instead of buttons, and offers<br />
everything listed above.<br />
The demos most closely related to Music 420A are Modal and Physical. Type, for example,<br />
> cd projects/demo<br />
> make<br />
> ./Modal.bat<br />
[Press the NoteOn button - you should hear a Marimba strike.]<br />
[Try out some of the other selections using buttons along the top.]<br />
> ./Physical.bat<br />
[Press NoteOn for a clarinet toot---then NoteOff.]<br />
[During a clarinet NoteOn, try the "Breath Pressure" slider}<br />
<strong>STK</strong> Tutorial Examples<br />
The<strong>STK</strong>documentation(onlineatthe<strong>STK</strong>homepage 7 orinthereleaseitselfatdoc/html/tutorial.html)<br />
includes a series of tutorials 8 providing an overview of some <strong>STK</strong>-specific coding conventions, and<br />
several of the example programs in the projects/examples/ directory are discussed. This is an<br />
excellent time to go read through those tutorial pages.<br />
7 https://ccrma.stanford.edu/software/stk/<br />
8 https://ccrma.stanford.edu/software/stk/tutorial.html<br />
3
Debugging <strong>STK</strong> Programs in gdb<br />
[The remainder of this intro can be omitted on a first reading. However, remember that it’s here<br />
when you are ready to debug an <strong>STK</strong> program by single-stepping in gdb.]<br />
One of the nicest aspects of working with <strong>STK</strong> programs is that all source (C++) is available,<br />
facilitating debugging. Single-stepping someone else’s <strong>STK</strong> program is a good way to learn how it<br />
works. Object oriented software is often hard to read because its functionality is spread out over<br />
many member functions in many class files, some of which may be in separate libraries. Singlestepping<br />
the code in a debugger solves this problem by showing you exactly what code is being<br />
executed and in a natural order, complete with the ability to inspect variables, stack frames, and<br />
even larger data structures such as arrays, structs, and objects.<br />
On Windows platforms, development tools such as Microsoft Visual C++ provide all the debugging<br />
support you need.<br />
On the Mac, the standard IDE (“Integrated Development Environment”) is Xcode.app. In<br />
that environment, C++ source files have extension .mm to distinguish them from purely Objective<br />
C source files (.m).<br />
An IDE commonly used in Linux environments is eclipse. It can handle all kinds of languages<br />
by means of its plugin architecture, and is used extensively for Web programmin (Javascript, Java,<br />
and many others, in addition to C++).<br />
Another IDE of sorts is the powerful text editor (and process manager) Emacs. Emacs (like<br />
other IDEs) can serve as a front end for the standard UNIX-style software development tools such<br />
as make, compilers, linkers, and debuggers such as gdb. Since Emacs is available on all major<br />
platforms, we will use that case below. For an introduction to many of its features, see Travis<br />
Skare’s video intro:<br />
https://docs.google.com/file/d/0B85zuZBDyib8Q0Q2Q0lRSnNsdnM/edit?pli=1<br />
OnUNIXplatforms(includingLinuxandMacOSX,andevenWindowssystemsusingCygwin),<br />
the standard C++ debugger for decades has been gdb. 9<br />
<strong>STK</strong> Debug Configuration<br />
For ease of debugging <strong>STK</strong> software, use the following configure command: 10<br />
configure --enable-debug CPPFLAGS="-g -O0"<br />
The --enable-debug flag turns on some diagnostic printout in the <strong>STK</strong> source. The compiler<br />
flag -g results in symbols and line-numbers being retained in the compiler output .o file (useful for<br />
single-step debugging in gdb), and the -O0 compiler flag turns off optimization—also often needed<br />
for single-stepping at the source level in gdb.<br />
An Example .gdbinit File<br />
Below is an example .gdbinit file used with the simple example <strong>STK</strong> patch (the “acoustic echo<br />
simulator”) described above:<br />
9<br />
For further introductory information regarding compiling, linking, and debugging programs in the UNIX environment,<br />
see http://cslibrary.stanford.edu/107/.<br />
10<br />
At the time of this writing, the <strong>STK</strong>-4.4.4 configure script does not allow overriding CXXFLAGS which would<br />
normally be the flags for the C++ compiler. Overriding CPPFLAGS (normally aimed at the C preprocesor) is a<br />
workaround we can use here.<br />
4
echo set args 2 \n<br />
set args 2<br />
echo dir ../../src \n<br />
dir ../../src<br />
echo b FileWvIn::tick(void) \n<br />
b FileWvIn::tick(void)<br />
The .gdbinit file goes in the same directory as the main program where gdb is started. It<br />
assumes that the library of standard stklib modules is located in ../../src/ (which works if your<br />
main directory is located in or parallel to subdirectories of the <strong>STK</strong> projects folder). A correct<br />
pointer to the <strong>STK</strong> source directory is necessary for viewing source code while single-stepping<br />
standard <strong>STK</strong> modules.<br />
Note that a breakpoint is always set at the tick function of the FileWvIn object. When the<br />
program is run, it will halt just before sound reading begins, after preliminary set-up is finished.<br />
You can also set the breakpoint at main in order to see absolutely everything that happens.<br />
The “echo” commands are not required, but they remind the user that the .gdbinit file is<br />
being executed every time gdb is started in this directory.<br />
Preparing your Program for Debugging<br />
If you have followed the instructions of the preceding intro, you are already prepared for debugging<br />
in gdb, and you can skip to the next section. Otherwise, before using gdb, you need to<br />
(1) compile your program and the <strong>STK</strong> library with symbols using the ‘-g’ compiler switch, and<br />
(2) compile without optimization (no ’-O’, ’-O2’, ’-O3’ options, etc. -O0 explicitly turns it off).<br />
Optimization can cause gdb’s line-number information to become incorrect (when lines of code<br />
are optimized away). Furthermore, intermediate variables are also often optimized away, in which<br />
case you can no longer inspect them while single-stepping.<br />
For example, suppose your Makefile contains the following:<br />
CFLAGS = -O3 -Wall ...<br />
Before running gdb, we need to change this to<br />
CFLAGS = -g -O0 -Wall ...<br />
and recompile by typing “make” in that directory.<br />
Executing gdb from the command line<br />
Suppose the main program is called main. Then in a terminal emulation program (any “shell”), cd<br />
to the working directory containing main and type<br />
gdb main<br />
r<br />
5
Executing gdb from Emacs<br />
Agreatadvantagetousinggdbinemacsisthatitworksthesameonallplatforms(Linux, Windows,<br />
etc.), and it displays the source in a separate emacs buffer window. As you single-step the program,<br />
a pointer shows you which line of source code will be executed next. Many nice new features have<br />
evolved for debugging in Emacs, as illustrated at the video link given near the beginning of this<br />
section.<br />
To start gdb within emacs, say M-x gdb , edit the gdb execution line, if necessary, and<br />
type again. A gdb buffer window is created by emacs, and you will see the (gdb) prompt.<br />
Set a breakpoint (if not already provided by your .gdbinit file), and type r to run the<br />
program. When the program stops, a second emacs buffer window will be created containing the<br />
source code with a pointer “=>” indicating the next line of code to be executed. This is your first<br />
breakpoint.<br />
In the source display window within emacs, a breakpoint can be set for the line containing the<br />
cursor by typing C-x .<br />
Useful commands in gdb<br />
Below is a useful subset of gdb commands, listed roughly in the order they might be needed.<br />
The first column gives the command, with optional characters enclosed in [square brackets]. For<br />
example, the run command can be abbreviated r. The second column gives a short description of<br />
the command. Type help in gdb to obtain more information on each command.<br />
6
[un] Run to next breakpoint or to end<br />
s[tep] Single-step, descending into functions<br />
n[ext] Single-step without descending into functions<br />
fin[ish] Finish current function, loop, etc. (useful!)<br />
c[ontinue] Continue to next breakpoint or end<br />
up Go up one context level on stack (to caller)<br />
do[wn] Go down one level (only possible after up)<br />
p[rint] Print value of variable called <br />
p/x Print value of in hex format<br />
p @ print values starting at <br />
p List all variables starting with <br />
b[reak] Set a breakpoint at function <br />
b :: Set a breakpoint at in <br />
b :: List all members in <br />
h[elp] b Documentation for setting breakpoints<br />
i[nfo] b List breakpoints<br />
i List all info commands<br />
dis[able] 1 Disable breakpoint 1<br />
en[able] 1 Enable breakpoint 1<br />
d[elete] 1 Delete breakpoint 1<br />
d 1 2 Delete breakpoints 1 and 2<br />
d Delete all breakpoints<br />
cond[ition] 1 Stop at breakpoint 1 only if is true<br />
cond 1 Make breakpoint 1 unconditional<br />
comm[ands] 1 Add a list of gdb commands to execute<br />
each time breakpoint 1 is hit<br />
(usually just print )<br />
Dealing with C++ in gdb<br />
To print instance variables of a C++ class in gdb, it is sometimes necessary to include an explicit<br />
object pointer. For example, after setting a breakpoint in the tick method of the class Guitar<br />
and continuing to the breakpoint, gdb prints something like<br />
Breakpoint 2, Guitar::tick (this=0x805cde8) at Guitar.cpp:100<br />
(gdb)<br />
The this variable points to the current instance of the Guitar object. If an instance variable,<br />
say pluckAmp, cannot be found when you try to print it, try instead<br />
(gdb) p this->pluckAmp<br />
$1 = 0.296875<br />
Also, this can be dereferenced to list all instance variables, e.g.,<br />
(gdb) p *this<br />
$2 = { = { = { = {static <strong>STK</strong>_SINT8 = 1,<br />
static <strong>STK</strong>_SINT16 = 2, static <strong>STK</strong>_SINT32 = 8,<br />
static <strong>STK</strong>_FLOAT32 = 16, static <strong>STK</strong>_FLOAT64 = 32,<br />
static srate = 22050, _vptr.Stk = 0x8059020},<br />
7
lastOutput = 0}, delayLine = 0x805ce70, delayLine2 = 0x8064f18,<br />
combDelay = 0x806cfb0, filter = 0x8075040, filter2 = 0x80750f8,<br />
resonator = 0x80751a0, length = 442, loopGain = 0.99999000000000005,<br />
baseLoopGain = 0.995, lastFreq = 2637.0204553029598,<br />
lastLength = 8.36170988194581, detuning = 0.996, pluckAmp = 0.296875,<br />
pluckPos = 0.234567}, soundfile = 0x8075248, dampTime = 8,<br />
waveDone = 0, feedback = 0, noise = 0x8075088,<br />
excitationFilter = 0x8075398,<br />
excitationCoeffs = 0x0}<br />
Suppose we’re interested in filter2 above:<br />
(gdb) p filter2<br />
$3 = (BiQuad *) 0x80750f8<br />
(gdb) p *filter2<br />
$4 = { = { = {static <strong>STK</strong>_SINT8 = 1,<br />
static <strong>STK</strong>_SINT16 = 2, static <strong>STK</strong>_SINT32 = 8,<br />
static <strong>STK</strong>_FLOAT32 = 16, static <strong>STK</strong>_FLOAT64 = 32,<br />
static srate = 22050, _vptr.Stk = 0x80590e0},<br />
gain = 0.60459499999999999, nB = 3, nA = 3,<br />
b = 0x8075140, a = 0x8075120,<br />
outputs = 0x8075180, inputs = 0x8075160}, }<br />
(gdb)<br />
We see that filter2 is an instance of the BiQuad class. Note that the superclass instance variables<br />
areenclosedincurlybrackets(theleafclassinstancevariablesbeginwithgaininthisexample). We<br />
are omitting this here, since doing it once seems to make gdb know about it thereafter. Suppose<br />
we want to see the filter coefficients:<br />
and so on.<br />
(gdb) p filter2->b[0] @ 3<br />
$5 = {1, -1.03, 0.21540000000000001}<br />
(gdb) p filter2->a[0] @ 3<br />
$6 = {1, -1.3337300000000001, 0.446191}<br />
(gdb)<br />
Multithread Backtrace in gdb<br />
Obtain a backtrace on all active threads in an application as follows:<br />
(gdb) thread apply all backtrace<br />
(gdb) # or, equivalently:<br />
(gdb) thr ap al bt<br />
Miscellaneous tricks in gdb under Emacs<br />
• To get back to debugging after a spate of editing, go to the gdb buffer (the one named<br />
*gud-*) and type up followed by down. This restores the source pointer in<br />
the other window.<br />
• Reissuing the M-x gdb command to emacs will go to the pre-existing debugging session, if<br />
any. Therefore, after the program is recompiled, emacs’s gdb buffer must be explicitly killed.<br />
8
• To break when an input signal file is nonzero after a long string of zeros, use a conditional<br />
breakpoint. E.g.,<br />
cond 2 insamp != 0<br />
cont<br />
• When single-stepping, everything on one line is executed by the next command. Thus, for<br />
example, typing n at the line<br />
for ( i=0; i
usr[/local]/lib/ladspa/*.so.<br />
(Plugins of both types are installed via the Planet <strong>CCRMA</strong> distribution.) Most music/audio<br />
applications offer plugin selection via pop-up menus that are automatically generated from listings<br />
of these standard plugin installation directories. In Miller Puckett’s pd, LADSPA plugins may be<br />
loaded using the plugin~ “tilde object” by Jarno Seppänen, and DSSI plugins may be loaded using<br />
dssi~ by Jamie Bullock.<br />
A lot of information about the DSSI and LADSPA plugin APIs can be found in the respective<br />
header files<br />
and<br />
/usr/include/dssi.h<br />
/usr/include/ladspa.h.<br />
Additionally, the RFC in the doc directory of the DSSI “specification & example code repository”<br />
(dssi-0.9.1 as of this writing) provides a good high-level orientation.<br />
The remainder of this section is written specifically about DSSI plugin debugging. However, it<br />
applies with little modification to LADSPA plugins, and to loadable C modules in general. While<br />
it is possible to use C++ in plugins, it seems to be more common to use plain C written in an “object<br />
oriented style”. Therefore, we will postpone consideration of C++ to a later section below.<br />
You will need a simple host application for debugging your plugin. A good choice for this is<br />
ghostess by Sean Bolton. Even if ghostess is already installed on your system, you will want<br />
to download and compile it from source so that you can single-step within it as well as your<br />
dynamically loaded plugin.<br />
Thejack audio server must be running forghostess (as for many other Linux audio programs).<br />
One can use qjackctl to start the jack daemon 13 jackd. Be sure the jack sampling-rate is set to<br />
a value supported by your sound hardware.<br />
Single-Stepping a Plugin in gdb<br />
The first step is to compile your plugin with symbols retained and optimization turned off. For<br />
plugin distributions using configure, it should work to type<br />
configure "CFLAGS=-g -O0 -DDEBUG"<br />
(Note that ‘-O0’ is a hyphen followed by the letter ’O’, followed by the number zero.) This works for<br />
the example programs such as trivial synth.c in the DSSI example code repository. By default,<br />
ghostess is compiled with -g -O2, which is fine for the host. 14<br />
In order for your host program to find your plugin in the current working directory where it is<br />
compiled, the DSSI PATH environment variable needs to be set up containing that directory first in<br />
the search path. Since I use tcsh as my shell, my ~/.tcshrc file contains the line<br />
setenv MODULENAME "${HOME}/projects/dssi/modulename"<br />
setenv DSSI_PATH \<br />
"${MODULENAME}:/usr/local/lib/dssi:/usr/lib/dssi"<br />
13 a daemon is a program that runs in the “background” to provide services to other programs.<br />
14 While optimization level 2 interferes with detailed single-stepping and variable inspection, it does not interfere<br />
with setting breakpoints and general looking around, which is all we need for the host program.<br />
10
Users of the bash shell may add something like the following in their ~/.bashrc file:<br />
MODULENAME="${HOME}/projects/dssi/modulename"<br />
DSSI_PATH="${MODULENAME}:/usr/local/lib/dssi:/usr/lib/dssi"<br />
export MODULENAME DSSI_PATH<br />
Note that ghostess requires all DSSI PATH elements to begin with /, so you must provide a full<br />
absolute path to your working directory. Of course, if you have root privileges on your computer,<br />
you can simply type make install each time you change your plugin, and the host program will<br />
find your .so file in /usr/local/lib/dssi by following the default DSSI search path.<br />
The debugging cycle tends to go like this:<br />
• Say make to compile your module.<br />
• If you are using the default DSSI search path, type, in another window (as root), make<br />
install. 15<br />
• Start gdb on ghostess in the usual way:<br />
M-x gdb <br />
gdb ghostess -debug -1 modulename.so <br />
• Use thedir command to provide paths to any source files not in the current working directory<br />
(typically the ghostess source directory).<br />
• Set a breakpoint somewhere in your module, such as at its instantiate, activate, or run<br />
function. Since the module is not loaded yet, emacs will ask you if you want a pending<br />
breakpoint as follows:<br />
Function "modulename" not defined.<br />
Make breakpoint pending on future shared library load?<br />
Type y and the breakpoint will be installed when the module is loaded.<br />
• run ghostess under gdb.<br />
• Click on the UI button in the small main window for ghostess. This opens a simple editor<br />
window for your plugin that was automatically generated by ghostess based on its port<br />
declarations.<br />
• Click on the Test Note button in the plugin editor window. This issues the equivalent of a<br />
MIDI note-on for your plugin.<br />
• Find and fix all bugs in your plugin!<br />
To streamline the startup, I use a .gdbinit file like the following:<br />
echo dir /l/dssi/ghostess-20050916/src/ \n<br />
dir /l/dssi/ghostess-20050916/src/<br />
echo set args -debug -1 ./modulename.so \n<br />
set args -debug -1 ./modulename.so<br />
15 Some prefer to type su -c "make install", but then you have to give the root password every time.<br />
11
(I maintain a large set of convenient symbolic links in the directory /l on my system.) I also have<br />
a symbolic link g -> /l/u/dssi/.../src/ghostess in the module source directory, so in emacs I<br />
can simply say<br />
M-x gdb <br />
gdb g <br />
to get started.<br />
References<br />
[1] P. Cook and G. Scavone, Synthesis Tool Kit in C++, Version 4,<br />
http://ccrma.stanford.edu/software/stk/, 2010, see also http://ccrma.stanford.edu/~jos/stkintro/.<br />
[2] P. R. Cook, “Synthesis Tool Kit in C++, version 1.0,” in SIGGRAPH Proceedings, Assoc.<br />
Comp. Mach., May 1996.<br />
[3] E. Siever, A. Weber, and S. Figgins (Ed.), Linux in a Nutshell, Fourth Edition, Cambridge:<br />
O’Reilly, 2003.<br />
[4] G. V. Vaughan, B. Elliston, T. Tromey, and I. L. Taylor, GNU Autoconf, Automake, and libtool,<br />
SAMS, 2000.<br />
12