Sonoma-Lake-Napa Fire Plan - Board of Forestry and Fire ...
Sonoma-Lake-Napa Fire Plan - Board of Forestry and Fire ...
Sonoma-Lake-Napa Fire Plan - Board of Forestry and Fire ...

Create successful ePaper yourself
Turn your PDF publications into a flip-book with our unique Google optimized e-Paper software.
<strong>Sonoma</strong>-<strong>Lake</strong>-<strong>Napa</strong> Unit<br />
<strong>Fire</strong> Management <strong>Plan</strong><br />
2005<br />
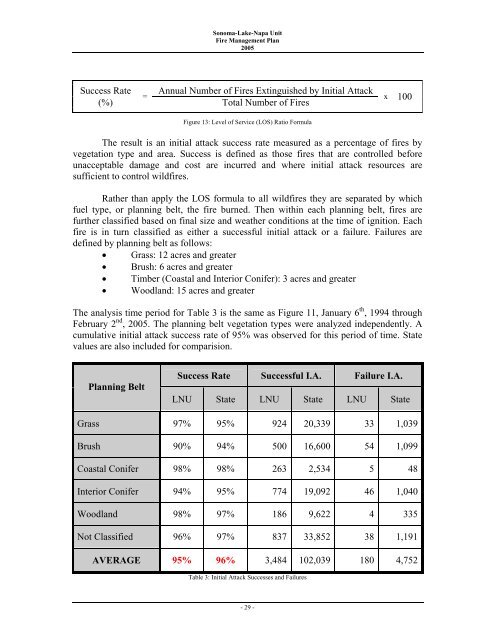
Success Rate Annual Number <strong>of</strong> <strong>Fire</strong>s Extinguished by Initial Attack<br />
=<br />
(%)<br />
Total Number <strong>of</strong> <strong>Fire</strong>s<br />
Figure 13: Level <strong>of</strong> Service (LOS) Ratio Formula<br />
x 100<br />
The result is an initial attack success rate measured as a percentage <strong>of</strong> fires by<br />
vegetation type <strong>and</strong> area. Success is defined as those fires that are controlled before<br />
unacceptable damage <strong>and</strong> cost are incurred <strong>and</strong> where initial attack resources are<br />
sufficient to control wildfires.<br />
Rather than apply the LOS formula to all wildfires they are separated by which<br />
fuel type, or planning belt, the fire burned. Then within each planning belt, fires are<br />
further classified based on final size <strong>and</strong> weather conditions at the time <strong>of</strong> ignition. Each<br />
fire is in turn classified as either a successful initial attack or a failure. Failures are<br />
defined by planning belt as follows:<br />
• Grass: 12 acres <strong>and</strong> greater<br />
• Brush: 6 acres <strong>and</strong> greater<br />
• Timber (Coastal <strong>and</strong> Interior Conifer): 3 acres <strong>and</strong> greater<br />
• Woodl<strong>and</strong>: 15 acres <strong>and</strong> greater<br />
The analysis time period for Table 3 is the same as Figure 11, January 6<br />
etation types were analyzed independently. A<br />
umulative initial a<br />
th , 1994 through<br />
February 2 nd , 2005. The planning belt veg<br />
c ttack success rate <strong>of</strong> 95% was observed for this period <strong>of</strong> time. State<br />
values are also included for comparision.<br />
<strong>Plan</strong>ning Belt<br />
Success Rate Successful I.A. Failure I.A.<br />
LNU State LNU State LNU State<br />
Grass 97% 95% 924 20,339 33 1,039<br />
Brush 90% 94% 500 16,600 54 1,099<br />
Coastal Conifer 98% 98% 263 2,534 5 48<br />
Interior Conifer 94% 95% 774 19,092 46 1,040<br />
Woodl<strong>and</strong> 98% 97% 186 9,622 4 335<br />
Not Classified 96% 97% 837 33,852 38 1,191<br />
AVERAGE 95% 96% 3,484 102,039 180 4,752<br />
Table 3: Initial Attack Successes <strong>and</strong> Failures<br />
- 29 -