Water data analysis: data reduction from beam and ITC info
Water data analysis: data reduction from beam and ITC info
Water data analysis: data reduction from beam and ITC info

You also want an ePaper? Increase the reach of your titles
YUMPU automatically turns print PDFs into web optimized ePapers that Google loves.
Table 4: Time differences of <strong>beam</strong> counters in a 1.5 GeV/c proton <strong>beam</strong>.<br />
Difference Squared theor. resolution Exp. resolution [ps]<br />
TOFA–TDS σ 2 TOFA + σ 2 TDS + σ 2 ∆tTOFA,TDS 268.4<br />
TOFA–TOFB σ 2 TOFA + σ2 TOFB + σ2 ∆tTOFA,TOFB 249.3<br />
TOFB–TDS σ 2 TOFB + σ2 TDS + σ2 ∆tTOFB,TDS 189.1<br />
Table 5 have been measured, which permit the determination of the intrinsic time resolutions<br />
of TOFA, TOFB <strong>and</strong> TDS. Figures 4, 5 <strong>and</strong> 6 show the three analogous time differences for<br />
Table 5: Measured resolutions of the time differences between <strong>beam</strong> counters in a -12 GeV/c<br />
pion <strong>beam</strong>, <strong>and</strong> the resulting individual time resolutions of the <strong>beam</strong> counters.<br />
Resolution [ps] Resolution [ps]<br />
TOFA–TDS 170.9 TOFA 101<br />
TOFA–TOFB 165.0 TOFB 130<br />
TOFB–TDS 189.5 TDS 138<br />
the case of 1.5 GeV/c protons. The whole statistics of the water <strong>data</strong> are shown in these<br />
plots, after adjustments for the jumps in the average <strong>beam</strong> momentum. With the intrinsic<br />
time resolutions of the three <strong>beam</strong> counters given in Table 5, we obtain <strong>from</strong> Eq. 7 a <strong>beam</strong><br />
momentum spread of<br />
∆p<br />
∼ 0.008 .<br />
p<br />
This value is consistent with what is expected <strong>from</strong> the T9 <strong>beam</strong> optics.<br />
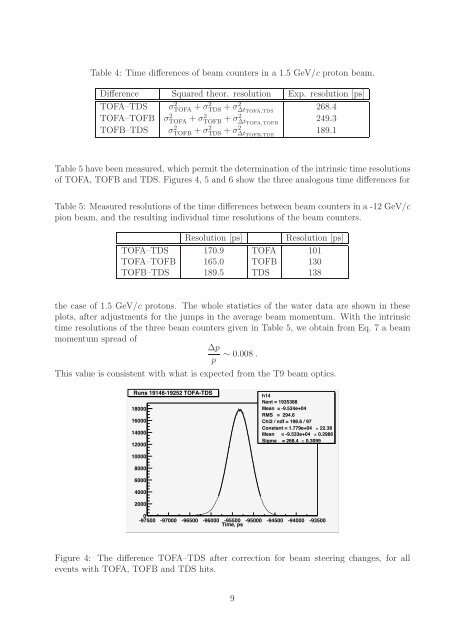
Runs 19146-19252 TOFA-TDS<br />
18000<br />
16000<br />
14000<br />
12000<br />
10000<br />
8000<br />
6000<br />
4000<br />
2000<br />
h14<br />
Nent = 1935388<br />
Mean = -9.534e+04<br />
RMS = 294.6<br />
Chi2 / ndf = 198.6 / 97<br />
Constant = 1.779e+04 ± 22.38<br />
Mean = -9.533e+04 ± 0.2986<br />
Sigma = 268.4 ± 0.3099<br />
0<br />
-97500 -97000 -96500 -96000 -95500 -95000 -94500 -94000 -93500<br />
Time, ps<br />
Figure 4: The difference TOFA–TDS after correction for <strong>beam</strong> steering changes, for all<br />
events with TOFA, TOFB <strong>and</strong> TDS hits.<br />
9