The impact of smoke-free legislation on indoor air quality in bars in ...
The impact of smoke-free legislation on indoor air quality in bars in ...
The impact of smoke-free legislation on indoor air quality in bars in ...

Create successful ePaper yourself
Turn your PDF publications into a flip-book with our unique Google optimized e-Paper software.
3. Impact <strong>on</strong> Particulate Matter2.5<br />
3.1 Introducti<strong>on</strong><br />
In this secti<strong>on</strong> the results <str<strong>on</strong>g>of</str<strong>on</strong>g> the pre- and post <str<strong>on</strong>g>legislati<strong>on</strong></str<strong>on</strong>g> (three m<strong>on</strong>th and 12 m<strong>on</strong>th) PM2.5<br />
measurements are presented. A total <str<strong>on</strong>g>of</str<strong>on</strong>g> 76 <strong>bars</strong> were sampled across four locati<strong>on</strong>s at phase<br />
1 and 2 and a total <str<strong>on</strong>g>of</str<strong>on</strong>g> 59 <strong>bars</strong> sampled at phase 3. Analysis was carried out us<strong>in</strong>g p<strong>air</strong>ed<br />
analysis techniques to exam<strong>in</strong>e differences between the pre-<str<strong>on</strong>g>legislati<strong>on</strong></str<strong>on</strong>g> and three m<strong>on</strong>th post<br />
<str<strong>on</strong>g>legislati<strong>on</strong></str<strong>on</strong>g> stages and aga<strong>in</strong> between the pre <str<strong>on</strong>g>legislati<strong>on</strong></str<strong>on</strong>g> and 12 m<strong>on</strong>th post <str<strong>on</strong>g>legislati<strong>on</strong></str<strong>on</strong>g><br />
stages.<br />
3.2 PM2.5 c<strong>on</strong>centrati<strong>on</strong>s<br />
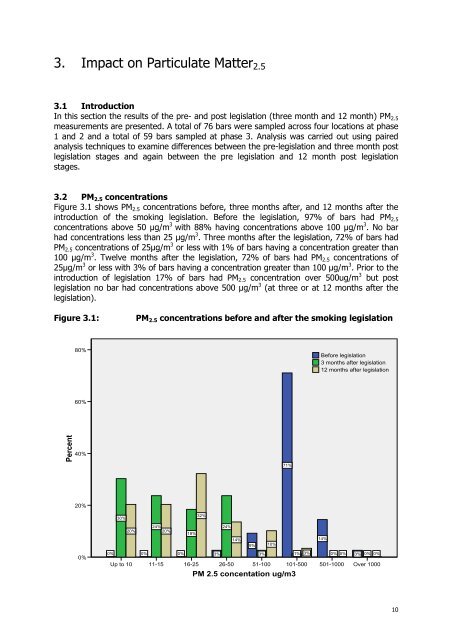
Figure 3.1 shows PM2.5 c<strong>on</strong>centrati<strong>on</strong>s before, three m<strong>on</strong>ths after, and 12 m<strong>on</strong>ths after the<br />
<strong>in</strong>troducti<strong>on</strong> <str<strong>on</strong>g>of</str<strong>on</strong>g> the smok<strong>in</strong>g <str<strong>on</strong>g>legislati<strong>on</strong></str<strong>on</strong>g>. Before the <str<strong>on</strong>g>legislati<strong>on</strong></str<strong>on</strong>g>, 97% <str<strong>on</strong>g>of</str<strong>on</strong>g> <strong>bars</strong> had PM2.5<br />
c<strong>on</strong>centrati<strong>on</strong>s above 50 μg/m 3 with 88% hav<strong>in</strong>g c<strong>on</strong>centrati<strong>on</strong>s above 100 μg/m 3 . No bar<br />
had c<strong>on</strong>centrati<strong>on</strong>s less than 25 μg/m 3 . Three m<strong>on</strong>ths after the <str<strong>on</strong>g>legislati<strong>on</strong></str<strong>on</strong>g>, 72% <str<strong>on</strong>g>of</str<strong>on</strong>g> <strong>bars</strong> had<br />
PM2.5 c<strong>on</strong>centrati<strong>on</strong>s <str<strong>on</strong>g>of</str<strong>on</strong>g> 25μg/m 3 or less with 1% <str<strong>on</strong>g>of</str<strong>on</strong>g> <strong>bars</strong> hav<strong>in</strong>g a c<strong>on</strong>centrati<strong>on</strong> greater than<br />
100 μg/m 3 . Twelve m<strong>on</strong>ths after the <str<strong>on</strong>g>legislati<strong>on</strong></str<strong>on</strong>g>, 72% <str<strong>on</strong>g>of</str<strong>on</strong>g> <strong>bars</strong> had PM2.5 c<strong>on</strong>centrati<strong>on</strong>s <str<strong>on</strong>g>of</str<strong>on</strong>g><br />
25μg/m 3 or less with 3% <str<strong>on</strong>g>of</str<strong>on</strong>g> <strong>bars</strong> hav<strong>in</strong>g a c<strong>on</strong>centrati<strong>on</strong> greater than 100 μg/m 3 . Prior to the<br />
<strong>in</strong>troducti<strong>on</strong> <str<strong>on</strong>g>of</str<strong>on</strong>g> <str<strong>on</strong>g>legislati<strong>on</strong></str<strong>on</strong>g> 17% <str<strong>on</strong>g>of</str<strong>on</strong>g> <strong>bars</strong> had PM2.5 c<strong>on</strong>centrati<strong>on</strong> over 500ug/m 3 but post<br />
<str<strong>on</strong>g>legislati<strong>on</strong></str<strong>on</strong>g> no bar had c<strong>on</strong>centrati<strong>on</strong>s above 500 μg/m 3 (at three or at 12 m<strong>on</strong>ths after the<br />
<str<strong>on</strong>g>legislati<strong>on</strong></str<strong>on</strong>g>).<br />
Figure 3.1: PM2.5 c<strong>on</strong>centrati<strong>on</strong>s before and after the smok<strong>in</strong>g <str<strong>on</strong>g>legislati<strong>on</strong></str<strong>on</strong>g><br />
60%<br />
40%<br />
Percent 80%<br />
20%<br />
0%<br />
0%<br />
30%<br />
20%<br />
Up to 10<br />
0%<br />
24%<br />
20%<br />
11-15<br />
0%<br />
18%<br />
16-25<br />
32%<br />
3%<br />
24%<br />
26-50<br />
14%<br />
9%<br />
3%<br />
51-100<br />
10%<br />
71%<br />
PM 2.5 c<strong>on</strong>centati<strong>on</strong> ug/m3<br />
1%<br />
3%<br />
101-500<br />
Before <str<strong>on</strong>g>legislati<strong>on</strong></str<strong>on</strong>g><br />
3 m<strong>on</strong>ths after <str<strong>on</strong>g>legislati<strong>on</strong></str<strong>on</strong>g><br />
12 m<strong>on</strong>ths after <str<strong>on</strong>g>legislati<strong>on</strong></str<strong>on</strong>g><br />
14%<br />
0% 0%<br />
501-1000<br />
3% 0% 0%<br />
Over 1000<br />
10