The impact of smoke-free legislation on indoor air quality in bars in ...
The impact of smoke-free legislation on indoor air quality in bars in ...
The impact of smoke-free legislation on indoor air quality in bars in ...

Create successful ePaper yourself
Turn your PDF publications into a flip-book with our unique Google optimized e-Paper software.
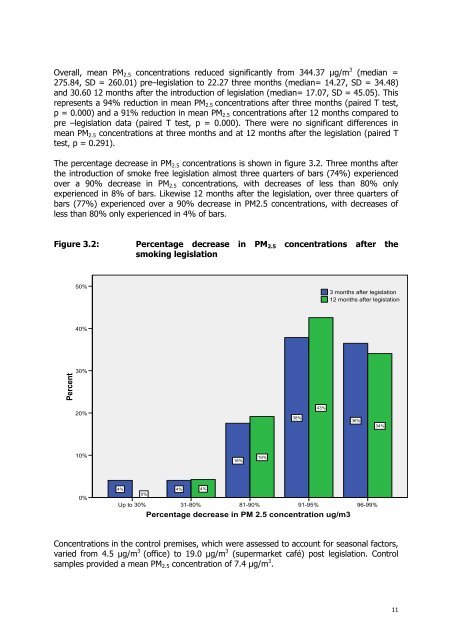
Overall, mean PM2.5 c<strong>on</strong>centrati<strong>on</strong>s reduced significantly from 344.37 μg/m 3 (median =<br />
275.84, SD = 260.01) pre–<str<strong>on</strong>g>legislati<strong>on</strong></str<strong>on</strong>g> to 22.27 three m<strong>on</strong>ths (median= 14.27, SD = 34.48)<br />
and 30.60 12 m<strong>on</strong>ths after the <strong>in</strong>troducti<strong>on</strong> <str<strong>on</strong>g>of</str<strong>on</strong>g> <str<strong>on</strong>g>legislati<strong>on</strong></str<strong>on</strong>g> (median= 17.07, SD = 45.05). This<br />
represents a 94% reducti<strong>on</strong> <strong>in</strong> mean PM2.5 c<strong>on</strong>centrati<strong>on</strong>s after three m<strong>on</strong>ths (p<strong>air</strong>ed T test,<br />
p = 0.000) and a 91% reducti<strong>on</strong> <strong>in</strong> mean PM2.5 c<strong>on</strong>centrati<strong>on</strong>s after 12 m<strong>on</strong>ths compared to<br />
pre –<str<strong>on</strong>g>legislati<strong>on</strong></str<strong>on</strong>g> data (p<strong>air</strong>ed T test, p = 0.000). <str<strong>on</strong>g>The</str<strong>on</strong>g>re were no significant differences <strong>in</strong><br />
mean PM2.5 c<strong>on</strong>centrati<strong>on</strong>s at three m<strong>on</strong>ths and at 12 m<strong>on</strong>ths after the <str<strong>on</strong>g>legislati<strong>on</strong></str<strong>on</strong>g> (p<strong>air</strong>ed T<br />
test, p = 0.291).<br />
<str<strong>on</strong>g>The</str<strong>on</strong>g> percentage decrease <strong>in</strong> PM2.5 c<strong>on</strong>centrati<strong>on</strong>s is shown <strong>in</strong> figure 3.2. Three m<strong>on</strong>ths after<br />
the <strong>in</strong>troducti<strong>on</strong> <str<strong>on</strong>g>of</str<strong>on</strong>g> <str<strong>on</strong>g>smoke</str<strong>on</strong>g> <str<strong>on</strong>g>free</str<strong>on</strong>g> <str<strong>on</strong>g>legislati<strong>on</strong></str<strong>on</strong>g> almost three quarters <str<strong>on</strong>g>of</str<strong>on</strong>g> <strong>bars</strong> (74%) experienced<br />
over a 90% decrease <strong>in</strong> PM2.5 c<strong>on</strong>centrati<strong>on</strong>s, with decreases <str<strong>on</strong>g>of</str<strong>on</strong>g> less than 80% <strong>on</strong>ly<br />
experienced <strong>in</strong> 8% <str<strong>on</strong>g>of</str<strong>on</strong>g> <strong>bars</strong>. Likewise 12 m<strong>on</strong>ths after the <str<strong>on</strong>g>legislati<strong>on</strong></str<strong>on</strong>g>, over three quarters <str<strong>on</strong>g>of</str<strong>on</strong>g><br />
<strong>bars</strong> (77%) experienced over a 90% decrease <strong>in</strong> PM2.5 c<strong>on</strong>centrati<strong>on</strong>s, with decreases <str<strong>on</strong>g>of</str<strong>on</strong>g><br />
less than 80% <strong>on</strong>ly experienced <strong>in</strong> 4% <str<strong>on</strong>g>of</str<strong>on</strong>g> <strong>bars</strong>.<br />
Figure 3.2: Percentage decrease <strong>in</strong> PM2.5 c<strong>on</strong>centrati<strong>on</strong>s after the<br />
smok<strong>in</strong>g <str<strong>on</strong>g>legislati<strong>on</strong></str<strong>on</strong>g><br />
40%<br />
30%<br />
Percent 50%<br />
20%<br />
10%<br />
0%<br />
4%<br />
0%<br />
Up to 30%<br />
4%<br />
31-80%<br />
4%<br />
81-90%<br />
91-95%<br />
Percentage decrease <strong>in</strong> PM 2.5 c<strong>on</strong>centrati<strong>on</strong> ug/m3<br />
96-99%<br />
C<strong>on</strong>centrati<strong>on</strong>s <strong>in</strong> the c<strong>on</strong>trol premises, which were assessed to account for seas<strong>on</strong>al factors,<br />
varied from 4.5 μg/m 3 (<str<strong>on</strong>g>of</str<strong>on</strong>g>fice) to 19.0 μg/m 3 (supermarket café) post <str<strong>on</strong>g>legislati<strong>on</strong></str<strong>on</strong>g>. C<strong>on</strong>trol<br />
samples provided a mean PM2.5 c<strong>on</strong>centrati<strong>on</strong> <str<strong>on</strong>g>of</str<strong>on</strong>g> 7.4 μg/m 3 .<br />
18%<br />
19%<br />
38%<br />
43%<br />
3 m<strong>on</strong>ths after <str<strong>on</strong>g>legislati<strong>on</strong></str<strong>on</strong>g><br />
12 m<strong>on</strong>ths after <str<strong>on</strong>g>legislati<strong>on</strong></str<strong>on</strong>g><br />
36%<br />
34%<br />
11