Investigation of False-Positive Results Given by the QuantiFERON ...
Investigation of False-Positive Results Given by the QuantiFERON ...
Investigation of False-Positive Results Given by the QuantiFERON ...

You also want an ePaper? Increase the reach of your titles
YUMPU automatically turns print PDFs into web optimized ePapers that Google loves.
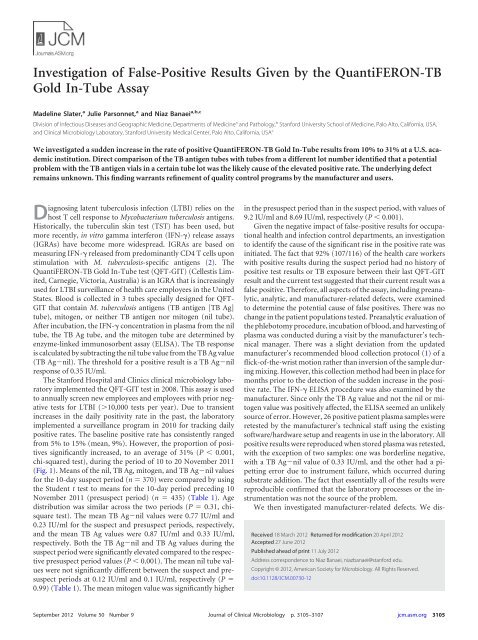
<strong>Investigation</strong> <strong>of</strong> <strong>False</strong>-<strong>Positive</strong> <strong>Results</strong> <strong>Given</strong> <strong>by</strong> <strong>the</strong> <strong>QuantiFERON</strong>-TB<br />
Gold In-Tube Assay<br />
Madeline Slater, a Julie Parsonnet, a and Niaz Banaei a,b,c<br />
Division <strong>of</strong> Infectious Diseases and Geographic Medicine, Departments <strong>of</strong> Medicine a and Pathology, b Stanford University School <strong>of</strong> Medicine, Palo Alto, California, USA,<br />
and Clinical Microbiology Laboratory, Stanford University Medical Center, Palo Alto, California, USA c<br />
We investigated a sudden increase in <strong>the</strong> rate <strong>of</strong> positive <strong>QuantiFERON</strong>-TB Gold In-Tube results from 10% to 31% at a U.S. academic<br />
institution. Direct comparison <strong>of</strong> <strong>the</strong> TB antigen tubes with tubes from a different lot number identified that a potential<br />
problem with <strong>the</strong> TB antigen vials in a certain tube lot was <strong>the</strong> likely cause <strong>of</strong> <strong>the</strong> elevated positive rate. The underlying defect<br />
remains unknown. This finding warrants refinement <strong>of</strong> quality control programs <strong>by</strong> <strong>the</strong> manufacturer and users.<br />
Diagnosing latent tuberculosis infection (LTBI) relies on <strong>the</strong><br />
host T cell response to Mycobacterium tuberculosis antigens.<br />
Historically, <strong>the</strong> tuberculin skin test (TST) has been used, but<br />
more recently, in vitro gamma interferon (IFN-) release assays<br />
(IGRAs) have become more widespread. IGRAs are based on<br />
measuring IFN- released from predominantly CD4 T cells upon<br />
stimulation with M. tuberculosis-specific antigens (2). The<br />
<strong>QuantiFERON</strong>-TB Gold In-Tube test (QFT-GIT) (Cellestis Limited,<br />
Carnegie, Victoria, Australia) is an IGRA that is increasingly<br />
used for LTBI surveillance <strong>of</strong> health care employees in <strong>the</strong> United<br />
States. Blood is collected in 3 tubes specially designed for QFT-<br />
GIT that contain M. tuberculosis antigens (TB antigen [TB Ag]<br />
tube), mitogen, or nei<strong>the</strong>r TB antigen nor mitogen (nil tube).<br />
After incubation, <strong>the</strong> IFN- concentration in plasma from <strong>the</strong> nil<br />
tube, <strong>the</strong> TB Ag tube, and <strong>the</strong> mitogen tube are determined <strong>by</strong><br />
enzyme-linked immunosorbent assay (ELISA). The TB response<br />
is calculated <strong>by</strong> subtracting <strong>the</strong> nil tube value from <strong>the</strong> TB Ag value<br />
(TB Agnil). The threshold for a positive result is a TB Agnil<br />
response <strong>of</strong> 0.35 IU/ml.<br />
The Stanford Hospital and Clinics clinical microbiology laboratory<br />
implemented <strong>the</strong> QFT-GIT test in 2008. This assay is used<br />
to annually screen new employees and employees with prior negative<br />
tests for LTBI (10,000 tests per year). Due to transient<br />
increases in <strong>the</strong> daily positivity rate in <strong>the</strong> past, <strong>the</strong> laboratory<br />
implemented a surveillance program in 2010 for tracking daily<br />
positive rates. The baseline positive rate has consistently ranged<br />
from 5% to 15% (mean, 9%). However, <strong>the</strong> proportion <strong>of</strong> positives<br />
significantly increased, to an average <strong>of</strong> 31% (P 0.001,<br />
chi-squared test), during <strong>the</strong> period <strong>of</strong> 10 to 20 November 2011<br />
(Fig. 1). Means <strong>of</strong> <strong>the</strong> nil, TB Ag, mitogen, and TB Agnil values<br />
for <strong>the</strong> 10-day suspect period (n 370) were compared <strong>by</strong> using<br />
<strong>the</strong> Student t test to means for <strong>the</strong> 10-day period preceding 10<br />
November 2011 (presuspect period) (n 435) (Table 1). Age<br />
distribution was similar across <strong>the</strong> two periods (P 0.31, chisquare<br />
test). The mean TB Agnil values were 0.77 IU/ml and<br />
0.23 IU/ml for <strong>the</strong> suspect and presuspect periods, respectively,<br />
and <strong>the</strong> mean TB Ag values were 0.87 IU/ml and 0.33 IU/ml,<br />
respectively. Both <strong>the</strong> TB Agnil and TB Ag values during <strong>the</strong><br />
suspect period were significantly elevated compared to <strong>the</strong> respective<br />
presuspect period values (P 0.001). The mean nil tube values<br />
were not significantly different between <strong>the</strong> suspect and presuspect<br />
periods at 0.12 IU/ml and 0.1 IU/ml, respectively (P <br />
0.99) (Table 1). The mean mitogen value was significantly higher<br />
in <strong>the</strong> presuspect period than in <strong>the</strong> suspect period, with values <strong>of</strong><br />
9.2 IU/ml and 8.69 IU/ml, respectively (P 0.001).<br />
<strong>Given</strong> <strong>the</strong> negative impact <strong>of</strong> false-positive results for occupational<br />
health and infection control departments, an investigation<br />
to identify <strong>the</strong> cause <strong>of</strong> <strong>the</strong> significant rise in <strong>the</strong> positive rate was<br />
initiated. The fact that 92% (107/116) <strong>of</strong> <strong>the</strong> health care workers<br />
with positive results during <strong>the</strong> suspect period had no history <strong>of</strong><br />
positive test results or TB exposure between <strong>the</strong>ir last QFT-GIT<br />
result and <strong>the</strong> current test suggested that <strong>the</strong>ir current result was a<br />
false positive. Therefore, all aspects <strong>of</strong> <strong>the</strong> assay, including preanalytic,<br />
analytic, and manufacturer-related defects, were examined<br />
to determine <strong>the</strong> potential cause <strong>of</strong> false positives. There was no<br />
change in <strong>the</strong> patient populations tested. Preanalytic evaluation <strong>of</strong><br />
<strong>the</strong> phlebotomy procedure, incubation <strong>of</strong> blood, and harvesting <strong>of</strong><br />
plasma was conducted during a visit <strong>by</strong> <strong>the</strong> manufacturer’s technical<br />
manager. There was a slight deviation from <strong>the</strong> updated<br />
manufacturer’s recommended blood collection protocol (1) <strong>of</strong>a<br />
flick-<strong>of</strong>-<strong>the</strong>-wrist motion ra<strong>the</strong>r than inversion <strong>of</strong> <strong>the</strong> sample during<br />
mixing. However, this collection method had been in place for<br />
months prior to <strong>the</strong> detection <strong>of</strong> <strong>the</strong> sudden increase in <strong>the</strong> positive<br />
rate. The IFN- ELISA procedure was also examined <strong>by</strong> <strong>the</strong><br />
manufacturer. Since only <strong>the</strong> TB Ag value and not <strong>the</strong> nil or mitogen<br />
value was positively affected, <strong>the</strong> ELISA seemed an unlikely<br />
source <strong>of</strong> error. However, 26 positive patient plasma samples were<br />
retested <strong>by</strong> <strong>the</strong> manufacturer’s technical staff using <strong>the</strong> existing<br />
s<strong>of</strong>tware/hardware setup and reagents in use in <strong>the</strong> laboratory. All<br />
positive results were reproduced when stored plasma was retested,<br />
with <strong>the</strong> exception <strong>of</strong> two samples: one was borderline negative,<br />
withaTBAgnil value <strong>of</strong> 0.33 IU/ml, and <strong>the</strong> o<strong>the</strong>r had a pipetting<br />
error due to instrument failure, which occurred during<br />
substrate addition. The fact that essentially all <strong>of</strong> <strong>the</strong> results were<br />
reproducible confirmed that <strong>the</strong> laboratory processes or <strong>the</strong> instrumentation<br />
was not <strong>the</strong> source <strong>of</strong> <strong>the</strong> problem.<br />
We <strong>the</strong>n investigated manufacturer-related defects. We dis-<br />
Received 18 March 2012 Returned for modification 20 April 2012<br />
Accepted 27 June 2012<br />
Published ahead <strong>of</strong> print 11 July 2012<br />
Address correspondence to Niaz Banaei, niazbanaei@stanford edu.<br />
Copyright © 2012, American Society for Microbiology. All Rights Reserved.<br />
doi:10.1128/JCM.00730-12<br />
September 2012 Volume 50 Number 9 Journal <strong>of</strong> Clinical Microbiology p. 3105–3107 jcm.asm.org 3105
Slater et al.<br />
FIG. 1. The QFT-GIT surveillance graph showing daily positive rates. The<br />
histogram displays <strong>the</strong> proportion <strong>of</strong> total QFT-GIT tests that were positive on<br />
each day during November 2011. The arrows indicate <strong>the</strong> date that <strong>the</strong> increase<br />
in positive test rates was noted and <strong>the</strong> date that TB antigen tube lot A11040IT<br />
was switched to a new lot (A11030U2).<br />
covered that all <strong>of</strong> <strong>the</strong> TB Ag tubes giving false results were from a<br />
single lot number (A11040IT) that had been introduced around<br />
<strong>the</strong> time <strong>of</strong> <strong>the</strong> sharp increase in positive test results. We <strong>the</strong>refore<br />
considered <strong>the</strong> possibility that a manufacturing-related defect<br />
could have caused <strong>the</strong> sudden elevation in <strong>the</strong> positive test rate and<br />
switched to a new TB Ag tube lot number (A11030U2) on 21<br />
November 2011. In <strong>the</strong> 10-day period following <strong>the</strong> TB Ag tube<br />
replacement, <strong>the</strong> proportion <strong>of</strong> positives dropped from 31% to<br />
7% (n 705) (Fig. 1). The mean TB Ag values declined from 0.87<br />
IU/ml to 0.26 IU/ml (P 0.001), while <strong>the</strong> nil tube value changed<br />
from 0.12 IU/ml to 0.16 IU/ml (P 0.23). The mean TB Agnil<br />
values were significantly different at 0.77 IU/ml and 0.1 IU/ml for<br />
<strong>the</strong> suspect and postsuspect periods, respectively (P 0.001). To<br />
provide direct evidence <strong>of</strong> <strong>the</strong> TB Ag tubes being <strong>the</strong> source <strong>of</strong> <strong>the</strong><br />
problem, 463 employees presenting to Occupational Health for<br />
annual LTBI screening with QFT-GIT underwent paired testing<br />
with <strong>the</strong> suspect TB Ag tubes (lot A11040IT) and a new lot <strong>of</strong> TB<br />
Ag tubes (lot A11030U2). <strong>Results</strong> clearly demonstrated a significant<br />
difference in <strong>the</strong> positive rate between <strong>the</strong> suspect lot (31%)<br />
and <strong>the</strong> new lot (5%) (P 0.001, McNemar’s test) (Fig. 2). The<br />
mean TB Agnil values were significantly higher in <strong>the</strong> suspect lot<br />
(0.58 IU/ml) than in <strong>the</strong> new lot (0.06 IU/ml; P 0.001). While<br />
32% <strong>of</strong> subjects (n 46) had a borderline-positive result (TB<br />
Agnil value 0.35 but 0.7 IU/ml) with <strong>the</strong> suspect TB antigen<br />
tube, 53% (n 77) had a robust response (TB Agnil value 1<br />
IU/ml) (Fig. 2). Additionally, in a subset <strong>of</strong> <strong>the</strong> employees (n 81)<br />
who underwent retesting after <strong>the</strong> initial false-positive results during<br />
<strong>the</strong> suspect period, 91% tested negative with <strong>the</strong> new lot <strong>of</strong> TB<br />
Ag tubes.<br />
Extensive efforts were undertaken <strong>by</strong> <strong>the</strong> laboratory in collaboration<br />
with <strong>the</strong> manufacturer to discover and remove <strong>the</strong> underlying<br />
cause. The manufacturer conducted an investigation <strong>of</strong> <strong>the</strong><br />
tubes from <strong>the</strong> suspect lot number. No deviations had occurred<br />
during manufacturing <strong>of</strong> tubes, and endotoxin contamination<br />
was ruled out. Their final conclusion was that <strong>the</strong> root cause <strong>of</strong> <strong>the</strong><br />
discrepant results that we observed was not discovered. We also<br />
excluded contamination <strong>of</strong> TB Ag tubes with live culturable organisms.<br />
The FDA was contacted with our findings through our<br />
communication with <strong>the</strong> CDC. The underlying mechanism <strong>of</strong> increased<br />
false-positive results remains unclear at this point.<br />
The elevated QFT-GIT percent positive rate described in this<br />
report caused a resource burden on <strong>the</strong> Occupational Health<br />
Clinic and had an emotional impact on <strong>the</strong> employees. The sequelae<br />
<strong>of</strong> <strong>the</strong> false-positive results highlight <strong>the</strong> need for more<br />
rigorous quality control measures <strong>by</strong> <strong>the</strong> manufacturer to guarantee<br />
batch-to-batch consistency. This could be accomplished <strong>by</strong><br />
parallel testing <strong>of</strong> new lots with old lots with adequate numbers <strong>of</strong><br />
subjects with and without LTBI to ensure proper results. In addition<br />
to <strong>the</strong> manufacturer’s quality control program, we recommend<br />
that each clinical laboratory institute a surveillance system<br />
TABLE 1 QFT-GIT results for <strong>the</strong> periods preceding, during, and following <strong>the</strong> increase in <strong>the</strong> daily positive rate<br />
Parameter Presuspect period a<br />
Suspect period (lot A11040IT)<br />
Postsuspect period<br />
(lot A11030U2) P values (Pre, Post) b<br />
No. <strong>of</strong> tests 435 370 705<br />
Mean nil value (IU/ml) 0.1 0.12 0.16 0.99, 0.23<br />
Mean TB Ag value (IU/ml) 0.33 0.87 0.26 0.001, 0.001<br />
Mean mitogen value (IU/ml) 9.2 8.69 7.9 0.001, 0.001<br />
Mean TB AgNil value (IU/ml) 0.23 0.77 0.1 0.001, 0.001<br />
% positive results 11 31 6.8 0.001, 0.001<br />
a The lot number for <strong>the</strong> presuspect period was not recorded.<br />
b P values are for comparison <strong>of</strong> results from suspect lot to pre- and postsuspect lots using <strong>the</strong> Student t test.<br />
FIG. 2. Within-subject comparison <strong>of</strong> QFT-GIT results with <strong>the</strong> suspect lot<br />
and a new lot <strong>of</strong> TB Ag tubes. The dot plot displays <strong>the</strong> TB Agnil values, in<br />
IU/ml, for <strong>the</strong> QFT-GIT performed with paired blood samples from 463 subjects<br />
using <strong>the</strong> suspect lot (A11040IT) and a new lot (A11030U2) <strong>of</strong> TB Ag<br />
tubes. The cut<strong>of</strong>f for positive results is marked with a dashed line. Each symbol<br />
represents one subject. The mean was significantly higher for <strong>the</strong> suspect lot<br />
(0.58 IU/ml) than for <strong>the</strong> new lot (0.06 IU/ml) <strong>by</strong> paired t test.<br />
3106 jcm.asm.org Journal <strong>of</strong> Clinical Microbiology
to monitor and detect sudden changes in daily or weekly positive<br />
and indeterminate rates. The surveillance system at our institution<br />
was implemented in 2010 in response to a 3-day interval <strong>of</strong> elevated<br />
daily QFT-GIT positivity rate (from 10% to 42%) that resolved<br />
spontaneously without any intervention. Similar spikes<br />
with spontaneous resolutions have since been observed. Although<br />
<strong>the</strong> causes <strong>of</strong> <strong>the</strong>se spikes were not investigated, we now question<br />
whe<strong>the</strong>r <strong>the</strong>se events and <strong>the</strong> current episode are related. The positivity<br />
rates over <strong>the</strong> 2 months prior to <strong>the</strong> described episode were<br />
analyzed, and we recommend a daily positive rate greater than 2<br />
standard deviations above <strong>the</strong> mean lasting longer than 3 days as<br />
<strong>the</strong> threshold prompting investigation. We validated this recommendation<br />
with 2 years <strong>of</strong> QFT-GIT surveillance data. Ano<strong>the</strong>r<br />
benefit <strong>of</strong> a surveillance system is to monitor <strong>the</strong> indeterminate<br />
rate, although it was not affected in <strong>the</strong> current episode. The Veterans<br />
Affairs Palo Alto Health Care System recently reported a<br />
sharp increase in <strong>the</strong> indeterminate rate <strong>of</strong> <strong>the</strong>ir QFT-GIT results,<br />
caused <strong>by</strong> a faulty lot <strong>of</strong> mitogen tubes (3). An ensuing investigation<br />
traced <strong>the</strong> transportation route <strong>of</strong> <strong>the</strong> tubes through <strong>the</strong> Panama<br />
Canal, possibly resulting in heat damage <strong>of</strong> <strong>the</strong> mitogen peptides<br />
and altering results. This investigation highlighted <strong>the</strong> need<br />
for temperature-controlled transport <strong>of</strong> QFT-GIT tubes, which<br />
<strong>False</strong>-<strong>Positive</strong> <strong>QuantiFERON</strong>-TB Gold In-Tube <strong>Results</strong><br />
led to implementation <strong>of</strong> refrigerated transportation <strong>of</strong> tubes <strong>by</strong><br />
<strong>the</strong> manufacturer.<br />
In summary, we identified that a problem with <strong>the</strong> TB antigen<br />
vials in a certain lot was <strong>the</strong> likely cause <strong>of</strong> <strong>the</strong> elevated falsepositive<br />
rate. This finding underscores <strong>the</strong> need for more rigorous<br />
quality control measures <strong>by</strong> <strong>the</strong> manufacturer and implementation<br />
<strong>of</strong> surveillance programs <strong>by</strong> clinical laboratories.<br />
ACKNOWLEDGMENTS<br />
We thank Mary Spangler and Tracy Chang, <strong>the</strong> staff at Stanford University<br />
Hospital Occupational Health Clinic, and <strong>the</strong> Microbiology Laboratory<br />
technologists for <strong>the</strong>ir diligence in conducting <strong>the</strong> investigation.<br />
REFERENCES<br />
1. Cellestis. 2011. <strong>QuantiFERON</strong>-TB Gold package insert. Cellestis Limited,<br />
Carnegie, Victoria, Australia.<br />
2. Pai M, Dheda K, Cunningham J, Scano F, O’Brien R. 2007. T-cell assays<br />
for <strong>the</strong> diagnosis <strong>of</strong> latent tuberculosis infection: moving <strong>the</strong> research<br />
agenda forward. Lancet Infect. Dis. 7:428–438.<br />
3. Pirrotta V, Guerrera L, Cheung G, Thanassi W. 2011. Variability in<br />
QuantiFeron Gold In-Tube mitogen tube performance necessitating quality<br />
control improvement, abstr 579. Abstr. 49th Annu. Infect. Dis. Soc. Am.<br />
Meet.<br />
September 2012 Volume 50 Number 9 jcm.asm.org 3107