sr 60 “twin pairs” - City of Vero Beach
sr 60 “twin pairs” - City of Vero Beach
sr 60 “twin pairs” - City of Vero Beach

Create successful ePaper yourself
Turn your PDF publications into a flip-book with our unique Google optimized e-Paper software.
SR <strong>60</strong> “TWIN PAIRS”<br />
TRAFFIC CALMING FEASIBILITY STUDY<br />
VERO BEACH, FLORIDA<br />
Prepared for:<br />
Indian River County Metropolitan Planning Organization<br />
<strong>City</strong> <strong>of</strong> <strong>Vero</strong> <strong>Beach</strong><br />
Prepared by:<br />
Kimley-Horn and Associates, Inc.<br />
December 2012 (Revised January 2013)
TABLE OF CONTENTS<br />
INTRODUCTION ......................................................................................................................1<br />
CONCEPTUAL PLAN, TYPICAL SECTIONS, AND COST ESTIMATE .............................4<br />
ROADWAY SEGMENT EVALUATION – EXISTING CONDITIONS ...................................8<br />
INTERSECTION EVALUATION – EXISTING CONDITIONS ............................................11<br />
TRAFFIC VOLUME FORECASTS .......................................................................................12<br />
ROADWAY SEGMENT EVALUATION – 2035 CONDITIONS ..........................................15<br />
INTERSECTION EVALUATION - 2035 CONDITIONS ......................................................16<br />
CRASH ANALYSIS ................................................................................................................18<br />
TRANSIT AND NON-MOTORIZED FACILITIES ................................................................21<br />
EVACUATION ........................................................................................................................23<br />
SUMMARY AND NEXT STEPS ............................................................................................25<br />
Appendices<br />
Appendix A: Opinion <strong>of</strong> Probable Cost<br />
Appendix B: Synchro Analysis – Existing Conditions<br />
Appendix C: GTCRPM Model Output<br />
Appendix D: Synchro Analysis – 2035 Conditions<br />
SR <strong>60</strong> “Twin Pairs” Traffic Calming Feasibility Study Page i
Tables<br />
LIST OF TABLES AND FIGURES<br />
Table 1: Historical AADT Data ....................................................................................... 8<br />
Table 2: Existing Conditions Daily Traffic Volumes and Level <strong>of</strong> Service ....................... 9<br />
Table 3: Existing Peak Hour Directional Volumes and Concurrency (Vested) Trips .... 10<br />
Table 4: P.M. Peak Level <strong>of</strong> Service - Existing Conditions ........................................... 11<br />
Table 5: GTCRPM Traffic Volume Forecasts and Growth Rates ................................. 13<br />
Table 6: Traffic Volume Diversion Analysis ................................................................... 14<br />
Table 7: 2035 Roadway Segment Volumes and Level <strong>of</strong> Service ................................ 15<br />
Table 8: P.M. Peak Level <strong>of</strong> Service – 2035 No Build Conditions ................................ 16<br />
Table 9: P.M. Peak Level <strong>of</strong> Service – 2035 Build Conditions ...................................... 17<br />
Table 10: Crashes by Intersection ................................................................................ 18<br />
Table 11: Crashes by Roadway Segment .................................................................... 19<br />
Figures<br />
Figure 1: Study Area Map ............................................................................................... 3<br />
Figure 2: Plan View <strong>of</strong> Conceptual Alternative ................................................................ 5<br />
Figure 3: Typical Section <strong>of</strong> Conceptual Alternative ........................................................ 6<br />
Figure 4: GoLine Transit Routes ................................................................................... 21<br />
SR <strong>60</strong> “Twin Pairs” Traffic Calming Feasibility Study Page ii
INTRODUCTION<br />
The <strong>City</strong> <strong>of</strong> <strong>Vero</strong> <strong>Beach</strong> Vision Plan adopted on February 24, 2005, sets forth a future direction for <strong>Vero</strong><br />
<strong>Beach</strong>. The Vision Plan states “Downtown should be reinforced as a mixed-use <strong>of</strong>fice and governmental<br />
center, as well as a unique cultural, arts, entertainment, and residential enclave, with shopping and dining<br />
opportunities that support the district and its surrounding neighborhoods. Addressing the "twin pair"<br />
arterials that bisect downtown is a key strategy to enhance the pedestrian nature <strong>of</strong> the district.”<br />
Subsequently, the Evaluation and Appraisal Report (2010) also affirmed the need for developing<br />
measures to mitigate the adverse impacts <strong>of</strong> SR <strong>60</strong> “Twin Pairs” on pedestrian-oriented mixed-use<br />
development in Downtown <strong>Vero</strong> <strong>Beach</strong>. On September 20, 2011, the <strong>Vero</strong> <strong>Beach</strong> <strong>City</strong> Council requested<br />
the Indian River County Metropolitan Planning Organization (MPO) to conduct a traffic calming feasibility<br />
study on the SR <strong>60</strong> “Twin Pairs.”<br />
SR <strong>60</strong> is the main east-west arterial in Indian River County. As SR <strong>60</strong> enters Downtown, it splits into two<br />
one-way streets. Eastbound SR <strong>60</strong> consists <strong>of</strong> three lanes and westbound SR <strong>60</strong> consists <strong>of</strong> four lanes.<br />
The eastbound and westbound one-way streets are separated by a city block. SR <strong>60</strong> within Downtown<br />
has undergone transformations over the years to serve varying mobility needs. Before I-95 was<br />
constructed between SR <strong>60</strong> and Palm <strong>Beach</strong> Gardens, SR <strong>60</strong> also supported regional travel by serving<br />
as a connector between I-95 and US 1. The missing segment <strong>of</strong> I-95 between SR <strong>60</strong> and Palm <strong>Beach</strong><br />
Gardens was constructed in several phases between 1978 and 1987. Until the early 1990s, SR <strong>60</strong> within<br />
Downtown consisted <strong>of</strong> a two-way, four-lane segment, which followed the alignment <strong>of</strong> present-day,<br />
westbound one-way portion <strong>of</strong> the bifurcated segment. Thereafter, SR <strong>60</strong> was reconfigured into the<br />
present configuration <strong>of</strong> two one-way streets in anticipation <strong>of</strong> traffic growth. While SR <strong>60</strong> still serves as<br />
the connector between Downtown <strong>Vero</strong> <strong>Beach</strong> and I-95, current traffic volumes show excess capacity<br />
within the one-way segment.<br />
Based on the present configuration and functionality, the SR <strong>60</strong> “Twin Pairs” can be characterized as<br />
more <strong>of</strong> a facilitator <strong>of</strong> through traffic rather than promoting Downtown as a destination. Typical elements<br />
<strong>of</strong> a street through a downtown such as gateway signs, landscaping, on-street parking, and pedestrian<br />
and bicycle friendly features are not present along SR <strong>60</strong>. The posted speed on SR <strong>60</strong> within Downtown<br />
is 40 miles per hour (mph). In order to provide a functional downtown street, the <strong>City</strong> <strong>of</strong> <strong>Vero</strong> <strong>Beach</strong><br />
wishes to examine the feasibility <strong>of</strong> reducing the number <strong>of</strong> through travel lanes on SR <strong>60</strong> between 20 th<br />
Avenue and Florida East Coast (FEC) Railroad.<br />
The Indian River County MPO retained Kimley-Horn and Associates, Inc. to evaluate potential changes to<br />
SR <strong>60</strong> “Twin Pairs” Traffic Calming Feasibility Study Page 1
lane configuration <strong>of</strong> SR <strong>60</strong> between 20 Avenue and the FEC Railroad and potential impacts to level <strong>of</strong><br />
service on SR <strong>60</strong> and other roadways in the vicinity. While the SR <strong>60</strong> “Twin Pairs” extends between 20 th<br />
Avenue and 6 th Avenue, the scope <strong>of</strong> this study is limited to the Downtown segment <strong>of</strong> SR <strong>60</strong>. The<br />
primary considerations <strong>of</strong> the traffic calming feasibility study are listed below.<br />
Provision <strong>of</strong> two through travel lanes for both the eastbound and westbound segments<br />
Placement <strong>of</strong> parallel or angled on-street parking<br />
Provision <strong>of</strong> street furniture, landscaping, and other decorative treatments<br />
Improvement in pedestrian safety by reducing crossing distance and increasing separation<br />
between sidewalks and travel lanes<br />
Reduction in posted speed limit, if appropriate<br />
Accommodation <strong>of</strong> improvements without removal <strong>of</strong> existing curb, except for landscaped islands<br />
This report summarizes the development <strong>of</strong> conceptual plans and typical sections, traffic volume<br />
projections, level <strong>of</strong> service and crash data analysis, multimodal considerations, and stakeholder<br />
coordination to determine the feasibility <strong>of</strong> the lane reduction.<br />
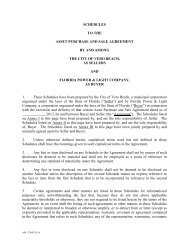
An aerial <strong>of</strong> the overall corridor is provided in Figure 1.<br />
SR <strong>60</strong> “Twin Pairs” Traffic Calming Feasibility Study Page 2
Begin<br />
Project<br />
Figure 1: SR <strong>60</strong> "Twin Pairs" Traffic Calming Feasibility Study<br />
20 Avenue<br />
26 Street<br />
21 Street<br />
SR <strong>60</strong> Westbound<br />
SR <strong>60</strong> Eastbound<br />
19 Street<br />
16 Street<br />
14 Avenue<br />
SR 5/US 1<br />
Old Dixie Highway<br />
FEC Railroad<br />
End<br />
Project<br />
Commerce Avenue<br />
11 Avenue<br />
J
CONCEPTUAL PLAN, TYPICAL SECTIONS, AND COST<br />
ESTIMATE<br />
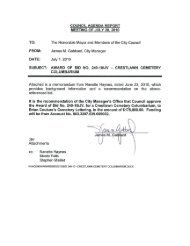
The Kimley-Horn team developed four preliminary conceptual plan alternatives for consideration. After<br />
obtaining input from <strong>City</strong> and MPO staff, the conceptual plan shown in Figure 2 was selected as the<br />
preferred alternative. The proposed concept plan will maintain the existing curb except at 14 th Avenue,<br />
16 th Avenue, and 18 th Avenue, where curb extensions are proposed to reduce pedestrian crossing<br />
distance and provide landscaping. On-street parking is proposed on the north side <strong>of</strong> eastbound SR <strong>60</strong><br />
and both sides <strong>of</strong> westbound SR <strong>60</strong>. Approximately 80 on-street parking spaces are proposed along the<br />
SR <strong>60</strong> “Twin Pairs.” Adequate clearance is maintained at intersections to provide required sight distance.<br />
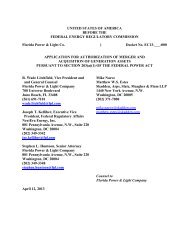
As shown in Figure 3, while the number <strong>of</strong> travel lanes is reduced, the width <strong>of</strong> the remaining through<br />
travel lanes is proposed to be increased from 11 feet to 12 feet. The width <strong>of</strong> the existing bicycle lanes is<br />
proposed to be increased from four feet to five feet. As part <strong>of</strong> the implementation <strong>of</strong> the lane reduction,<br />
reducing the posted speed from 40 mph to 35 mph may be appropriated based on changes to the<br />
roadway environment.<br />
An opinion <strong>of</strong> probable cost (OPC) was developed for the proposed lane reduction. Cost estimates were<br />
developed for the following three alternatives:<br />
Alternative 1 – restriping only (with milling and resurfacing) - $680,000<br />
Alternative 2 – restriping (with milling and resurfacing) and delineate parking spaces with<br />
stamped asphalt - $890,000<br />
Alternative 3 - restriping (with milling and resurfacing), delineate parking spaces with stamped<br />
asphalt, and landscaping knuckles at 14 Avenue, 16 Avenue, and 18 Avenue - $1,090,000<br />
Detailed cost estimates are included in Appendix A.<br />
SR <strong>60</strong> “Twin Pairs” Traffic Calming Feasibility Study Page 4
20 th Avenue<br />
19 th Avenue<br />
19 th Avenue<br />
1835 – Matheson &<br />
Horowitz<br />
18 th Avenue<br />
Flower Box<br />
18 th Avenue<br />
18 th Avenue<br />
17 th Avenue<br />
Margaret Anderson Atty<br />
Bookkeeping/Tax<br />
Services<br />
Island Arbo<br />
Tree Service<br />
17 th Avenue<br />
TC Prosthetic<br />
Pieczynski Dentistry<br />
Clark Atty.<br />
Sullivan & Sullivan<br />
16 th Avenue<br />
16 th Avenue<br />
ABC Schumann Printing<br />
Meadows Atty.<br />
Vacant<br />
Substance Awareness<br />
Action Answering<br />
<strong>Vero</strong> Vineyard church<br />
15 th Avenue<br />
United for Families<br />
15 th Avenue<br />
Nick’s Restaurant<br />
Natalie Holtom<br />
Interiors<br />
Brennan & Kretschmer<br />
Pipe Den<br />
Statewide<br />
Condominium<br />
Insurance (Maher Bldg.)<br />
Hatch<br />
Accounting<br />
IRC Democrats<br />
Non-Lawyer<br />
Solutions<br />
Carla Klein<br />
Insurance<br />
Scott’s<br />
Sporting Goods<br />
Jetson<br />
Dale Sorensen Real Estate<br />
14 th Avenue<br />
14 th Avenue<br />
Zumba Fitness<br />
Furniture Mart<br />
Melody Inn<br />
Highwaymen<br />
Gallery<br />
Irish American Society<br />
Kata Restaurant<br />
Green &<br />
Metcalf<br />
Jetson<br />
12 th Court
SR <strong>60</strong> Lane Reduction Study<br />
Conceptual Alternatives<br />
Existing Section - Eastbound<br />
Proposed Section - Eastbound
SR <strong>60</strong> Lane Reduction Study<br />
Conceptual Alternatives<br />
Existing Section - Westbound<br />
Proposed Section - Westbound
ROADWAY SEGMENT EVALUATION – EXISTING CONDITIONS<br />
The roadway segment evaluation consisted <strong>of</strong> the following:<br />
A review <strong>of</strong> historical Annual Average Daily Traffic (AADT) data<br />
Level <strong>of</strong> service (LOS) determination based on daily traffic volumes<br />
Level <strong>of</strong> service determination based on peak hour and concurrency data<br />
Historical Traffic Data<br />
The purpose <strong>of</strong> reviewing historical data was to identify trends in traffic volume growth and fluctuation.<br />
This analysis helps to identify the roadways (and roadway segments) within the study area that have<br />
experienced increases/decreases in traffic volume. Table 1 provides a summary <strong>of</strong> historical AADT data<br />
available from the FDOT database. Overall, historical data shows traffic volumes on the one-way segment<br />
<strong>of</strong> SR <strong>60</strong> have remained relatively constant over the last 10 years. While historical traffic data are limited<br />
on the primary minor streets within the study area, the trends for the available data are similar to that <strong>of</strong><br />
SR <strong>60</strong>.<br />
LINK<br />
DESCRIPTION<br />
SR <strong>60</strong> from<br />
27 Ave to 20 Ave<br />
SR <strong>60</strong> EB from 20<br />
Ave and Old Dixie<br />
Hwy<br />
SR <strong>60</strong> WB from 20<br />
Ave and Old Dixie<br />
Hwy<br />
SR <strong>60</strong> EB from Old<br />
Dixie Hwy to 10<br />
Ave<br />
SR <strong>60</strong> WB from<br />
Old Dixie Hwy to<br />
10 Ave<br />
21 St from 20 Ave<br />
to US 1<br />
20 Ave south <strong>of</strong><br />
SR <strong>60</strong><br />
Old Dixie Hwy<br />
south <strong>of</strong> SR <strong>60</strong><br />
Table 1: Historical AADT Data<br />
2002 2003 2004 2005 2006 2007 2008 2009 2010 2011<br />
n.a. 26,000 27,500 29,500 25,500 27,500 n.a. 24,000 19,900 23,000<br />
14,000 13,000 13,500 14,000 14,000 15,500 n.a. n.a. 11,500 12,500<br />
11,000 11,000 11,500 12,000 11,500 12,000 9,<strong>60</strong>0 9,400 11,000 11,500<br />
13,000 13,000 14,000 13,000 12,000 12,500 n.a. 13,000 11,000 12,000<br />
13,000 12,000 12,500 9,<strong>60</strong>0 11,000 11,000 n.a. 10,500 10,000 12,000<br />
n.a. n.a. n.a. n.a. n.a. n.a. 4,100 4,400 4,000 4,000<br />
n.a. n.a. n.a. n.a. n.a. n.a. 5,800 4,800 5,300 4,300<br />
n.a. n.a. n.a. n.a. n.a. n.a. 4,400 4,<strong>60</strong>0 4,000 4,000<br />
SR <strong>60</strong> “Twin Pairs” Traffic Calming Feasibility Study Page 8
Level <strong>of</strong> Service<br />
Kimley-Horn compiled 2011 traffic counts to calculate the existing level <strong>of</strong> service on the SR <strong>60</strong> “Twin<br />
Pairs” and roadways in the vicinity. The peak-hour data and concurrency volumes were provided by the<br />
Indian River County Traffic Engineering Division, and the daily traffic volumes were obtained from the<br />
FDOT and the Indian River County Traffic Engineering Division.<br />
The adopted level <strong>of</strong> service standard in the <strong>City</strong> <strong>of</strong> <strong>Vero</strong> <strong>Beach</strong> is LOS ‘D.’ The level <strong>of</strong> service volume<br />
for each roadway segment was determined per Generalized Level <strong>of</strong> Service Volumes tables contained in<br />
the FDOT’s Quality/Level <strong>of</strong> Service Handbook. As presented in Tables 2 and 3, the existing daily and<br />
peak hour volumes on the major roadways in the study area are less than the LOS ‘D’ volume threshold;<br />
therefore, the segments are operating at an acceptable level <strong>of</strong> service with reserve capacity.<br />
Table 2: Existing Conditions Daily Traffic Volumes and Level <strong>of</strong> Service<br />
LINK DESCRIPTION AADT/ ADT LOS<br />
LOS D<br />
Volume<br />
SR <strong>60</strong> between 27 Avenue and 20 Avenue 23,000 C 50,300<br />
SR <strong>60</strong> EB between 20 Avenue and Old Dixie Highway 12,500 C 30,180<br />
SR <strong>60</strong> WB between 20 Avenue and Old Dixie Highway 11,500 C 40,380<br />
SR <strong>60</strong> EB between Old Dixie Highway and 10 Avenue 12,000 C 30,180<br />
SR <strong>60</strong> WB between Old Dixie Highway and 10 Avenue 12,000 C 40,380<br />
21 Street between 20 th Avenue and Old Dixie Highway 4,000 C 13,680<br />
14 Avenue between SR <strong>60</strong> and 16 Street 6,900 C 13,680<br />
14 Avenue between SR <strong>60</strong> and US 1 5,800 C 13,680<br />
20 Avenue between SR <strong>60</strong> and 16 Street 4,300 C 13,680<br />
20 Avenue between SR <strong>60</strong> and Atlantic Boulevard 1,<strong>60</strong>0 C 13,680<br />
Old Dixie Highway between SR <strong>60</strong> and 16 Street 4,000 C 13,680<br />
16 Street between Old Dixie Highway and 20 Avenue 9,300 D 10,710<br />
US 1 north <strong>of</strong> 21 Street 20,000 C 33,200<br />
US 1 east <strong>of</strong> FEC Railroad 18,300 C 33,200<br />
SR <strong>60</strong> “Twin Pairs” Traffic Calming Feasibility Study Page 9
Table 3: Existing Peak Hour Directional Volumes and Concurrency (Vested) Trips<br />
Link Description Volume Vested Trips Total Demand LOS<br />
SR <strong>60</strong> EB from 27 Avenue to 20 Avenue 987 104 1,091 C<br />
SR <strong>60</strong> WB from 27 Avenue to 20 Avenue 1,075 205 1,280 C<br />
SR <strong>60</strong> EB from 20 Avenue to Old Dixie Hwy 1,056 104 1,1<strong>60</strong> C<br />
SR <strong>60</strong> WB from 20 Avenue to Old Dixie Hwy 1,056 142 1,198 C<br />
SR <strong>60</strong> EB from Old Dixie Hwy to 10 Avenue 1,031 50 1,081 C<br />
SR <strong>60</strong> WB from Old Dixie Hwy to 10 Avenue 891 77 968 C<br />
SR <strong>60</strong> EB from 10 Ave to US 1 909 42 951 C<br />
SR <strong>60</strong> WB from 10 Ave to US 1 645 48 693 C<br />
16 Street EB from 27 Ave to 20 Avenue 341 27 368 D<br />
16 Street WB from 27 Ave to 20 Avenue 436 41 477 D<br />
16 EB Street from 20 Ave to Old Dixie Hwy 417 18 435 D<br />
16 WB Street from 20 Ave to Old Dixie Hwy 525 34 559 D<br />
16/17 Street EB from Old Dixie Hwy to US 1 694 36 730 D<br />
16/17 Street WB from Old Dixie Hwy to US 1 644 32 676 D<br />
Old Dixie Hwy NB from 16 Street to SR <strong>60</strong> 225 16 241 C<br />
Old Dixie Hwy SB from 16 Street to SR <strong>60</strong> 250 14 264 C<br />
20 Avenue NB from 16 Street to SR <strong>60</strong> 214 11 225 C<br />
20 Avenue SB from 16 Street to SR <strong>60</strong> 287 11 298 C<br />
20 Avenue NB from SR <strong>60</strong> to Atlantic Blvd 119 7 126 C<br />
20 Avenue SB from SR <strong>60</strong> to Atlantic Blvd 148 12 1<strong>60</strong> C<br />
SR <strong>60</strong> “Twin Pairs” Traffic Calming Feasibility Study Page 10
INTERSECTION EVALUATION – EXISTING CONDITIONS<br />
The intersection evaluation focused on signalized intersections within the corridor. Intersection turning<br />
movement counts were obtained from the Indian River County Traffic Engineering Division for the<br />
signalized intersections in the study area. These traffic counts were collected in 2011 or 2012 between<br />
4:00 p.m. and 5:00 p.m., which represents the peak traffic conditions in the study area. Please note that<br />
turning movements counts for unsignalized intersections were not available from the County, and hence<br />
those intersections were not evaluated.<br />
Kimley-Horn adjusted traffic volumes to reflect peak season conditions <strong>of</strong> the year by applying peak<br />
season conversion factors. The study area intersections were analyzed using Synchro s<strong>of</strong>tware to<br />
determine the intersection LOS during the p.m. peak hour, which reflects the highest traffic conditions <strong>of</strong><br />
the typical day. Synchro is an operational analysis tool based on the Highway Capacity Manual. It has<br />
the capability to model actuated and coordinated networks, calculate intersection delay, and define level<br />
<strong>of</strong> service based on the input traffic volumes, signal timings and phasing, and corridor <strong>of</strong>fsets. A summary<br />
<strong>of</strong> the level <strong>of</strong> service analysis is provided in Table 3, and the detailed Synchro analysis results are<br />
included in Appendix B. As shown in Table 4, all intersections and individual approaches to the<br />
intersections operate satisfactorily.<br />
Intersection<br />
Table 4: P.M. Peak Level <strong>of</strong> Service - Existing Conditions<br />
Intersection<br />
LOS/Delay<br />
Approach LOS and Delay (seconds)<br />
NB SB EB WB<br />
SR <strong>60</strong> EB & 20 Avenue SB B/14.5 - A/7.0 B/16.4 -<br />
SR <strong>60</strong> EB & 20 Avenue NB A/9.4 D/41.5 - A/0.1 -<br />
SR <strong>60</strong> WB & 20 Avenue SB B/18.8 - D/51.8 - B/12.3<br />
SR <strong>60</strong> WB & 20 Avenue NB B/18.9 A/1.6 - - C/21.3<br />
SR <strong>60</strong> EB & 14 Avenue B/14.5 C/21.6 B/19.3 B/10.5 -<br />
SR <strong>60</strong> WB & 14 Avenue B/19.2 A/9.5 C/29.6 - B/17.3<br />
SR <strong>60</strong> EB & Commerce Avenue A/3.1 C/25.1 C/20.5 A/1.2 -<br />
SR <strong>60</strong> WB & US 1/Commerce Avenue A/6.6 C/27.9 C/24.0 - A/4.1<br />
SR <strong>60</strong> WB & 11 Avenue A/7.8 B/18.8 C/22.6 - A/4.8<br />
SR <strong>60</strong> EB & 10 Avenue A/9.2 C/22.3 C/20.8 A/5.1 -<br />
SR <strong>60</strong> WB & 10 Avenue A/9.9 C/20.1 C/22.1 - A/3.9<br />
SR <strong>60</strong> “Twin Pairs” Traffic Calming Feasibility Study Page 11
TRAFFIC VOLUME FORECASTS<br />
To determine if the proposed cross-section would accommodate future volumes and to determine the<br />
impacts to other roadways and intersections in the study area, we projected traffic data to reflect the 2035<br />
conditions. The 2035 conditions correspond to the horizon year used in the latest Indian River County<br />
Long Range Transportation Plan (LRTP). The Greater Treasure Coast Regional Planning Model<br />
(GTCRPM) was utilized to forecast future volumes. The following model scenarios were used in this<br />
analysis:<br />
2005 baseline model<br />
2035 model, which reflects the traffic and roadway conditions based on anticipated demographic<br />
conditions and roadway network improvements identified in the 2035 LRTP (referred to as the “no<br />
build conditions”).<br />
2035 model modified to reflect the reduction <strong>of</strong> lanes on the SR <strong>60</strong> “Twin Pairs” (referred to as the<br />
“build conditions”).<br />
Model Calibration<br />
The roadway network coding was reviewed to ensure the characteristics <strong>of</strong> the roadway network within<br />
the study area are accurately reflected in the GTCRPM. This review included an assessment <strong>of</strong> traffic<br />
analysis zones (TAZs) centroid connectors, laneage, speed, facility type, and projected volumes. Where<br />
necessary, adjustments were made to the model network attributes, including modification <strong>of</strong> centroid<br />
connectors. The network adjustments were made iteratively until the model network and volumes were<br />
deemed to reflect actual roadway network conditions. The GTCRPM model output files are included in<br />
Appendix C.<br />
Growth Rate<br />
We calculated growth rates by comparing the traffic volumes forecast in the 2005 GTCRPM and 2035<br />
GTCRMP (no-build and build models). The purpose <strong>of</strong> estimating these growth rates was to establish<br />
future year (2035) traffic volumes with and without the SR <strong>60</strong> “Twin Pairs” lane reduction. A summary <strong>of</strong><br />
model-based traffic volumes that were used to develop growth rates is included in Table 5. Based on the<br />
review <strong>of</strong> traffic volumes, separate aggregate growth rates were applied for SR <strong>60</strong>, 21 st Street, and the<br />
north-south minor streets within the study area. These growth rates were applied to the existing traffic<br />
volumes to determine future year 2035 traffic volumes for the study area roadway segments and<br />
intersections.<br />
SR <strong>60</strong> “Twin Pairs” Traffic Calming Feasibility Study Page 12
Segment<br />
Table 5: GTCRPM Traffic Volume Forecasts and Growth Rates<br />
2005<br />
Conditions<br />
(1)<br />
2035 w/o<br />
Lane<br />
Reduction (2)<br />
2035 with<br />
Lane<br />
Reduction (3)<br />
Annual<br />
Growth<br />
Rate<br />
(1) to (2)<br />
SR <strong>60</strong> “Twin Pairs” Traffic Calming Feasibility Study Page 13<br />
Annual<br />
Growth<br />
Rate<br />
(1) to (3)<br />
SR <strong>60</strong> – West <strong>of</strong> 20 Avenue 34,000 41,000 40,500 0.6 0.6<br />
SR <strong>60</strong> EB – 20 Avenue to 14 Avenue 15,800 18,750 18,150 0.6 0.5<br />
SR <strong>60</strong> WB – 20 Avenue to 14<br />
Avenue<br />
SR <strong>60</strong> EB – 14 Avenue to Commerce<br />
Avenue<br />
SR <strong>60</strong> WB – 14 Avenue to<br />
Commerce Avenue<br />
13,300 17,200 15,700 0.9 0.6<br />
14,950 16,200 15,800 0.3 0.2<br />
10,800 13,300 12,700 0.7 0.5<br />
SR <strong>60</strong> EB – Commerce Ave to US 1 13,100 14,400 13,750 0.3 0.2<br />
SR <strong>60</strong> WB – Commerce Ave to US 1 12,900 15,500 15,250 0.6 0.6<br />
20 Avenue – south <strong>of</strong> SR <strong>60</strong> 4,750 4,750 4,650 0.0 -0.1<br />
20 Avenue – north <strong>of</strong> SR <strong>60</strong> 8,700 10,900 10,300 0.8 0.6<br />
14 Avenue – south <strong>of</strong> SR <strong>60</strong> 8,200 10,050 9,950 0.7 0.6<br />
14 Avenue – north <strong>of</strong> SR <strong>60</strong> 12,100 12,200 12,100 0.0 0.0<br />
10 Avenue – south <strong>of</strong> SR <strong>60</strong> 4,150 9,000 9,400 2.6 2.8<br />
10 Avenue – north <strong>of</strong> SR <strong>60</strong> 7,800 9,800 9,900 0.8 0.8<br />
21 Street – West <strong>of</strong> 20 Avenue 4,700 7,900 8,000 1.7 1.8<br />
21 Street – 20 Avenue to 14 Avenue 3,300 7,300 8,400 2.7 3.2<br />
21 Street – 14 Avenue to Commerce<br />
Avenue<br />
US 1 – Commerce Avenue to E <strong>of</strong> 10<br />
Avenue<br />
5,000 8,100 9,200 1.6 2.1<br />
16,500 17,050 17,250 0.1 0.1<br />
US 1 – south <strong>of</strong> SR <strong>60</strong> 24,950 25,250 25,150 0.0 0.0<br />
US 1 – north <strong>of</strong> SR <strong>60</strong> 13,300 12,100 12,100 -0.3 -0.3<br />
Aggregate Growth Rates<br />
SR <strong>60</strong> (one-way pair) 0.6 0.4<br />
21 Street 2.0 2.3<br />
North-south minor streets 0.8 0.8<br />
Diversions<br />
The potential diversion <strong>of</strong> traffic from the SR <strong>60</strong> “Twin Pairs” to other roads due to the reduction <strong>of</strong><br />
capacity was estimated by comparing the GTCRPM model output from the 2035 “build” and “no build”<br />
scenarios. The traffic diversion analysis was used to assess if any adjacent streets would be adversely
impacted by the SR <strong>60</strong> lane reduction, including potential impacts to residential areas. Table 6 compares<br />
the model volumes with and without the proposed lane reduction.<br />
The most noticeable diversion <strong>of</strong> traffic is from SR <strong>60</strong> to 21 Street, which is a parallel street serving<br />
Downtown <strong>Vero</strong> <strong>Beach</strong>. An estimated increase <strong>of</strong> 1,100 vehicles per day on 21 Street (or approximately<br />
110 vehicles during the peak hour) is indicated in the GTCRPM analysis. As shown in Table 6, minimal<br />
impacts are expected on the north-south local streets such as 10 Avenue, 14 Avenue, and 20 Avenue.<br />
Intersection and roadway segment level <strong>of</strong> service analyses for the 2035 conditions are presented in the<br />
next sections.<br />
Segment<br />
Table 6: Traffic Volume Diversion Analysis<br />
2005<br />
Conditions<br />
(1)<br />
2035 w/o<br />
Lane<br />
Reduction<br />
(2)<br />
2035 with<br />
Lane<br />
Reduction<br />
(3)<br />
Traffic<br />
Volume<br />
Differential<br />
(4) = (3)-(2)<br />
% Change<br />
(4)/(2)<br />
SR <strong>60</strong> – West <strong>of</strong> 20 Avenue 34,000 41,000 40,500 -500 -1.2%<br />
SR <strong>60</strong> EB – 20 Avenue to 14 Avenue 15,800 18,750 18,150 -<strong>60</strong>0 -3.2%<br />
SR <strong>60</strong> WB – 20 Avenue to 14<br />
Avenue<br />
SR <strong>60</strong> EB – 14 Avenue to Commerce<br />
Avenue<br />
SR <strong>60</strong> WB – 14 Avenue to<br />
Commerce Avenue<br />
13,300 17,200 15,700 -1,500 -8.7%<br />
14,950 16,200 15,800 -400 -2.5%<br />
10,800 13,300 12,700 -<strong>60</strong>0 -4.5%<br />
SR <strong>60</strong> EB – Commerce Ave to US 1 13,100 14,400 13,750 -650 -4.5%<br />
SR <strong>60</strong> WB – Commerce Ave to US 1 12,900 15,500 15,250 -250 -1.6%<br />
20 Avenue – south <strong>of</strong> SR <strong>60</strong> 4,750 4,750 4,650 -100 -2.1%<br />
20 Avenue – north <strong>of</strong> SR <strong>60</strong> 8,700 10,900 10,300 -<strong>60</strong>0 -5.5%<br />
14 Avenue – south <strong>of</strong> SR <strong>60</strong> 8,200 10,050 9,950 -100 -1.0%<br />
14 Avenue – north <strong>of</strong> SR <strong>60</strong> 12,100 12,200 12,100 -100 -0.8%<br />
10 Avenue – south <strong>of</strong> SR <strong>60</strong> 4,150 9,000 9,400 400 4.4%<br />
10 Avenue – north <strong>of</strong> SR <strong>60</strong> 7,800 9,800 9,900 100 1.0%<br />
21 Street – West <strong>of</strong> 20 Avenue 4,700 7,900 8,000 100 1.3%<br />
21 Street – 20 Avenue to 14 Avenue 3,300 7,300 8,400 1,100 15.1%<br />
21 Street – 14 Avenue to Commerce<br />
Avenue<br />
US 1 – Commerce Avenue to E <strong>of</strong> 10<br />
Avenue<br />
5,000 8,100 9,200 1,100 13.6%<br />
16,500 17,050 17,250 200 1.2%<br />
US 1 – south <strong>of</strong> SR <strong>60</strong> 24,950 25,250 25,150 -100 -0.4%<br />
US 1 – north <strong>of</strong> SR <strong>60</strong> 13,300 12,100 12,100 0 0.0%<br />
SR <strong>60</strong> “Twin Pairs” Traffic Calming Feasibility Study Page 14
ROADWAY SEGMENT EVALUATION – 2035 CONDITIONS<br />
To evaluate the roadway segments for 2035 traffic conditions, we utilized the GTCRPM traffic volume<br />
forecasts, rather than the extrapolation <strong>of</strong> existing conditions traffic counts based on historic growth<br />
trends, since the GTCRPM volumes are higher and hence provide for a conservative analysis. Further,<br />
the GTCRPM volumes consider potential traffic diversion resulting from the reduction <strong>of</strong> lanes on SR <strong>60</strong><br />
“Twin Pairs.” As shown in Table 7, all roadway segments, including the SR <strong>60</strong> “Twin Pairs”, are<br />
expected to continue to operate at LOS D or better in 2035 with the proposed lane reduction.<br />
Segment<br />
Table 7: 2035 Roadway Segment Volumes and Level <strong>of</strong> Service<br />
Without SR <strong>60</strong> Lane Reduction With SR <strong>60</strong> Lane Reduction<br />
Lanes<br />
Daily<br />
Volume<br />
Level <strong>of</strong><br />
Service<br />
Lanes<br />
Daily<br />
Volume<br />
SR <strong>60</strong> – West <strong>of</strong> 20 Avenue 6 41,000 D 6 40,500 D<br />
SR <strong>60</strong> EB – 20 Avenue to 14 Avenue 3 18,750 C 2 18,150 D<br />
SR <strong>60</strong> WB – 20 Avenue to 14<br />
Avenue<br />
SR <strong>60</strong> EB – 14 Avenue to Commerce<br />
Avenue<br />
SR <strong>60</strong> WB – 14 Avenue to<br />
Commerce Avenue<br />
SR <strong>60</strong> “Twin Pairs” Traffic Calming Feasibility Study Page 15<br />
Level <strong>of</strong><br />
Service<br />
4 17,200 C 2 15,700 D<br />
3 16,200 C 2 15,800 D<br />
4 13,300 C 2 12,700 C<br />
SR <strong>60</strong> EB – Commerce Ave to US 1 3 14,400 C 3 13,750 C<br />
SR <strong>60</strong> WB – Commerce Ave to US 1 4 15,500 C 4 15,250 C<br />
20 Avenue – south <strong>of</strong> SR <strong>60</strong> 4 4,750 C 4 4,650 C<br />
20 Avenue – north <strong>of</strong> SR <strong>60</strong> 2 10,900 C 2 10,300 C<br />
14 Avenue – south <strong>of</strong> SR <strong>60</strong> 2 10,050 D 2 9,950 D<br />
14 Avenue – north <strong>of</strong> SR <strong>60</strong> 2 12,200 D 2 12,100 D<br />
10 Avenue – south <strong>of</strong> SR <strong>60</strong> 2 9,000 D 2 9,400 D<br />
10 Avenue – north <strong>of</strong> SR <strong>60</strong> 2 9,800 D 2 9,900 D<br />
21 Street – West <strong>of</strong> 20 Avenue 2 7,900 C 2 8,000 C<br />
21 Street – 20 Avenue to 14 Avenue 2 7,300 C 2 8,400 C<br />
21 Street – 14 Avenue to Commerce<br />
Avenue<br />
US 1 – Commerce Avenue to E <strong>of</strong> 10<br />
Avenue<br />
2 8,100 C 2 9,200 D<br />
4 17,050 C 4 17,250 C<br />
US 1 – south <strong>of</strong> SR <strong>60</strong> 4 25,250 D 4 25,150 D<br />
US 1 – north <strong>of</strong> SR <strong>60</strong> 4 12,100 C 4 12,100 C
INTERSECTION EVALUATION - 2035 CONDITIONS<br />
To evaluate signalized intersections under 2035 conditions (no build and build), we extrapolated existing<br />
peak hour intersection volumes by applying the growth rates developed from the GTCRPM forecasts.<br />
The future peak hour volumes at the study area intersections were analyzed using Synchro s<strong>of</strong>tware to<br />
determine the intersection level <strong>of</strong> service during the peak hour. As shown in the concept plan, the<br />
proposed geometric modifications were incorporated into the “build scenario” operational analysis. The<br />
signal timing splits were optimized to adjust for future volumes and the proposed laneage modifications.<br />
The resulting levels <strong>of</strong> service at each intersection are summarized in Tables 8 and 9. The Synchro<br />
output is included in Appendix D.<br />
Level <strong>of</strong> Service<br />
All <strong>of</strong> the intersections are expected to operate at an overall LOS C or better without or with the proposed<br />
lane reduction. The individual approaches to the intersections are also expected to operate at LOS D or<br />
better. The signalized intersections at SR <strong>60</strong> and 14 th Avenue exhibit an increase in overall intersection<br />
delay between 5-10 seconds. In general, the impact <strong>of</strong> the lane reductions on intersections within the<br />
study area appears to be minimal.<br />
Intersection<br />
Table 8: P.M. Peak Level <strong>of</strong> Service – 2035 No Build Conditions<br />
Intersection<br />
LOS/Delay<br />
Approach LOS and Delay (seconds)<br />
NB SB EB WB<br />
SR <strong>60</strong> EB & 20 Avenue SB B/19.0 - A/7.1 C/22.4 -<br />
SR <strong>60</strong> EB & 20 Avenue NB A/9.5 D/39.3 - A/0.1 -<br />
SR <strong>60</strong> WB & 20 Avenue SB C/24.3 - D/51.5 - B/18.4<br />
SR <strong>60</strong> WB & 20 Avenue NB C/25.5 A/1.6 - - C/29.1<br />
SR <strong>60</strong> EB & 14 Avenue B/16.9 C/22.2 B/19.1 B/14.2 -<br />
SR <strong>60</strong> WB & 14 Avenue C/23.4 A/9.1 D/44.1 - B/17.8<br />
SR <strong>60</strong> EB & Commerce Avenue A/3.3 C/24.9 C/20.5 A/1.2 -<br />
SR <strong>60</strong> WB & US 1/Commerce Avenue A/7.8 C/26.1 C/24.4 - A/5.3<br />
SR <strong>60</strong> WB & 11 Avenue A/8.5 B/17.8 C/22.8 - A/5.6<br />
SR <strong>60</strong> EB & 10 Avenue A/9.8 C/22.3 B/19.4 A/5.6 -<br />
SR <strong>60</strong> WB & 10 Avenue B/11.0 C/21.7 C/20.8 - A/4.9<br />
SR <strong>60</strong> “Twin Pairs” Traffic Calming Feasibility Study Page 16
Intersection<br />
Table 9: P.M. Peak Level <strong>of</strong> Service – 2035 Build Conditions<br />
Intersection<br />
LOS/Delay<br />
Approach LOS and Delay (seconds)<br />
NB SB EB WB<br />
SR <strong>60</strong> EB & 20 Avenue SB B/17.7 - B/10.4 B/19.8 -<br />
SR <strong>60</strong> EB & 20 Avenue NB A/9.6 D/38.8 - A/0.2 -<br />
SR <strong>60</strong> WB & 20 Avenue SB C/22.9 - D/53.0 - B/16.3<br />
SR <strong>60</strong> WB & 20 Avenue NB C/20.9 A/1.8 - - C/23.8<br />
SR <strong>60</strong> EB & 14 Avenue C/21.7 C/22.1 B/19.3 C/22.8 -<br />
SR <strong>60</strong> WB & 14 Avenue C/33.7 A/9.1 D/44.1 - D/36.7<br />
SR <strong>60</strong> EB & Commerce Avenue A/3.5 C/25.0 C/20.7 A/1.4 -<br />
SR <strong>60</strong> WB & US 1/Commerce Avenue A/7.1 C/26.4 C/24.2 - A/4.5<br />
SR <strong>60</strong> WB & 11 Avenue A/8.6 B/17.9 C/22.9 - A/5.5<br />
SR <strong>60</strong> EB & 10 Avenue B/11.2 C/22.6 C/21.1 A/4.7 -<br />
SR <strong>60</strong> WB & 10 Avenue B/11.0 C/21.7 C/20.8 - A/4.9<br />
SR <strong>60</strong> “Twin Pairs” Traffic Calming Feasibility Study Page 17
CRASH ANALYSIS<br />
Crash data for major roads within the study limits for years 2009 through 2011 (the last available full year<br />
<strong>of</strong> data) were provided by Indian River County Traffic Engineering Division. The data were tabulated to<br />
identify crash types by intersection and by roadway segment. Please note police crash reports were not<br />
reviewed to verify the accuracy <strong>of</strong> the electronic crash data. The results <strong>of</strong> the crash analysis are<br />
discussed below.<br />
Crashes by Roadway Location<br />
The intersection <strong>of</strong> SR <strong>60</strong> and 20 th Avenue experienced the highest number <strong>of</strong> crashes. Approximately<br />
55 percent (16 out <strong>of</strong> 29) <strong>of</strong> crashes were angle. During stakeholder coordination meetings, the Indian<br />
River County Traffic Engineering Division requested that the present lane configuration be maintained at<br />
the subject intersection. Therefore, potential operational and signage improvements may be appropriate,<br />
such as advance flashers, retroreflective tapes on backplates, and increased all red clearance time to<br />
mitigate angle crashes. In general, crash data at other intersections do not indicate discernable patterns<br />
that warrant further assessment. Further, FDOT’s High Crash Location list for 2010 does not identify any<br />
intersections within the study limits as high crash locations.<br />
INTERSECTION<br />
Table 10: Crashes by Intersection<br />
SR <strong>60</strong> and 20 Avenue 4 16 1 3 1 4 29<br />
SR <strong>60</strong> EB and 14 Avenue 7 8 1 3 1 1 1 22<br />
SR <strong>60</strong> WB and 14 Avenue 3 7 2 2 1 15<br />
SR <strong>60</strong> EB and Commerce Avenue 8 2 2 2 2 16<br />
SR <strong>60</strong> WB and Commerce Avenue 2 4 4 2 12<br />
SR <strong>60</strong> EB and 10 Avenue 2 3 1 1 7<br />
SR <strong>60</strong> WBand 10 Avenue 1 2 1 3 1 8<br />
SR <strong>60</strong> WBand 11 Avenue 2 1 1 4<br />
21 Street and 14 Avenue 3 2 2 1 8<br />
21 Street and US 1/Commerce Avenue 4 3 6 5 18<br />
SR <strong>60</strong> “Twin Pairs” Traffic Calming Feasibility Study Page 18<br />
Rear end<br />
Angle<br />
Left turn<br />
Right turn<br />
Sideswipe<br />
Backed into<br />
Parked<br />
Pedestrian<br />
Bicycle<br />
Other<br />
Total
Crashes by Roadway Segment<br />
A review <strong>of</strong> corridor-specific crash data shows that angle, rear end and sideswipe are the most frequent<br />
crash types. However, the majority <strong>of</strong> these crashes occurred in proximity to the signalized intersections.<br />
A noticeable crash pattern is sideswipe crashes on westbound SR <strong>60</strong> between east <strong>of</strong> 20 th Avenue and<br />
Commerce Avenue. The presence <strong>of</strong> four lanes may be contributory to a higher number <strong>of</strong> sideswipe<br />
crashes. The proposed reduction <strong>of</strong> westbound lanes from four to two may help to reduce the sideswipe<br />
crashes. A review <strong>of</strong> FDOT’s High Crash Segment list for 2010 did not identify any high crash segments<br />
within study limits.<br />
LINK DESCRIPTION<br />
SR <strong>60</strong> EB between 20 Avenue and Commerce Avenue 1<br />
SR <strong>60</strong> WB between 20 Avenue and Commerce Avenue 1<br />
Table 11: Crashes by Roadway Segment<br />
SR <strong>60</strong> “Twin Pairs” Traffic Calming Feasibility Study Page 19<br />
Rear end<br />
Angle<br />
Left turn<br />
Right turn<br />
Sideswipe<br />
Backed into<br />
Parked<br />
Pedestrian<br />
Bicycle<br />
Other<br />
Total<br />
19 14 7 7 1 1 1 6 56<br />
5 10 8 15 4 42<br />
SR <strong>60</strong> EB between E <strong>of</strong> Commerce Avenue and W <strong>of</strong> US 1 2 6 1 2 1 12<br />
SR <strong>60</strong> WB between E <strong>of</strong> Commerce Avenue and W <strong>of</strong> US 1 1 5 3 5 2 16<br />
21 Street between 20 Avenue and Commerce Avenue\US 1 6 10 1 9 1 6 33<br />
14 Avenue between 19 Street and 21 Street 14 19 5 6 1 1 2 48<br />
20 Avenue between 19 Street and 21 Street 4 18 2 4 1 4 33<br />
Old Dixie Highway between SR <strong>60</strong> WB and 19 Street 4 4<br />
Note 1: Does not include crashes at 20 Avenue<br />
Safety Benefits <strong>of</strong> Lane Reduction<br />
“Road Diets” (lane reduction) has been identified by the Federal Highway Administration (FHWA) as one<br />
<strong>of</strong> the nine proven countermeasures to reduce crashes. Based on the information presented at a recent<br />
webinar (Road Diets and Pedestrian Safety, November 20, 2012) conducted by the Pedestrian and<br />
Bicycle Information Center (PBIC), before versus after studies have shown that road diet projects result in<br />
both crash and speed reductions. The degree <strong>of</strong> crash and speed reduction varies by local conditions.<br />
According to Libby Thomas (University <strong>of</strong> North Carolina Highway Safety Research Center), the most<br />
robust studies show a reduction <strong>of</strong> total crashes between 19 percent and 48 percent. Another<br />
observation is that higher severity crashes may also be significantly reduced. Further, the 85 th percentile<br />
speed and top end speeds have typically decreased. Due to the small number <strong>of</strong> crashes and the lack <strong>of</strong><br />
exposure data, the effects on pedestrians have not been quantified. However, before versus after safety<br />
data presented by Mile Sallaberry (San Francisco Municipal Transportation Agency) shows 35 percent
eduction <strong>of</strong> total crashes and <strong>60</strong> percent reduction <strong>of</strong> pedestrian crashes for one corridor (Alemany<br />
Boulevard). Finally, Gina C<strong>of</strong>fman (Toole Design Group) provided the following detailed breakdown <strong>of</strong><br />
safety data for a road diet project in Seattle.<br />
As shown above, the majority <strong>of</strong> crash types decreased after the implementation <strong>of</strong> a road diet project.<br />
However, congestion-related crashes such as rear end crashes may increase due to reduced capacity.<br />
Overall, road diet projects have shown the ability to reduce (1) frequency <strong>of</strong> total crashes, (2) severity <strong>of</strong><br />
crashes, and (3) vehicular speeds.<br />
SR <strong>60</strong> “Twin Pairs” Traffic Calming Feasibility Study Page 20
Transit<br />
TRANSIT AND NON-MOTORIZED FACILITIES<br />
As shown in Figure 4, Indian River County’s transit service, GoLine, does not operate along the SR <strong>60</strong><br />
“Twin Pairs.” GoLine Route 2, which operates between Indian River Mall and the Main Transit Hub, uses<br />
SR <strong>60</strong> between 58 th Avenue and 20 th Avenue. GoLine routes operate along 14 th Avenue, 16 th Avenue,<br />
and 20 th Avenue, which intersect the SR <strong>60</strong> “Twin Pairs.” The Indian River County MPO’s Transit<br />
Development Plan (TDP) does not identify transit service expansions along the SR <strong>60</strong> “Twin Pairs.”<br />
Therefore, transit facilities are not expected to be impacted.<br />
The Florida East Coast (FEC) railroad corridor is being considered for future intercity passenger rail<br />
service between Miami and Jacksonville. A station in <strong>Vero</strong> <strong>Beach</strong> is envisioned in the preliminarily plans.<br />
Pedestrian facility enhancements may be identified for SR <strong>60</strong> in the design phase at locations that<br />
complement pedestrian flow to and from the proposed station.<br />
Figure 4: GoLine Transit Routes<br />
SR <strong>60</strong> “Twin Pairs” Traffic Calming Feasibility Study Page 21
Pedestrian and Bicycle Facilities<br />
A primary objective <strong>of</strong> the lane reduction project is to create a safer environment for pedestrians and<br />
bicyclists in Downtown. Creating a pedestrian friendly environment is <strong>of</strong> utmost importance for Downtown<br />
redevelopment efforts. With seven one-way lanes and a 40 mph posted speed, SR <strong>60</strong> presents a barrier<br />
for pedestrians. The only signalized crossing within Downtown is provided at 14 th Avenue. The provision<br />
<strong>of</strong> on-street parking is expected to increase pedestrian activities along SR <strong>60</strong>. The study<br />
recommendations for improving pedestrian safety and encouraging walking within Downtown are listed<br />
below.<br />
Reduce crossing distance (across SR <strong>60</strong>) at 14 th Avenue by adding curb extensions<br />
Reduce exposure time for pedestrians crossing at mid-block locations through lane reduction<br />
Increase lateral separation between the sidewalk and travel lanes by converting travel lanes into<br />
on-street parking and landscaping spaces<br />
Reduce speed limit from 40 mph to 35 mph within the project limits<br />
Reconstruct sub-standard ADA facilities within the project limits<br />
Currently four-foot bicycle lanes (plus curb and gutter width) are provided along SR <strong>60</strong>. As part <strong>of</strong> this<br />
project, the existing bicycle lanes are proposed to be widened from four feet to five feet. On eastbound<br />
SR <strong>60</strong>, bicycle lanes will remain on the south side, and on-street parking will be introduced on the north<br />
side. On westbound SR <strong>60</strong>, bicycle lanes will remain on the north side, and on-street parking will be<br />
introduced on both sides. The proposed width <strong>of</strong> the parking lane on westbound SR <strong>60</strong> is 11.5 feet<br />
(measured from curb), which is greater than the eight-foot minimum width specified in the FDOT Plans<br />
Preparations Manual (PPM). The increased width <strong>of</strong> the parking lane should help to minimize conflicts<br />
between bicycle and parking maneuvers. Overall, the provision <strong>of</strong> five-foot bicycle lanes and the<br />
proposed speed limit reduction are expected to improve safety for bicyclists and encourage the use <strong>of</strong><br />
bicycle facilities.<br />
SR <strong>60</strong> “Twin Pairs” Traffic Calming Feasibility Study Page 22
EVACUATION<br />
SR <strong>60</strong>, which provides access to I-95 and interior parts <strong>of</strong> Florida from the Barrier Island and <strong>Vero</strong> <strong>Beach</strong>,<br />
is a designated evacuation route in Indian River County. Figure 5 identifies designated evacuation zones,<br />
routes, and shelters. Out <strong>of</strong> the three evacuation routes from the Barrier Island, two routes feed into SR<br />
<strong>60</strong>. The present lane configuration <strong>of</strong> SR <strong>60</strong> between Indian River Boulevard and I-95 is summarized<br />
below.<br />
Indian River Boulevard to 8 th Avenue – 4 lanes<br />
8 th Avenue to 20 th Avenue – 7 lanes (3 lanes eastbound and 4 lanes westbound)<br />
20 th Avenue to I-95 – 6 lanes<br />
The proposed project will reduce the number <strong>of</strong> lanes between the FEC Railroad and 20 th Avenue from<br />
seven lanes to four lanes. In particular, westbound travel lanes will be reduced from four lanes to two<br />
lanes. With the proposed lane reduction, the study segment will have the same number <strong>of</strong> lanes in the<br />
westbound direction as the segment between Indian River Boulevard and 8 th Avenue. A limited<br />
qualitative assessment <strong>of</strong> potential impacts <strong>of</strong> lane reduction on emergency evacuations was performed,<br />
and the results are summarized below.<br />
First, the results <strong>of</strong> Statewide Regional Evacuation Study (SRES) for the Treasure Coast Region (2010)<br />
were reviewed. This study estimated county-wide evacuation times using Transportation Interface for<br />
Modeling Evacuations (TIME) for 2010 and 2015. The “clearance time to shelter” for Indian River County<br />
during a 100 percent evacuation <strong>of</strong> at-risk population in different evacuation zones varies between 12.5 to<br />
19.0 hours for year 2015. During such an evacuation, the estimated traffic volume on SR <strong>60</strong> within <strong>Vero</strong><br />
<strong>Beach</strong> varies from 4,800 to 17,400. According to FDOT’s Generalized Peak Hour Directional Volume<br />
table, a two-lane, one-way street could carry up to 2,240 vehicles per hour (LOS E volume for a Class II<br />
road adjusted for a one-way facility). During an evacuation, it can be inferred that the LOS E volumes<br />
can be maintained until the evacuation is complete. Therefore, hypothetically, up to 53,7<strong>60</strong> (2,240 x 24)<br />
vehicles can be accommodated on a two-lane, one-way street.<br />
Second, Indian River County’s grid roadway network <strong>of</strong>fers alternative routes for travel between two<br />
points. 16 th Street, which was recently widened to four lanes between US 1 and 14 th Avenue, could serve<br />
as an alternative route to bypass the one-way segment <strong>of</strong> SR <strong>60</strong> during an evacuation. 16 th Street aligns<br />
with the 17 th Street Causeway Bridge, thus providing a direct connection to the Barrier Island.<br />
SR <strong>60</strong> “Twin Pairs” Traffic Calming Feasibility Study Page 23
Third, the Indian River County MPO’s 2035 LRTP identifies a new interchange at Oslo Road and I-95.<br />
Further, Oslo Road is planned to be widened to four lanes between 58 th Avenue and I-95. These two<br />
projects are currently included in the FDOT Work Program for preliminary engineering and could result in<br />
a new evacuation route in the future.<br />
The above qualitative assessment shows that the reduction <strong>of</strong> lanes on SR <strong>60</strong> between the FEC Railroad<br />
and 20 th Avenue is not expected to have an adverse impact on evacuation.<br />
Figure 5: Evacuation Routes and Shelters<br />
SR <strong>60</strong> “Twin Pairs” Traffic Calming Feasibility Study Page 24
SUMMARY AND NEXT STEPS<br />
The <strong>City</strong> <strong>of</strong> <strong>Vero</strong> <strong>Beach</strong> requested that the Indian River County MPO conduct a traffic calming feasibility<br />
study to develop measures to mitigate the adverse impacts <strong>of</strong> the SR <strong>60</strong> “Twin Pairs” on pedestrian-<br />
oriented mixed-use development in Downtown <strong>Vero</strong> <strong>Beach</strong>. This study evaluated the feasibility <strong>of</strong><br />
reducing eastbound travel lanes from three to two and westbound travel lanes from four to two between<br />
20 th Avenue and FEC railroad.<br />
As demonstrated in this report, the existing and forecast traffic volumes on the roadway network support<br />
the proposed lane reduction. Further, a qualitative assessment shows that the proposed lane reduction is<br />
not expected to have an adverse impact on evacuations. The draft concept plans and traffic analysis<br />
were submitted to the FDOT for review and comment. The study results were presented at a public<br />
workshop on November 15, 2012, and to the <strong>City</strong> <strong>of</strong> <strong>Vero</strong> <strong>Beach</strong>’s Planning and Zoning Board on<br />
December 20, 2012. Further, the proposed concepts will be presented to the following committees:<br />
Technical Advisory Committee and Citizens Advisory Committee - Indian River County MPO<br />
Governing Board - Indian River County MPO<br />
<strong>City</strong> <strong>of</strong> <strong>Vero</strong> <strong>Beach</strong> Council<br />
If the proposed lane reduction concept is approved by these stakeholders, the project sponsor will be<br />
required to submit a formal Lane Elimination Request to FDOT District Four. Further coordination will be<br />
required for identifying potential funding sources for project implementation.<br />
SR <strong>60</strong> “Twin Pairs” Traffic Calming Feasibility Study Page 25
Opinion <strong>of</strong> Probable Cost<br />
APPENDIX A
PROJECT: SR <strong>60</strong> TRAFFIC CALMING<br />
Wednesday, December 12, 2012<br />
OPINION OF PROBABLE CONSTRUCTION COSTS - CONCEPTUAL STRIPING<br />
"The Engineer has no control over the cost <strong>of</strong> labor, materials, equipment or services furnished by others, or over the Contractor's methods <strong>of</strong><br />
determining prices, or over competitive bidding or market conditions. Opinions <strong>of</strong> probable costs provided herein are based on the information known to<br />
the Engineer at this time and represent only the Engineer's judgment as a design pr<strong>of</strong>essional familiar with the construction industry. The Engineer<br />
cannot and does not guarantee that proposals, bids, or actual construction costs will not vary from its opinion <strong>of</strong> probable costs."<br />
PAY DESCRIPTION UNIT PROJECT UNIT PROJECT<br />
ITEM NO. QUANTITY PRICE COST<br />
ROADWAY<br />
101-1 MOBILIZATION LS 1 $ 50,000 $<br />
50,000<br />
102-1 MAINTENANCE OF TRAFFIC LS 1 $ 50,000 $<br />
50,000<br />
104-10-3 EROSION CONTROL LS 1 $ 15,000.00 $<br />
15,000<br />
PROFESSIONAL ENGINEERING LS 1 $ 50,000 $<br />
50,000<br />
CONSTRUCTION ENGINEERING AND INSPECTION LS 1 $ 50,000 $<br />
50,000<br />
108-1 AS-BUILTS LS 1 $ 10,000 $<br />
10,000<br />
327-70-6 MILLING EXISTING ASPHALT PAVEMENT 1 1/2" AVG DEPTH SY 29,255 $ 2.25 $<br />
65,824<br />
334-1-13 SUPERPAVE ASPHALTIC CONCRETE (TRAFFIC C) 9.5 TN 2,415 $ 110.00 $<br />
265,650<br />
SIGNING AND MARKING<br />
700-20-11 SINGLE POST SIGN (F&I) (
PROJECT: SR <strong>60</strong> TRAFFIC CALMING<br />
Wednesday, December 12, 2012<br />
OPINION OF PROBABLE CONSTRUCTION COSTS - CONCEPTUAL STRIPING WITH STAMPED ASPHALT<br />
"The Engineer has no control over the cost <strong>of</strong> labor, materials, equipment or services furnished by others, or over the Contractor's methods <strong>of</strong><br />
determining prices, or over competitive bidding or market conditions. Opinions <strong>of</strong> probable costs provided herein are based on the information known to<br />
the Engineer at this time and represent only the Engineer's judgment as a design pr<strong>of</strong>essional familiar with the construction industry. The Engineer<br />
cannot and does not guarantee that proposals, bids, or actual construction costs will not vary from its opinion <strong>of</strong> probable costs."<br />
PAY DESCRIPTION UNIT PROJECT UNIT PROJECT<br />
ITEM NO. QUANTITY PRICE COST<br />
ROADWAY<br />
101-1 MOBILIZATION LS 1 $ 50,000 $<br />
50,000<br />
102-1 MAINTENANCE OF TRAFFIC LS 1 $ 50,000 $<br />
50,000<br />
104-10-3 EROSION CONTROL LS 1 $ 15,000 $<br />
15,000<br />
PROFESSIONAL ENGINEERING LS 1 $ 65,000 $<br />
65,000<br />
CONSTRUCTION ENGINEERING AND INSPECTION LS 1 $ 50,000 $<br />
50,000<br />
108-1 AS-BUILTS LS 1 $ 10,000 $<br />
10,000<br />
327-70-6 MILLING EXISTING ASPHALT PAVEMENT 1 1/2" AVG DEPTH SY 29,255 $ 2.25 $<br />
65,824<br />
334-1-13 SUPERPAVE ASPHALTIC CONCRETE (TRAFFIC C) 9.5 TN 2,415 $ 110.00 $<br />
265,650<br />
523-1 PATTERNED PAVEMENT (COLOR) (PARKING AREAS) SY 2,475 $ 70.00 $<br />
173,250<br />
SIGNING AND MARKING<br />
700-20-11 SINGLE POST SIGN (F&I) (
PROJECT: SR <strong>60</strong> TRAFFIC CALMING<br />
Wednesday, December 12, 2012<br />
OPINION OF PROBABLE CONSTRUCTION COSTS - CONCEPTUAL KNUCKLES<br />
"The Engineer has no control over the cost <strong>of</strong> labor, materials, equipment or services furnished by others, or over the Contractor's methods <strong>of</strong><br />
determining prices, or over competitive bidding or market conditions. Opinions <strong>of</strong> probable costs provided herein are based on the information known to<br />
the Engineer at this time and represent only the Engineer's judgment as a design pr<strong>of</strong>essional familiar with the construction industry. The Engineer<br />
cannot and does not guarantee that proposals, bids, or actual construction costs will not vary from its opinion <strong>of</strong> probable costs."<br />
PAY DESCRIPTION UNIT PROJECT UNIT PROJECT<br />
ITEM NO. QUANTITY PRICE COST<br />
ROADWAY<br />
101-1 MOBILIZATION LS 1 $ 50,000 $<br />
50,000<br />
102-1 MAINTENANCE OF TRAFFIC LS 1 $ 50,000 $<br />
50,000<br />
104-10-3 EROSION CONTROL LS 1 $ 15,000.00 $<br />
15,000<br />
PROFESSIONAL ENGINEERING LS 1 $ 90,000 $<br />
90,000<br />
CONSTRUCTION ENGINEERING AND INSPECTION LS 1 $ 75,000 $<br />
75,000<br />
108-1 AS-BUILTS LS 1 $ 10,000 $<br />
10,000<br />
327-70-6 MILLING EXISTING ASPHALT PAVEMENT 1 1/2" AVG DEPTH SY 29,255 $ 2.25 $<br />
65,824<br />
334-1-13 SUPERPAVE ASPHALTIC CONCRETE (TRAFFIC C) 9.5 TN 2,415 $ 110.00 $<br />
265,650<br />
523-1 PATTERNED PAVEMENT (COLOR) (PARKING AREAS) SY 2,475 $ 70.00 $<br />
173,250<br />
KNUCKLEING AT 6 INTERSECTIONS LS 1 $ 135,000 $<br />
135,000<br />
SIGNING AND MARKING<br />
700-20-11 SINGLE POST SIGN (F&I) (
SYNCHRO Analysis – Existing Conditions<br />
APPENDIX B
HCM Signalized Intersection Capacity Analysis<br />
1: 20 Avenue SB & SR <strong>60</strong> EB<br />
11/13/2012<br />
Movement EBL EBT EBR WBL WBT WBR NBL NBT NBR SBL SBT SBR<br />
Lane Configurations<br />
Volume (vph) 0 690 59 0 0 0 0 0 0 22 135 0<br />
Ideal Flow (vphpl) 1900 1900 1900 1900 1900 1900 1900 1900 1900 1900 1900 1900<br />
Lane Width 12 11 12 12 12 12 12 12 12 12 12 12<br />
Total Lost time (s) 4.3 4.0<br />
Lane Util. Factor 0.91 0.95<br />
Frt 0.99 1.00<br />
Flt Protected 1.00 0.99<br />
Satd. Flow (prot) 4374 3168<br />
Flt Permitted 1.00 0.99<br />
Satd. Flow (perm) 4374 3168<br />
Peak-hour factor, PHF 1.00 0.71 0.75 1.00 1.00 1.00 1.00 1.00 1.00 0.75 0.58 1.00<br />
Adj. Flow (vph) 0 972 79 0 0 0 0 0 0 29 233 0<br />
RTOR Reduction (vph) 0 6 0 0 0 0 0 0 0 0 61 0<br />
Lane Group Flow (vph) 0 1045 0 0 0 0 0 0 0 0 201 0<br />
Turn Type NA Split NA<br />
Protected Phases 2 3 3<br />
Permitted Phases<br />
Actuated Green, G (s) 65.3 15.6<br />
Effective Green, g (s) 66.3 16.6<br />
Actuated g/C Ratio 0.55 0.14<br />
Clearance Time (s) 5.3 5.0<br />
Vehicle Extension (s) 3.0 3.0<br />
Lane Grp Cap (vph) 2416 438<br />
v/s Ratio Prot c0.24 c0.06<br />
v/s Ratio Perm<br />
v/c Ratio 0.43 0.46<br />
Uniform Delay, d1 15.8 47.6<br />
Progression Factor 1.00 0.13<br />
Incremental Delay, d2 0.6 0.7<br />
Delay (s) 16.4 7.0<br />
Level <strong>of</strong> Service B A<br />
Approach Delay (s) 16.4 0.0 0.0 7.0<br />
Approach LOS B A A A<br />
Intersection Summary<br />
HCM 2000 Control Delay 14.5 HCM 2000 Level <strong>of</strong> Service B<br />
HCM 2000 Volume to Capacity ratio 0.34<br />
Actuated Cycle Length (s) 120.0 Sum <strong>of</strong> lost time (s) 14.8<br />
Intersection Capacity Utilization 28.1% ICU Level <strong>of</strong> Service A<br />
Analysis Period (min) 15<br />
c Critical Lane Group<br />
PM Peak 5:00 pm 11/9/2012 2012 Existing Conditions Synchro 8 Report<br />
Page 1
HCM Signalized Intersection Capacity Analysis<br />
2: 20 Avenue NB & SR <strong>60</strong> EB<br />
11/13/2012<br />
Movement EBL EBT EBR WBL WBT WBR NBL NBT NBR SBL SBT SBR<br />
Lane Configurations<br />
Volume (vph) 7 705 0 0 0 0 0 135 41 0 0 0<br />
Ideal Flow (vphpl) 1900 1900 1900 1900 1900 1900 1900 1900 1900 1900 1900 1900<br />
Lane Width 12 11 12 12 12 12 12 12 12 12 12 12<br />
Total Lost time (s) 4.3 4.3 4.5<br />
Lane Util. Factor 1.00 0.91 0.95<br />
Frt 1.00 1.00 0.97<br />
Flt Protected 0.95 1.00 1.00<br />
Satd. Flow (prot) 1593 4424 3078<br />
Flt Permitted 0.95 1.00 1.00<br />
Satd. Flow (perm) 1593 4424 3078<br />
Peak-hour factor, PHF 0.58 0.84 1.00 1.00 1.00 1.00 1.00 0.71 0.75 1.00 1.00 1.00<br />
Adj. Flow (vph) 12 839 0 0 0 0 0 190 55 0 0 0<br />
RTOR Reduction (vph) 3 0 0 0 0 0 0 23 0 0 0 0<br />
Lane Group Flow (vph) 9 839 0 0 0 0 0 222 0 0 0 0<br />
Turn Type Split NA NA<br />
Protected Phases 2 3 2 3 4<br />
Permitted Phases<br />
Actuated Green, G (s) 86.2 86.2 23.3<br />
Effective Green, g (s) 87.2 87.2 24.3<br />
Actuated g/C Ratio 0.73 0.73 0.20<br />
Clearance Time (s) 5.5<br />
Vehicle Extension (s) 3.0<br />
Lane Grp Cap (vph) 1157 3214 623<br />
v/s Ratio Prot 0.01 c0.19 c0.07<br />
v/s Ratio Perm<br />
v/c Ratio 0.01 0.26 0.36<br />
Uniform Delay, d1 4.5 5.5 41.1<br />
Progression Factor 0.00 0.02 1.00<br />
Incremental Delay, d2 0.0 0.0 0.4<br />
Delay (s) 0.0 0.1 41.5<br />
Level <strong>of</strong> Service A A D<br />
Approach Delay (s) 0.1 0.0 41.5 0.0<br />
Approach LOS A A D A<br />
Intersection Summary<br />
HCM 2000 Control Delay 9.4 HCM 2000 Level <strong>of</strong> Service A<br />
HCM 2000 Volume to Capacity ratio 0.30<br />
Actuated Cycle Length (s) 120.0 Sum <strong>of</strong> lost time (s) 14.3<br />
Intersection Capacity Utilization 47.9% ICU Level <strong>of</strong> Service A<br />
Analysis Period (min) 15<br />
c Critical Lane Group<br />
PM Peak 5:00 pm 11/9/2012 2012 Existing Conditions Synchro 8 Report<br />
Page 2
HCM Signalized Intersection Capacity Analysis<br />
3: 20 Avenue SB & SR <strong>60</strong> WB<br />
11/13/2012<br />
Movement EBL EBT EBR WBL WBT WBR NBL NBT NBR SBL SBT SBR<br />
Lane Configurations<br />
Volume (vph) 0 0 0 38 981 0 0 0 0 0 119 52<br />
Ideal Flow (vphpl) 1900 1900 1900 1900 1900 1900 1900 1900 1900 1900 1900 1900<br />
Total Lost time (s) 4.0 3.0<br />
Lane Util. Factor 0.91 0.95<br />
Frt 1.00 0.96<br />
Flt Protected 1.00 1.00<br />
Satd. Flow (prot) 4568 3068<br />
Flt Permitted 1.00 1.00<br />
Satd. Flow (perm) 4568 3068<br />
Peak-hour factor, PHF 1.00 1.00 1.00 0.71 0.74 1.00 1.00 1.00 1.00 1.00 0.58 0.78<br />
Adj. Flow (vph) 0 0 0 54 1326 0 0 0 0 0 205 67<br />
RTOR Reduction (vph) 0 0 0 0 4 0 0 0 0 0 30 0<br />
Lane Group Flow (vph) 0 0 0 0 1376 0 0 0 0 0 242 0<br />
Turn Type Prot NA NA<br />
Protected Phases 4! 4 6! 7!<br />
Permitted Phases<br />
Actuated Green, G (s) 88.6 14.7<br />
Effective Green, g (s) 91.6 15.7<br />
Actuated g/C Ratio 0.76 0.13<br />
Clearance Time (s) 4.0<br />
Vehicle Extension (s) 3.0<br />
Lane Grp Cap (vph) 3639 401<br />
v/s Ratio Prot c0.08 c0.08<br />
v/s Ratio Perm 0.22<br />
v/c Ratio 0.38 0.<strong>60</strong><br />
Uniform Delay, d1 4.7 49.2<br />
Progression Factor 2.<strong>60</strong> 1.00<br />
Incremental Delay, d2 0.1 2.5<br />
Delay (s) 12.3 51.8<br />
Level <strong>of</strong> Service B D<br />
Approach Delay (s) 0.0 12.3 0.0 51.8<br />
Approach LOS A B A D<br />
Intersection Summary<br />
HCM 2000 Control Delay 18.8 HCM 2000 Level <strong>of</strong> Service B<br />
HCM 2000 Volume to Capacity ratio 0.43<br />
Actuated Cycle Length (s) 120.0 Sum <strong>of</strong> lost time (s) 14.3<br />
Intersection Capacity Utilization 34.1% ICU Level <strong>of</strong> Service A<br />
Analysis Period (min) 15<br />
! Phase conflict between lane groups.<br />
c Critical Lane Group<br />
PM Peak 5:00 pm 11/9/2012 2012 Existing Conditions Synchro 8 Report<br />
Page 3
HCM Signalized Intersection Capacity Analysis<br />
4: 20 Avenue NB & SR <strong>60</strong> WB<br />
11/13/2012<br />
Movement EBL EBT EBR WBL WBT WBR NBL NBT NBR SBL SBT SBR<br />
Lane Configurations<br />
Volume (vph) 0 0 0 0 966 45 53 89 0 0 0 0<br />
Ideal Flow (vphpl) 1900 1900 1900 1900 1900 1900 1900 1900 1900 1900 1900 1900<br />
Total Lost time (s) 3.8 3.8 4.0<br />
Lane Util. Factor 0.91 1.00 0.95<br />
Frt 1.00 0.85 1.00<br />
Flt Protected 1.00 1.00 0.98<br />
Satd. Flow (prot) 4577 1425 3133<br />
Flt Permitted 1.00 1.00 0.98<br />
Satd. Flow (perm) 4577 1425 3133<br />
Peak-hour factor, PHF 1.00 1.00 1.00 1.00 0.73 0.76 0.85 0.71 1.00 1.00 1.00 1.00<br />
Adj. Flow (vph) 0 0 0 0 1323 59 62 125 0 0 0 0<br />
RTOR Reduction (vph) 0 0 0 0 0 26 0 51 0 0 0 0<br />
Lane Group Flow (vph) 0 0 0 0 1323 33 0 136 0 0 0 0<br />
Turn Type NA Perm Split NA<br />
Protected Phases 6 8 8<br />
Permitted Phases 6<br />
Actuated Green, G (s) 65.3 65.3 25.7<br />
Effective Green, g (s) 66.8 66.8 26.7<br />
Actuated g/C Ratio 0.56 0.56 0.22<br />
Clearance Time (s) 5.3 5.3 5.0<br />
Vehicle Extension (s) 3.0 3.0 3.0<br />
Lane Grp Cap (vph) 2547 793 697<br />
v/s Ratio Prot c0.29 c0.04<br />
v/s Ratio Perm 0.02<br />
v/c Ratio 0.52 0.04 0.19<br />
Uniform Delay, d1 16.6 12.1 37.9<br />
Progression Factor 1.22 2.21 0.04<br />
Incremental Delay, d2 0.7 0.1 0.1<br />
Delay (s) 21.0 26.8 1.6<br />
Level <strong>of</strong> Service C C A<br />
Approach Delay (s) 0.0 21.3 1.6 0.0<br />
Approach LOS A C A A<br />
Intersection Summary<br />
HCM 2000 Control Delay 18.9 HCM 2000 Level <strong>of</strong> Service B<br />
HCM 2000 Volume to Capacity ratio 0.38<br />
Actuated Cycle Length (s) 120.0 Sum <strong>of</strong> lost time (s) 15.8<br />
Intersection Capacity Utilization 31.8% ICU Level <strong>of</strong> Service A<br />
Analysis Period (min) 15<br />
c Critical Lane Group<br />
PM Peak 5:00 pm 11/9/2012 2012 Existing Conditions Synchro 8 Report<br />
Page 4
HCM Signalized Intersection Capacity Analysis<br />
5: 14 Avenue & SR <strong>60</strong> EB<br />
11/13/2012<br />
Movement EBL EBT EBR WBL WBT WBR NBL NBT NBR SBL SBT SBR<br />
Lane Configurations<br />
Volume (vph) 47 578 43 0 0 0 0 164 34 40 249 0<br />
Ideal Flow (vphpl) 1900 1900 1900 1900 1900 1900 1900 1900 1900 1900 1900 1900<br />
Lane Width 12 11 12 12 12 12 12 12 12 12 12 12<br />
Total Lost time (s) 4.2 4.1 4.1 3.6 4.1<br />
Lane Util. Factor 0.91 1.00 1.00 1.00 1.00<br />
Frpb, ped/bikes 1.00 1.00 0.98 1.00 1.00<br />
Flpb, ped/bikes 1.00 1.00 1.00 1.00 1.00<br />
Frt 0.99 1.00 0.85 1.00 1.00<br />
Flt Protected 1.00 1.00 1.00 0.95 1.00<br />
Satd. Flow (prot) 4347 1676 1400 1590 1676<br />
Flt Permitted 1.00 1.00 1.00 0.44 1.00<br />
Satd. Flow (perm) 4347 1676 1400 738 1676<br />
Peak-hour factor, PHF 0.64 0.78 0.71 1.00 1.00 1.00 1.00 0.86 0.72 0.57 0.79 1.00<br />
Adj. Flow (vph) 73 741 61 0 0 0 0 191 47 70 315 0<br />
RTOR Reduction (vph) 0 12 0 0 0 0 0 0 37 0 0 0<br />
Lane Group Flow (vph) 0 863 0 0 0 0 0 191 10 70 315 0<br />
Confl. Peds. (#/hr) 5 5 5 5<br />
Turn Type Perm NA NA Perm pm+pt NA<br />
Protected Phases 2 8 7 4<br />
Permitted Phases 2 8 4<br />
Actuated Green, G (s) 27.0 11.9 11.9 22.7 22.7<br />
Effective Green, g (s) 28.0 12.9 12.9 23.7 23.7<br />
Actuated g/C Ratio 0.47 0.22 0.22 0.39 0.39<br />
Clearance Time (s) 5.2 5.1 5.1 4.6 5.1<br />
Vehicle Extension (s) 3.0 3.0 3.0 3.0 3.0<br />
Lane Grp Cap (vph) 2028 3<strong>60</strong> 301 393 662<br />
v/s Ratio Prot 0.11 0.02 c0.19<br />
v/s Ratio Perm 0.20 0.01 0.05<br />
v/c Ratio 0.43 0.53 0.03 0.18 0.48<br />
Uniform Delay, d1 10.6 20.9 18.6 11.7 13.5<br />
Progression Factor 0.92 1.00 1.00 1.61 1.41<br />
Incremental Delay, d2 0.6 1.5 0.0 0.2 0.4<br />
Delay (s) 10.5 22.4 18.7 19.0 19.4<br />
Level <strong>of</strong> Service B C B B B<br />
Approach Delay (s) 10.5 0.0 21.6 19.3<br />
Approach LOS B A C B<br />
Intersection Summary<br />
HCM 2000 Control Delay 14.5 HCM 2000 Level <strong>of</strong> Service B<br />
HCM 2000 Volume to Capacity ratio 0.48<br />
Actuated Cycle Length (s) <strong>60</strong>.0 Sum <strong>of</strong> lost time (s) 11.9<br />
Intersection Capacity Utilization 54.4% ICU Level <strong>of</strong> Service A<br />
Analysis Period (min) 15<br />
c Critical Lane Group<br />
PM Peak 5:00 pm 11/9/2012 2012 Existing Conditions Synchro 8 Report<br />
Page 5
HCM Signalized Intersection Capacity Analysis<br />
6: 14 Avenue & SR <strong>60</strong> WB<br />
11/13/2012<br />
Movement EBL EBT EBR WBL WBT WBR NBL NBT NBR SBL SBT SBR<br />
Lane Configurations<br />
Volume (vph) 0 0 0 47 764 29 70 153 0 0 301 76<br />
Ideal Flow (vphpl) 1900 1900 1900 1900 1900 1900 1900 1900 1900 1900 1900 1900<br />
Lane Width 12 12 12 11 11 12 12 12 12 12 12 12<br />
Total Lost time (s) 4.1 4.1 4.0 4.0 4.0<br />
Lane Util. Factor 1.00 0.91 1.00 1.00 1.00<br />
Frpb, ped/bikes 1.00 1.00 1.00 1.00 1.00<br />
Flpb, ped/bikes 0.99 1.00 1.00 1.00 1.00<br />
Frt 1.00 0.99 1.00 1.00 0.97<br />
Flt Protected 0.95 1.00 0.95 1.00 1.00<br />
Satd. Flow (prot) 1526 4392 1592 1676 1618<br />
Flt Permitted 0.95 1.00 0.20 1.00 1.00<br />
Satd. Flow (perm) 1526 4392 337 1676 1618<br />
Peak-hour factor, PHF 1.00 1.00 1.00 0.71 0.84 0.75 0.80 0.72 1.00 1.00 0.86 0.72<br />
Adj. Flow (vph) 0 0 0 66 910 39 88 212 0 0 350 106<br />
RTOR Reduction (vph) 0 0 0 0 7 0 0 0 0 0 19 0<br />
Lane Group Flow (vph) 0 0 0 66 942 0 88 212 0 0 437 0<br />
Confl. Peds. (#/hr) 5 5 5 5<br />
Turn Type Perm NA pm+pt NA NA<br />
Protected Phases 6 3 8 4<br />
Permitted Phases 6 8<br />
Actuated Green, G (s) 21.2 21.2 28.2 28.2 18.5<br />
Effective Green, g (s) 22.7 22.7 28.7 29.2 19.5<br />
Actuated g/C Ratio 0.38 0.38 0.48 0.49 0.32<br />
Clearance Time (s) 5.6 5.6 4.5 5.0 5.0<br />
Vehicle Extension (s) 3.0 3.0 3.0 3.0 3.0<br />
Lane Grp Cap (vph) 577 1661 280 815 525<br />
v/s Ratio Prot c0.21 c0.03 0.13 c0.27<br />
v/s Ratio Perm 0.04 0.12<br />
v/c Ratio 0.11 0.57 0.31 0.26 0.83<br />
Uniform Delay, d1 12.1 14.8 10.4 9.1 18.7<br />
Progression Factor 1.00 1.11 1.13 0.91 1.00<br />
Incremental Delay, d2 0.4 1.3 0.6 0.2 10.8<br />
Delay (s) 12.5 17.7 12.4 8.4 29.6<br />
Level <strong>of</strong> Service B B B A C<br />
Approach Delay (s) 0.0 17.3 9.5 29.6<br />
Approach LOS A B A C<br />
Intersection Summary<br />
HCM 2000 Control Delay 19.2 HCM 2000 Level <strong>of</strong> Service B<br />
HCM 2000 Volume to Capacity ratio 0.65<br />
Actuated Cycle Length (s) <strong>60</strong>.0 Sum <strong>of</strong> lost time (s) 12.1<br />
Intersection Capacity Utilization 54.4% ICU Level <strong>of</strong> Service A<br />
Analysis Period (min) 15<br />
c Critical Lane Group<br />
PM Peak 5:00 pm 11/9/2012 2012 Existing Conditions Synchro 8 Report<br />
Page 6
HCM Signalized Intersection Capacity Analysis<br />
7: Commerce Ave & SR <strong>60</strong> EB<br />
11/13/2012<br />
Movement EBL EBT EBR WBL WBT WBR NBL NBT NBR SBL SBT SBR<br />
Lane Configurations<br />
Volume (vph) 28 956 25 0 0 0 0 16 13 24 23 0<br />
Ideal Flow (vphpl) 1900 1900 1900 1900 1900 1900 1900 1900 1900 1900 1900 1900<br />
Lane Width 12 11 12 12 12 12 12 12 12 12 12 12<br />
Total Lost time (s) 4.1 4.0 4.0 4.0<br />
Lane Util. Factor 0.91 1.00 1.00 1.00<br />
Frt 1.00 0.94 1.00 1.00<br />
Flt Protected 1.00 1.00 0.95 1.00<br />
Satd. Flow (prot) 4395 1571 1593 1676<br />
Flt Permitted 1.00 1.00 0.73 1.00<br />
Satd. Flow (perm) 4395 1571 1222 1676<br />
Peak-hour factor, PHF 0.65 0.89 0.70 1.00 1.00 1.00 1.00 0.70 0.65 0.66 0.65 1.00<br />
Adj. Flow (vph) 43 1074 36 0 0 0 0 23 20 36 35 0<br />
RTOR Reduction (vph) 0 4 0 0 0 0 0 18 0 0 0 0<br />
Lane Group Flow (vph) 0 1149 0 0 0 0 0 25 0 36 35 0<br />
Turn Type Perm NA NA Perm NA<br />
Protected Phases 2 8 4<br />
Permitted Phases 2 4<br />
Actuated Green, G (s) 44.8 5.1 5.1 5.1<br />
Effective Green, g (s) 45.8 6.1 6.1 6.1<br />
Actuated g/C Ratio 0.76 0.10 0.10 0.10<br />
Clearance Time (s) 5.1 5.0 5.0 5.0<br />
Vehicle Extension (s) 3.0 3.0 3.0 3.0<br />
Lane Grp Cap (vph) 3354 159 124 170<br />
v/s Ratio Prot 0.02 0.02<br />
v/s Ratio Perm 0.26 c0.03<br />
v/c Ratio 0.34 0.16 0.29 0.21<br />
Uniform Delay, d1 2.3 24.6 24.9 24.7<br />
Progression Factor 0.42 1.00 0.79 0.79<br />
Incremental Delay, d2 0.3 0.5 1.3 0.6<br />
Delay (s) 1.2 25.1 21.0 20.0<br />
Level <strong>of</strong> Service A C C C<br />
Approach Delay (s) 1.2 0.0 25.1 20.5<br />
Approach LOS A A C C<br />
Intersection Summary<br />
HCM 2000 Control Delay 3.1 HCM 2000 Level <strong>of</strong> Service A<br />
HCM 2000 Volume to Capacity ratio 0.34<br />
Actuated Cycle Length (s) <strong>60</strong>.0 Sum <strong>of</strong> lost time (s) 8.1<br />
Intersection Capacity Utilization 41.9% ICU Level <strong>of</strong> Service A<br />
Analysis Period (min) 15<br />
c Critical Lane Group<br />
PM Peak 5:00 pm 11/9/2012 2012 Existing Conditions Synchro 8 Report<br />
Page 7
HCM Signalized Intersection Capacity Analysis<br />
8: Commerce Ave & SR <strong>60</strong> WB<br />
11/13/2012<br />
Movement EBL EBT EBR WBL WBT WBR NBL NBT NBR SBL SBT SBR<br />
Lane Configurations<br />
Volume (vph) 0 0 0 34 1140 3 40 31 0 0 28 40<br />
Ideal Flow (vphpl) 1900 1900 1900 1900 1900 1900 1900 1900 1900 1900 1900 1900<br />
Lane Width 12 12 12 12 11 12 12 12 12 12 12 12<br />
Total Lost time (s) 3.9 4.0 4.0 4.0<br />
Lane Util. Factor 0.86 1.00 1.00 1.00<br />
Frt 1.00 1.00 1.00 0.93<br />
Flt Protected 1.00 0.95 1.00 1.00<br />
Satd. Flow (prot) 5558 1593 1676 1567<br />
Flt Permitted 1.00 0.69 1.00 1.00<br />
Satd. Flow (perm) 5558 1164 1676 1567<br />
Peak-hour factor, PHF 1.00 1.00 1.00 0.51 0.79 0.37 0.79 0.68 1.00 1.00 0.56 0.86<br />
Adj. Flow (vph) 0 0 0 67 1443 8 51 46 0 0 50 47<br />
RTOR Reduction (vph) 0 0 0 0 1 0 0 0 0 0 41 0<br />
Lane Group Flow (vph) 0 0 0 0 1517 0 51 46 0 0 56 0<br />
Turn Type Perm NA Perm NA NA<br />
Protected Phases 6 8 4<br />
Permitted Phases 6 8<br />
Actuated Green, G (s) 42.5 7.1 7.1 7.1<br />
Effective Green, g (s) 44.0 8.1 8.1 8.1<br />
Actuated g/C Ratio 0.73 0.13 0.13 0.13<br />
Clearance Time (s) 5.4 5.0 5.0 5.0<br />
Vehicle Extension (s) 3.0 3.0 3.0 3.0<br />
Lane Grp Cap (vph) 4075 157 226 211<br />
v/s Ratio Prot 0.03 0.04<br />
v/s Ratio Perm 0.27 c0.04<br />
v/c Ratio 0.37 0.32 0.20 0.27<br />
Uniform Delay, d1 2.9 23.5 23.1 23.3<br />
Progression Factor 1.31 1.16 1.16 1.00<br />
Incremental Delay, d2 0.3 1.2 0.4 0.7<br />
Delay (s) 4.1 28.5 27.2 24.0<br />
Level <strong>of</strong> Service A C C C<br />
Approach Delay (s) 0.0 4.1 27.9 24.0<br />
Approach LOS A A C C<br />
Intersection Summary<br />
HCM 2000 Control Delay 6.6 HCM 2000 Level <strong>of</strong> Service A<br />
HCM 2000 Volume to Capacity ratio 0.36<br />
Actuated Cycle Length (s) <strong>60</strong>.0 Sum <strong>of</strong> lost time (s) 7.9<br />
Intersection Capacity Utilization 41.9% ICU Level <strong>of</strong> Service A<br />
Analysis Period (min) 15<br />
c Critical Lane Group<br />
PM Peak 5:00 pm 11/9/2012 2012 Existing Conditions Synchro 8 Report<br />
Page 8
HCM Signalized Intersection Capacity Analysis<br />
9: SR <strong>60</strong> WB & 11 Avenue<br />
11/13/2012<br />
Movement EBL EBT EBR WBL WBT WBR NBL NBT NBR SBL SBT SBR<br />
Lane Configurations<br />
Volume (vph) 0 0 0 15 748 46 19 97 0 0 34 35<br />
Ideal Flow (vphpl) 1900 1900 1900 1900 1900 1900 1900 1900 1900 1900 1900 1900<br />
Lane Width 12 12 12 12 11 12 12 12 12 12 12 12<br />
Total Lost time (s) 3.9 4.0 4.2 4.2 4.2<br />
Lane Util. Factor 0.86 1.00 1.00 1.00 1.00<br />
Frt 0.99 1.00 1.00 1.00 0.85<br />
Flt Protected 1.00 0.95 1.00 1.00 1.00<br />
Satd. Flow (prot) 6124 1770 1863 1863 1583<br />
Flt Permitted 1.00 0.50 1.00 1.00 1.00<br />
Satd. Flow (perm) 6124 925 1863 1863 1583<br />
Peak-hour factor, PHF 1.00 1.00 1.00 0.70 0.87 0.71 0.75 0.73 1.00 1.00 0.92 0.92<br />
Adj. Flow (vph) 0 0 0 21 8<strong>60</strong> 65 25 133 0 0 37 38<br />
RTOR Reduction (vph) 0 0 0 0 13 0 0 0 0 0 0 33<br />
Lane Group Flow (vph) 0 0 0 0 933 0 25 133 0 0 37 5<br />
Turn Type Perm NA pm+pt NA NA Perm<br />
Protected Phases 6 3 8 4<br />
Permitted Phases 6 8 4<br />
Actuated Green, G (s) 35.6 13.8 13.8 7.4 7.4<br />
Effective Green, g (s) 37.1 14.8 14.8 8.4 8.4<br />
Actuated g/C Ratio 0.62 0.25 0.25 0.14 0.14<br />
Clearance Time (s) 5.4 5.0 5.2 5.2 5.2<br />
Vehicle Extension (s) 3.0 3.0 3.0 3.0 3.0<br />
Lane Grp Cap (vph) 3786 261 459 2<strong>60</strong> 221<br />
v/s Ratio Prot 0.00 c0.07 0.02<br />
v/s Ratio Perm 0.15 0.02 0.00<br />
v/c Ratio 0.25 0.10 0.29 0.14 0.02<br />
Uniform Delay, d1 5.2 17.4 18.3 22.6 22.3<br />
Progression Factor 0.89 1.03 1.01 1.00 1.00<br />
Incremental Delay, d2 0.2 0.2 0.4 0.3 0.0<br />
Delay (s) 4.8 18.1 18.9 22.9 22.3<br />
Level <strong>of</strong> Service A B B C C<br />
Approach Delay (s) 0.0 4.8 18.8 22.6<br />
Approach LOS A A B C<br />
Intersection Summary<br />
HCM 2000 Control Delay 7.8 HCM 2000 Level <strong>of</strong> Service A<br />
HCM 2000 Volume to Capacity ratio 0.28<br />
Actuated Cycle Length (s) <strong>60</strong>.0 Sum <strong>of</strong> lost time (s) 12.1<br />
Intersection Capacity Utilization 34.7% ICU Level <strong>of</strong> Service A<br />
Analysis Period (min) 15<br />
c Critical Lane Group<br />
PM Peak 5:00 pm 11/9/2012 2012 Existing Conditions Synchro 8 Report<br />
Page 9
HCM Signalized Intersection Capacity Analysis<br />
10: 10 Avenue & SR <strong>60</strong> WB<br />
11/13/2012<br />
Movement EBL EBT EBR WBL WBT WBR NBL NBT NBR SBL SBT SBR<br />
Lane Configurations<br />
Volume (vph) 0 0 0 12 594 19 80 96 0 0 94 55<br />
Ideal Flow (vphpl) 1900 1900 1900 1900 1900 1900 1900 1900 1900 1900 1900 1900<br />
Lane Width 12 12 12 12 11 12 12 12 12 12 12 12<br />
Total Lost time (s) 3.9 4.2 4.2 4.2<br />
Lane Util. Factor 0.86 1.00 1.00 1.00<br />
Frt 1.00 1.00 1.00 0.95<br />
Flt Protected 1.00 0.95 1.00 1.00<br />
Satd. Flow (prot) 6161 1770 1863 1771<br />
Flt Permitted 1.00 0.55 1.00 1.00<br />
Satd. Flow (perm) 6161 1017 1863 1771<br />
Peak-hour factor, PHF 1.00 1.00 1.00 0.68 0.81 0.85 0.76 0.81 1.00 1.00 0.76 0.78<br />
Adj. Flow (vph) 0 0 0 18 733 22 105 119 0 0 124 71<br />
RTOR Reduction (vph) 0 0 0 0 4 0 0 0 0 0 43 0<br />
Lane Group Flow (vph) 0 0 0 0 769 0 105 119 0 0 152 0<br />
Turn Type Perm NA Perm NA NA<br />
Protected Phases 6 8 4<br />
Permitted Phases 6 8<br />
Actuated Green, G (s) 38.6 10.8 10.8 10.8<br />
Effective Green, g (s) 40.1 11.8 11.8 11.8<br />
Actuated g/C Ratio 0.67 0.20 0.20 0.20<br />
Clearance Time (s) 5.4 5.2 5.2 5.2<br />
Vehicle Extension (s) 3.0 3.0 3.0 3.0<br />
Lane Grp Cap (vph) 4117 200 366 348<br />
v/s Ratio Prot 0.06 0.09<br />
v/s Ratio Perm 0.12 c0.10<br />
v/c Ratio 0.19 0.53 0.33 0.44<br />
Uniform Delay, d1 3.8 21.6 20.7 21.2<br />
Progression Factor 1.00 0.89 0.88 1.00<br />
Incremental Delay, d2 0.1 2.4 0.5 0.9<br />
Delay (s) 3.9 21.6 18.7 22.1<br />
Level <strong>of</strong> Service A C B C<br />
Approach Delay (s) 0.0 3.9 20.1 22.1<br />
Approach LOS A A C C<br />
Intersection Summary<br />
HCM 2000 Control Delay 9.9 HCM 2000 Level <strong>of</strong> Service A<br />
HCM 2000 Volume to Capacity ratio 0.26<br />
Actuated Cycle Length (s) <strong>60</strong>.0 Sum <strong>of</strong> lost time (s) 8.1<br />
Intersection Capacity Utilization 33.3% ICU Level <strong>of</strong> Service A<br />
Analysis Period (min) 15<br />
c Critical Lane Group<br />
PM Peak 5:00 pm 11/9/2012 2012 Existing Conditions Synchro 8 Report<br />
Page 10
HCM Signalized Intersection Capacity Analysis<br />
11: 10 Avenue & SR <strong>60</strong> EB<br />
11/13/2012<br />
Movement EBL EBT EBR WBL WBT WBR NBL NBT NBR SBL SBT SBR<br />
Lane Configurations<br />
Volume (vph) 41 591 40 0 0 0 0 114 14 10 63 0<br />
Ideal Flow (vphpl) 1900 1900 1900 1900 1900 1900 1900 1900 1900 1900 1900 1900<br />
Lane Width 12 11 12 12 12 12 12 12 12 12 12 12<br />
Total Lost time (s) 3.9 4.0 4.0 4.0<br />
Lane Util. Factor 0.91 1.00 1.00 1.00<br />
Frt 0.99 0.98 1.00 1.00<br />
Flt Protected 1.00 1.00 0.95 1.00<br />
Satd. Flow (prot) 4856 1833 1770 1863<br />
Flt Permitted 1.00 1.00 0.42 1.00<br />
Satd. Flow (perm) 4856 1833 777 1863<br />
Peak-hour factor, PHF 0.84 0.79 0.75 1.00 1.00 1.00 1.00 0.69 0.65 0.56 0.83 1.00<br />
Adj. Flow (vph) 49 748 53 0 0 0 0 165 22 18 76 0<br />
RTOR Reduction (vph) 0 8 0 0 0 0 0 9 0 0 0 0<br />
Lane Group Flow (vph) 0 842 0 0 0 0 0 178 0 18 76 0<br />
Turn Type Perm NA NA pm+pt NA<br />
Protected Phases 2 8 7 4<br />
Permitted Phases 2 4<br />
Actuated Green, G (s) 32.2 11.0 17.4 17.4<br />
Effective Green, g (s) 33.7 12.0 18.4 18.4<br />
Actuated g/C Ratio 0.56 0.20 0.31 0.31<br />
Clearance Time (s) 5.4 5.0 5.0 5.0<br />
Vehicle Extension (s) 3.0 3.0 3.0 3.0<br />
Lane Grp Cap (vph) 2727 366 278 571<br />
v/s Ratio Prot c0.10 0.00 c0.04<br />
v/s Ratio Perm 0.17 0.02<br />
v/c Ratio 0.31 0.49 0.06 0.13<br />
Uniform Delay, d1 7.0 21.3 14.8 15.0<br />
Progression Factor 0.68 1.00 1.48 1.35<br />
Incremental Delay, d2 0.3 1.0 0.1 0.1<br />
Delay (s) 5.1 22.3 22.1 20.5<br />
Level <strong>of</strong> Service A C C C<br />
Approach Delay (s) 5.1 0.0 22.3 20.8<br />
Approach LOS A A C C<br />
Intersection Summary<br />
HCM 2000 Control Delay 9.2 HCM 2000 Level <strong>of</strong> Service A<br />
HCM 2000 Volume to Capacity ratio 0.35<br />
Actuated Cycle Length (s) <strong>60</strong>.0 Sum <strong>of</strong> lost time (s) 11.9<br />
Intersection Capacity Utilization 33.3% ICU Level <strong>of</strong> Service A<br />
Analysis Period (min) 15<br />
c Critical Lane Group<br />
PM Peak 5:00 pm 11/9/2012 2012 Existing Conditions Synchro 8 Report<br />
Page 11
GTCRPM Model Output<br />
APPENDIX C
Licensed to Kimley-Horn and Associates, Inc.<br />
11/6/2012<br />
MODEL DAILY VOLUMES<br />
2005 GTCRPM MODEL RUN<br />
1800<br />
6100<br />
00<br />
5000<br />
5000<br />
4900<br />
4900<br />
0<br />
0<br />
15500<br />
15500<br />
7000<br />
7000<br />
6700<br />
6700<br />
0<br />
0<br />
8200<br />
8200<br />
4400<br />
4400<br />
200<br />
200<br />
4500<br />
4500<br />
2100<br />
2100<br />
1700<br />
1700<br />
5200<br />
5200<br />
5000<br />
5000<br />
9500<br />
9500<br />
0<br />
0<br />
10000<br />
10000<br />
1300<br />
1300<br />
4300<br />
4300<br />
9900<br />
9900<br />
0<br />
0<br />
5200<br />
5200<br />
0<br />
0<br />
300<br />
300<br />
1100<br />
1100<br />
1500<br />
1500<br />
900<br />
900<br />
2<strong>60</strong>0<br />
2<strong>60</strong>0<br />
0<br />
0<br />
1000<br />
1000<br />
0<br />
0<br />
1300<br />
1300<br />
2100<br />
2100<br />
4200<br />
4200<br />
8800<br />
8800<br />
100<br />
100<br />
800<br />
800<br />
200<br />
200<br />
5700<br />
5700<br />
100<br />
100<br />
900<br />
900<br />
1400<br />
1400<br />
300<br />
300<br />
1<strong>60</strong>0<br />
1<strong>60</strong>0<br />
0<br />
0<br />
<strong>60</strong>0<br />
<strong>60</strong>0<br />
7800<br />
7800<br />
10400<br />
10400<br />
0<br />
4200<br />
4200<br />
36900<br />
36900<br />
6300<br />
6300<br />
12000<br />
12000<br />
12000<br />
12000<br />
10700<br />
10700<br />
11100<br />
11100<br />
11100<br />
11100<br />
14500<br />
14500<br />
11700<br />
11700<br />
3500<br />
3500<br />
10300<br />
10300<br />
34300<br />
34300<br />
9300<br />
9300<br />
9300<br />
9300<br />
10300<br />
10300<br />
7100<br />
7100<br />
4100<br />
4100<br />
4700<br />
4700<br />
7100<br />
7100<br />
34000<br />
34000<br />
4700<br />
4700<br />
7100<br />
7100<br />
0<br />
0<br />
4700<br />
4700<br />
700<br />
700<br />
0<br />
0<br />
700<br />
700<br />
800<br />
80010700<br />
10700<br />
3300<br />
3300<br />
3500<br />
3500<br />
0<br />
0<br />
2100<br />
2100<br />
11<strong>60</strong>0<br />
11<strong>60</strong>0<br />
8700<br />
8700<br />
3300<br />
3300<br />
7400<br />
7400<br />
15800<br />
13300<br />
11<strong>60</strong>0<br />
11<strong>60</strong>0<br />
7400<br />
7400<br />
28000<br />
28000<br />
30700<br />
30700<br />
14400<br />
14400<br />
30700<br />
30700<br />
3300<br />
3300<br />
10<strong>60</strong>0<br />
10<strong>60</strong>0<br />
30700<br />
30700<br />
10000<br />
10000<br />
15300<br />
10800<br />
10800<br />
14<strong>60</strong>0<br />
3500<br />
3500<br />
27300<br />
27300<br />
13300<br />
12100<br />
12100<br />
10400<br />
10400<br />
7200<br />
7200<br />
6<strong>60</strong>0<br />
6<strong>60</strong>0<br />
17800<br />
17800<br />
20900<br />
20900<br />
2400<br />
2400<br />
5000<br />
5000<br />
3000<br />
3000<br />
14<strong>60</strong>0<br />
14400<br />
14400<br />
21000<br />
21000<br />
200<br />
200<br />
8700<br />
8700<br />
8100<br />
8100<br />
3000<br />
3000<br />
0<br />
0<br />
18700<br />
18700<br />
10800<br />
0<br />
0<br />
<strong>60</strong>00<br />
<strong>60</strong>00<br />
8800<br />
8800<br />
5800<br />
5800<br />
<strong>60</strong>00<br />
<strong>60</strong>00<br />
4<strong>60</strong>0<br />
4<strong>60</strong>0<br />
11700<br />
11700<br />
14100<br />
14100<br />
6800<br />
6800<br />
16300<br />
10800<br />
9800<br />
9800<br />
5200<br />
5200<br />
3100<br />
3100<br />
15700 7800<br />
7800<br />
5100<br />
5100<br />
11200<br />
11200<br />
17500<br />
17500<br />
11400<br />
9800<br />
9800<br />
13300<br />
13300<br />
8800<br />
8800<br />
3900<br />
3900<br />
5200<br />
5200<br />
4700<br />
4700<br />
15800<br />
15800<br />
2500<br />
2500<br />
13300<br />
13300<br />
3900<br />
3900<br />
26400<br />
26400<br />
2500<br />
2500<br />
26400<br />
26400<br />
20<strong>60</strong>0<br />
20<strong>60</strong>0<br />
23100<br />
23100<br />
5700<br />
12200<br />
26800<br />
26800<br />
11700<br />
11700<br />
5200<br />
5200<br />
8700<br />
8700<br />
3500<br />
3500<br />
2500<br />
2500<br />
6100<br />
2200<br />
2200<br />
3900<br />
5400<br />
5400<br />
4800<br />
4800<br />
6200<br />
6200<br />
3900<br />
8900<br />
8900<br />
35900<br />
35900<br />
37700<br />
37700<br />
8700<br />
8700<br />
4700<br />
4700<br />
25000<br />
25000<br />
18700<br />
18700<br />
0<br />
0<br />
22400<br />
22400<br />
27000<br />
27000<br />
23300<br />
23300<br />
22800<br />
22800<br />
15800<br />
10000<br />
5<strong>60</strong>0<br />
5<strong>60</strong>0<br />
5200<br />
5200<br />
5200<br />
5200<br />
8700<br />
8700<br />
4700<br />
4700<br />
4700<br />
4700<br />
3500<br />
3500<br />
3500<br />
3500<br />
3500<br />
3500
Licensed to Kimley-Horn and Associates, Inc.<br />
11/8/2012<br />
MODEL DAILY VOLUMES<br />
-- WITHOUT SR <strong>60</strong> LANE REDUCTIONS --<br />
2035 GTCRPM MODEL RUN<br />
24700<br />
700<br />
4700<br />
4700<br />
<strong>60</strong>00<br />
<strong>60</strong>00<br />
0<br />
0<br />
15700<br />
15700<br />
10400<br />
10400<br />
1700<br />
1700<br />
300<br />
300<br />
10500<br />
10500<br />
3400<br />
3400<br />
700<br />
700<br />
6200<br />
6200<br />
4300<br />
4300<br />
2100<br />
2100<br />
8900<br />
8900<br />
12500<br />
12500<br />
9800<br />
9800<br />
0<br />
0<br />
11400<br />
11400<br />
1000<br />
1000<br />
4000<br />
4000<br />
10000<br />
10000<br />
100<br />
100<br />
4<strong>60</strong>0<br />
4<strong>60</strong>0<br />
300<br />
300<br />
400<br />
400 1500<br />
1500<br />
1000<br />
1000<br />
2000<br />
2000<br />
4800<br />
4800<br />
0<br />
0<br />
1700<br />
1700<br />
0<br />
0<br />
1900<br />
1900<br />
500<br />
5700<br />
5700<br />
7800<br />
7800<br />
2900<br />
2900<br />
3<strong>60</strong>0<br />
3<strong>60</strong>0<br />
<strong>60</strong>0<br />
<strong>60</strong>0<br />
4900<br />
4900<br />
100<br />
100<br />
2100<br />
2100<br />
2300<br />
2300<br />
300<br />
300<br />
1400<br />
1400<br />
0<br />
500<br />
500<br />
9000<br />
9000<br />
12000<br />
12000<br />
0<br />
14700<br />
14700<br />
42300<br />
42300<br />
12800<br />
12800<br />
13200<br />
13200<br />
13200<br />
13200<br />
10700<br />
10700<br />
11200<br />
11200<br />
11200<br />
11200<br />
15400<br />
15400<br />
9300<br />
9300<br />
18100<br />
18100<br />
6700<br />
6700<br />
10400<br />
10400<br />
41400<br />
41400<br />
9400<br />
9400<br />
9400<br />
9400<br />
10400<br />
10400<br />
1<strong>60</strong>0<br />
1<strong>60</strong>0<br />
6500<br />
6500<br />
7700<br />
7700<br />
1900<br />
1900<br />
9300<br />
9300<br />
41000<br />
41000<br />
7900<br />
7900<br />
10<strong>60</strong>0<br />
10<strong>60</strong>0<br />
0<br />
0<br />
7700<br />
7700<br />
3000<br />
3000<br />
0<br />
0<br />
3000<br />
3000<br />
2700<br />
270013000<br />
13000<br />
<strong>60</strong>00<br />
<strong>60</strong>00<br />
6100<br />
6100<br />
0<br />
0<br />
2000<br />
2000<br />
13200<br />
13200<br />
10900<br />
10900<br />
7300<br />
7300<br />
7500<br />
7500<br />
18700<br />
17200<br />
13200<br />
13200<br />
8100<br />
8100<br />
48300<br />
48300<br />
7300<br />
7300<br />
30200<br />
30200<br />
8500<br />
8500<br />
7800<br />
7800<br />
8700<br />
8700<br />
30200<br />
30200<br />
12300<br />
12300<br />
30200<br />
30200<br />
10800<br />
10800<br />
12300<br />
12300<br />
17000<br />
26300<br />
26300<br />
3900<br />
3900<br />
17200<br />
12200<br />
12200<br />
11300<br />
11300<br />
8<strong>60</strong>0<br />
8<strong>60</strong>0<br />
7700<br />
7700<br />
14400<br />
14400<br />
18700<br />
18700<br />
2200<br />
2200<br />
8100<br />
8100<br />
2200<br />
2200<br />
16200<br />
18200<br />
18200<br />
400<br />
400<br />
11<strong>60</strong>0<br />
11<strong>60</strong>0<br />
12300<br />
12300<br />
2200<br />
2200<br />
700<br />
700<br />
19500<br />
19500<br />
13300<br />
700<br />
700<br />
5000<br />
5000<br />
11300<br />
11300<br />
5000<br />
5000<br />
2700<br />
2700<br />
12800<br />
12800<br />
17100<br />
17100<br />
6900<br />
6900<br />
18700<br />
13300<br />
11500<br />
11500<br />
11200<br />
11200<br />
6800<br />
6800<br />
19200 9800<br />
9800<br />
7500<br />
7500<br />
9500<br />
9500<br />
16800<br />
16800<br />
12000<br />
20300<br />
20300<br />
16900<br />
16900<br />
7400<br />
7400<br />
4000<br />
4000<br />
6300<br />
6300<br />
14700<br />
14700<br />
2<strong>60</strong>0<br />
2<strong>60</strong>0<br />
12100<br />
12100<br />
7400<br />
7400<br />
26300<br />
26300<br />
2<strong>60</strong>0<br />
2<strong>60</strong>0<br />
26300<br />
26300<br />
21500<br />
21500<br />
21700<br />
21700<br />
4800<br />
14000<br />
28800<br />
28800<br />
25100<br />
25100<br />
4000<br />
4000<br />
9700<br />
9700<br />
5700<br />
5700<br />
2<strong>60</strong>0<br />
2<strong>60</strong>0<br />
5700<br />
2<strong>60</strong>0<br />
2<strong>60</strong>0<br />
3100<br />
7900<br />
7900<br />
3300<br />
3300<br />
22<strong>60</strong>0<br />
22<strong>60</strong>0<br />
9000<br />
9000<br />
3100<br />
4900<br />
4900<br />
55000<br />
55000<br />
56300<br />
56300<br />
9700<br />
9700<br />
6300<br />
6300<br />
40800<br />
40800<br />
30<strong>60</strong>0<br />
30<strong>60</strong>0<br />
0<br />
0<br />
31900<br />
31900<br />
38100<br />
38100<br />
34700<br />
34700<br />
31300<br />
31300<br />
18800<br />
9900<br />
9700<br />
9700<br />
6300<br />
6300<br />
6300<br />
6300<br />
3900<br />
3900<br />
5700<br />
5700<br />
5700<br />
5700<br />
8700<br />
8700
Licensed to Kimley-Horn and Associates, Inc.<br />
11/6/2012<br />
MODEL DAILY VOLUMES<br />
-- WITH SR <strong>60</strong> LANE REDUCTIONS BETWEEN 20TH AVENUE & COMMERCE AVENUE --<br />
2035 GTCRPM MODEL RUN<br />
4400<br />
24700<br />
24700<br />
4700<br />
4700<br />
<strong>60</strong>00<br />
<strong>60</strong>00<br />
0<br />
0<br />
15800<br />
15800<br />
10200<br />
10200<br />
1700<br />
1700<br />
400<br />
400<br />
10400<br />
10400<br />
3400<br />
3400<br />
700<br />
700<br />
6200<br />
6200<br />
4400<br />
4400<br />
2100<br />
2100<br />
9000<br />
9000<br />
12400<br />
12400<br />
9900<br />
9900<br />
0<br />
0<br />
11300<br />
11300<br />
1000<br />
1000<br />
4000<br />
4000<br />
10100<br />
10100<br />
0<br />
0<br />
4500<br />
4500<br />
300<br />
300<br />
400<br />
400 1500<br />
1500<br />
1000<br />
1000<br />
2000<br />
2000<br />
4800<br />
4800<br />
0<br />
0<br />
1<strong>60</strong>0<br />
1<strong>60</strong>0<br />
0<br />
0<br />
1900<br />
1900<br />
500<br />
500<br />
5700<br />
5700<br />
8100<br />
8100<br />
2<strong>60</strong>0<br />
2<strong>60</strong>0<br />
3<strong>60</strong>0<br />
3<strong>60</strong>0<br />
<strong>60</strong>0<br />
<strong>60</strong>0<br />
4900<br />
4900<br />
100<br />
100<br />
1900<br />
1900<br />
2400<br />
2400<br />
300<br />
300<br />
1400<br />
1400<br />
0<br />
0<br />
500<br />
500<br />
9200<br />
9200<br />
11900<br />
11900<br />
800<br />
00<br />
0<br />
0 14700<br />
14700<br />
42100<br />
42100<br />
12700<br />
12700<br />
13300<br />
13300<br />
13300<br />
13300<br />
10<strong>60</strong>0<br />
10<strong>60</strong>0<br />
11200<br />
11200<br />
11200<br />
11200<br />
15800<br />
15800<br />
9000<br />
9000<br />
18200<br />
18200<br />
6700<br />
6700<br />
10300<br />
10300<br />
40900<br />
40900<br />
9<strong>60</strong>0<br />
9<strong>60</strong>0<br />
9<strong>60</strong>0<br />
9<strong>60</strong>0<br />
10300<br />
10300<br />
1800<br />
1800<br />
6700<br />
6700<br />
7700<br />
7700<br />
2100<br />
2100<br />
9000<br />
9000<br />
40500<br />
40500<br />
8000<br />
8000<br />
10<strong>60</strong>0<br />
10<strong>60</strong>0<br />
0<br />
0<br />
7700<br />
7700<br />
2900<br />
2900<br />
0<br />
0<br />
2900<br />
2900<br />
2<strong>60</strong>0<br />
2<strong>60</strong>013200<br />
13200<br />
5<strong>60</strong>0<br />
5<strong>60</strong>0<br />
6100<br />
6100<br />
0<br />
0<br />
1900<br />
1900<br />
13500<br />
13500<br />
10300<br />
10300<br />
8400<br />
8400<br />
7400<br />
7400<br />
18100<br />
15700<br />
13500<br />
13500<br />
8200<br />
8200<br />
48300<br />
48300<br />
8400<br />
8400<br />
30200<br />
30200<br />
8700<br />
8700<br />
7700<br />
7700<br />
8<strong>60</strong>0<br />
8<strong>60</strong>0<br />
30200<br />
30200<br />
12500<br />
12500<br />
30200<br />
30200<br />
11000<br />
11000<br />
12200<br />
12200<br />
16<strong>60</strong>0<br />
26300<br />
26300<br />
3900<br />
3900<br />
15700<br />
12100<br />
12100<br />
11200<br />
11200<br />
8400<br />
8400<br />
7800<br />
7800<br />
14300<br />
14300<br />
18<strong>60</strong>0<br />
18<strong>60</strong>0<br />
2100<br />
2100<br />
9200<br />
9200<br />
2300<br />
2300<br />
15800<br />
18500<br />
18500<br />
400<br />
400<br />
11<strong>60</strong>0<br />
11<strong>60</strong>0<br />
12300<br />
12300<br />
2300<br />
2300<br />
800<br />
800<br />
20100<br />
20100<br />
12700<br />
800<br />
800<br />
5200<br />
5200<br />
11<strong>60</strong>0<br />
11<strong>60</strong>0<br />
5200<br />
5200<br />
2900<br />
2900<br />
13100<br />
13100<br />
17300<br />
17300<br />
6700<br />
6700<br />
18200<br />
12700<br />
11500<br />
11500<br />
11<strong>60</strong>0<br />
11<strong>60</strong>0<br />
7200<br />
7200<br />
19100 9900<br />
9900<br />
7700<br />
7700<br />
9500<br />
9500<br />
16900<br />
16900<br />
11<strong>60</strong>0<br />
20<strong>60</strong>0<br />
20<strong>60</strong>0<br />
17300<br />
17300<br />
7700<br />
7700<br />
4000<br />
4000<br />
6300<br />
6300<br />
14700<br />
14700<br />
2<strong>60</strong>0<br />
2<strong>60</strong>0<br />
12100<br />
12100<br />
7700<br />
7700<br />
26400<br />
26400<br />
2<strong>60</strong>0<br />
2<strong>60</strong>0<br />
26400<br />
26400<br />
21700<br />
21700<br />
21<strong>60</strong>0<br />
21<strong>60</strong>0<br />
4800<br />
14000<br />
28700<br />
28700<br />
25100<br />
25100<br />
4000<br />
4000<br />
9<strong>60</strong>0<br />
9<strong>60</strong>0<br />
5<strong>60</strong>0<br />
5<strong>60</strong>0<br />
2<strong>60</strong>0<br />
2<strong>60</strong>0<br />
5<strong>60</strong>0<br />
2<strong>60</strong>0<br />
2<strong>60</strong>0<br />
3000<br />
7800<br />
7800<br />
3300<br />
3300<br />
22700<br />
22700<br />
9000<br />
9000<br />
3000<br />
4800<br />
4800<br />
55000<br />
55000<br />
56300<br />
56300<br />
9<strong>60</strong>0<br />
9<strong>60</strong>0<br />
6300<br />
6300<br />
40700<br />
40700<br />
30500<br />
30500<br />
0<br />
0<br />
31700<br />
31700<br />
37900<br />
37900<br />
34400<br />
34400<br />
31300<br />
31300<br />
18200<br />
9400<br />
9<strong>60</strong>0<br />
9<strong>60</strong>0<br />
6300<br />
6300<br />
6300<br />
6300<br />
3900<br />
3900<br />
5<strong>60</strong>0<br />
5<strong>60</strong>0<br />
5<strong>60</strong>0<br />
5<strong>60</strong>0<br />
8<strong>60</strong>0<br />
8<strong>60</strong>0
SYNCHRO Analysis – 2035 Conditions<br />
APPENDIX D
No Build Conditions
HCM Signalized Intersection Capacity Analysis<br />
1: 20 Avenue SB & SR <strong>60</strong> EB<br />
11/13/2012<br />
Movement EBL EBT EBR WBL WBT WBR NBL NBT NBR SBL SBT SBR<br />
Lane Configurations<br />
Volume (vph) 0 792 68 0 0 0 0 0 0 28 170 0<br />
Ideal Flow (vphpl) 1900 1900 1900 1900 1900 1900 1900 1900 1900 1900 1900 1900<br />
Lane Width 12 11 12 12 12 12 12 12 12 12 12 12<br />
Total Lost time (s) 4.3 4.0<br />
Lane Util. Factor 0.91 0.95<br />
Frt 0.99 1.00<br />
Flt Protected 1.00 0.99<br />
Satd. Flow (prot) 4374 3168<br />
Flt Permitted 1.00 0.99<br />
Satd. Flow (perm) 4374 3168<br />
Peak-hour factor, PHF 1.00 0.71 0.75 1.00 1.00 1.00 1.00 1.00 1.00 0.75 0.58 1.00<br />
Adj. Flow (vph) 0 1115 91 0 0 0 0 0 0 37 293 0<br />
RTOR Reduction (vph) 0 7 0 0 0 0 0 0 0 0 59 0<br />
Lane Group Flow (vph) 0 1199 0 0 0 0 0 0 0 0 271 0<br />
Turn Type NA Split NA<br />
Protected Phases 2 3 3<br />
Permitted Phases<br />
Actuated Green, G (s) 58.0 19.3<br />
Effective Green, g (s) 59.0 20.3<br />
Actuated g/C Ratio 0.49 0.17<br />
Clearance Time (s) 5.3 5.0<br />
Vehicle Extension (s) 3.0 3.0<br />
Lane Grp Cap (vph) 2150 535<br />
v/s Ratio Prot c0.27 c0.09<br />
v/s Ratio Perm<br />
v/c Ratio 0.56 0.51<br />
Uniform Delay, d1 21.4 45.3<br />
Progression Factor 1.00 0.14<br />
Incremental Delay, d2 1.0 0.7<br />
Delay (s) 22.4 7.1<br />
Level <strong>of</strong> Service C A<br />
Approach Delay (s) 22.4 0.0 0.0 7.1<br />
Approach LOS C A A A<br />
Intersection Summary<br />
HCM 2000 Control Delay 19.1 HCM 2000 Level <strong>of</strong> Service B<br />
HCM 2000 Volume to Capacity ratio 0.40<br />
Actuated Cycle Length (s) 120.0 Sum <strong>of</strong> lost time (s) 14.8<br />
Intersection Capacity Utilization 31.8% ICU Level <strong>of</strong> Service A<br />
Analysis Period (min) 15<br />
c Critical Lane Group<br />
PM Peak 5:00 pm 11/7/2012 2035 no-build conditions Synchro 8 Report<br />
Page 1
HCM Signalized Intersection Capacity Analysis<br />
2: 20 Avenue NB & SR <strong>60</strong> EB<br />
11/13/2012<br />
Movement EBL EBT EBR WBL WBT WBR NBL NBT NBR SBL SBT SBR<br />
Lane Configurations<br />
Volume (vph) 8 809 0 0 0 0 0 170 52 0 0 0<br />
Ideal Flow (vphpl) 1900 1900 1900 1900 1900 1900 1900 1900 1900 1900 1900 1900<br />
Lane Width 12 11 12 12 12 12 12 12 12 12 12 12<br />
Total Lost time (s) 4.3 4.3 4.5<br />
Lane Util. Factor 1.00 0.91 0.95<br />
Frt 1.00 1.00 0.97<br />
Flt Protected 0.95 1.00 1.00<br />
Satd. Flow (prot) 1593 4424 3078<br />
Flt Permitted 0.95 1.00 1.00<br />
Satd. Flow (perm) 1593 4424 3078<br />
Peak-hour factor, PHF 0.58 0.84 1.00 1.00 1.00 1.00 1.00 0.71 0.75 1.00 1.00 1.00<br />
Adj. Flow (vph) 14 963 0 0 0 0 0 239 69 0 0 0<br />
RTOR Reduction (vph) 4 0 0 0 0 0 0 22 0 0 0 0<br />
Lane Group Flow (vph) 10 963 0 0 0 0 0 286 0 0 0 0<br />
Turn Type Split NA NA<br />
Protected Phases 2 3 2 3 4<br />
Permitted Phases<br />
Actuated Green, G (s) 82.6 82.6 26.9<br />
Effective Green, g (s) 83.6 83.6 27.9<br />
Actuated g/C Ratio 0.70 0.70 0.23<br />
Clearance Time (s) 5.5<br />
Vehicle Extension (s) 3.0<br />
Lane Grp Cap (vph) 1109 3082 715<br />
v/s Ratio Prot 0.01 c0.22 c0.09<br />
v/s Ratio Perm<br />
v/c Ratio 0.01 0.31 0.40<br />
Uniform Delay, d1 5.6 7.1 39.0<br />
Progression Factor 0.00 0.01 1.00<br />
Incremental Delay, d2 0.0 0.0 0.4<br />
Delay (s) 0.0 0.2 39.3<br />
Level <strong>of</strong> Service A A D<br />
Approach Delay (s) 0.1 0.0 39.3 0.0<br />
Approach LOS A A D A<br />
Intersection Summary<br />
HCM 2000 Control Delay 9.5 HCM 2000 Level <strong>of</strong> Service A<br />
HCM 2000 Volume to Capacity ratio 0.35<br />
Actuated Cycle Length (s) 120.0 Sum <strong>of</strong> lost time (s) 14.3<br />
Intersection Capacity Utilization 55.2% ICU Level <strong>of</strong> Service B<br />
Analysis Period (min) 15<br />
c Critical Lane Group<br />
PM Peak 5:00 pm 11/7/2012 2035 no-build conditions Synchro 8 Report<br />
Page 2
HCM Signalized Intersection Capacity Analysis<br />
3: 20 Avenue SB & SR <strong>60</strong> WB<br />
11/13/2012<br />
Movement EBL EBT EBR WBL WBT WBR NBL NBT NBR SBL SBT SBR<br />
Lane Configurations<br />
Volume (vph) 0 0 0 44 1126 0 0 0 0 0 150 65<br />
Ideal Flow (vphpl) 1900 1900 1900 1900 1900 1900 1900 1900 1900 1900 1900 1900<br />
Total Lost time (s) 4.0 3.0<br />
Lane Util. Factor 0.91 0.95<br />
Frt 1.00 0.96<br />
Flt Protected 1.00 1.00<br />
Satd. Flow (prot) 4568 3069<br />
Flt Permitted 1.00 1.00<br />
Satd. Flow (perm) 4568 3069<br />
Peak-hour factor, PHF 1.00 1.00 1.00 0.71 0.74 1.00 1.00 1.00 1.00 1.00 0.58 0.78<br />
Adj. Flow (vph) 0 0 0 62 1522 0 0 0 0 0 259 83<br />
RTOR Reduction (vph) 0 0 0 0 5 0 0 0 0 0 29 0<br />
Lane Group Flow (vph) 0 0 0 0 1579 0 0 0 0 0 313 0<br />
Turn Type Prot NA NA<br />
Protected Phases 4! 4 6! 7!<br />
Permitted Phases<br />
Actuated Green, G (s) 84.9 17.4<br />
Effective Green, g (s) 87.9 18.4<br />
Actuated g/C Ratio 0.73 0.15<br />
Clearance Time (s) 4.0<br />
Vehicle Extension (s) 3.0<br />
Lane Grp Cap (vph) 3498 470<br />
v/s Ratio Prot c0.11 c0.10<br />
v/s Ratio Perm 0.24<br />
v/c Ratio 0.45 0.67<br />
Uniform Delay, d1 6.4 47.9<br />
Progression Factor 2.86 1.00<br />
Incremental Delay, d2 0.1 3.6<br />
Delay (s) 18.4 51.5<br />
Level <strong>of</strong> Service B D<br />
Approach Delay (s) 0.0 18.4 0.0 51.5<br />
Approach LOS A B A D<br />
Intersection Summary<br />
HCM 2000 Control Delay 24.3 HCM 2000 Level <strong>of</strong> Service C<br />
HCM 2000 Volume to Capacity ratio 0.51<br />
Actuated Cycle Length (s) 120.0 Sum <strong>of</strong> lost time (s) 14.3<br />
Intersection Capacity Utilization 38.7% ICU Level <strong>of</strong> Service A<br />
Analysis Period (min) 15<br />
! Phase conflict between lane groups.<br />
c Critical Lane Group<br />
PM Peak 5:00 pm 11/7/2012 2035 no-build conditions Synchro 8 Report<br />
Page 3
HCM Signalized Intersection Capacity Analysis<br />
4: 20 Avenue NB & SR <strong>60</strong> WB<br />
11/13/2012<br />
Movement EBL EBT EBR WBL WBT WBR NBL NBT NBR SBL SBT SBR<br />
Lane Configurations<br />
Volume (vph) 0 0 0 0 1108 52 67 112 0 0 0 0<br />
Ideal Flow (vphpl) 1900 1900 1900 1900 1900 1900 1900 1900 1900 1900 1900 1900<br />
Total Lost time (s) 3.8 3.8 4.0<br />
Lane Util. Factor 0.91 1.00 0.95<br />
Frt 1.00 0.85 1.00<br />
Flt Protected 1.00 1.00 0.98<br />
Satd. Flow (prot) 4577 1425 3133<br />
Flt Permitted 1.00 1.00 0.98<br />
Satd. Flow (perm) 4577 1425 3133<br />
Peak-hour factor, PHF 1.00 1.00 1.00 1.00 0.73 0.76 0.85 0.71 1.00 1.00 1.00 1.00<br />
Adj. Flow (vph) 0 0 0 0 1518 68 79 158 0 0 0 0<br />
RTOR Reduction (vph) 0 0 0 0 0 34 0 50 0 0 0 0<br />
Lane Group Flow (vph) 0 0 0 0 1518 34 0 187 0 0 0 0<br />
Turn Type NA Perm Split NA<br />
Protected Phases 6 8 8<br />
Permitted Phases 6<br />
Actuated Green, G (s) 58.0 58.0 30.3<br />
Effective Green, g (s) 59.5 59.5 31.3<br />
Actuated g/C Ratio 0.50 0.50 0.26<br />
Clearance Time (s) 5.3 5.3 5.0<br />
Vehicle Extension (s) 3.0 3.0 3.0<br />
Lane Grp Cap (vph) 2269 706 817<br />
v/s Ratio Prot c0.33 c0.06<br />
v/s Ratio Perm 0.02<br />
v/c Ratio 0.67 0.05 0.23<br />
Uniform Delay, d1 22.8 15.6 34.9<br />
Progression Factor 1.22 1.90 0.04<br />
Incremental Delay, d2 1.3 0.1 0.1<br />
Delay (s) 29.1 29.8 1.6<br />
Level <strong>of</strong> Service C C A<br />
Approach Delay (s) 0.0 29.1 1.6 0.0<br />
Approach LOS A C A A<br />
Intersection Summary<br />
HCM 2000 Control Delay 25.5 HCM 2000 Level <strong>of</strong> Service C<br />
HCM 2000 Volume to Capacity ratio 0.45<br />
Actuated Cycle Length (s) 120.0 Sum <strong>of</strong> lost time (s) 15.8<br />
Intersection Capacity Utilization 36.1% ICU Level <strong>of</strong> Service A<br />
Analysis Period (min) 15<br />
c Critical Lane Group<br />
PM Peak 5:00 pm 11/7/2012 2035 no-build conditions Synchro 8 Report<br />
Page 4
HCM Signalized Intersection Capacity Analysis<br />
5: 14 Avenue & SR <strong>60</strong> EB<br />
11/13/2012<br />
Movement EBL EBT EBR WBL WBT WBR NBL NBT NBR SBL SBT SBR<br />
Lane Configurations<br />
Volume (vph) 54 663 49 0 0 0 0 206 43 50 313 0<br />
Ideal Flow (vphpl) 1900 1900 1900 1900 1900 1900 1900 1900 1900 1900 1900 1900<br />
Lane Width 12 11 12 12 12 12 12 12 12 12 12 12<br />
Total Lost time (s) 4.2 4.1 4.1 3.6 4.1<br />
Lane Util. Factor 0.91 1.00 1.00 1.00 1.00<br />
Frpb, ped/bikes 1.00 1.00 0.98 1.00 1.00<br />
Flpb, ped/bikes 1.00 1.00 1.00 1.00 1.00<br />
Frt 0.99 1.00 0.85 1.00 1.00<br />
Flt Protected 1.00 1.00 1.00 0.95 1.00<br />
Satd. Flow (prot) 4341 1676 1391 1589 1676<br />
Flt Permitted 1.00 1.00 1.00 0.38 1.00<br />
Satd. Flow (perm) 4341 1676 1391 642 1676<br />
Peak-hour factor, PHF 0.64 0.78 0.71 1.00 1.00 1.00 1.00 0.86 0.72 0.57 0.79 1.00<br />
Adj. Flow (vph) 84 850 69 0 0 0 0 240 <strong>60</strong> 88 396 0<br />
RTOR Reduction (vph) 0 13 0 0 0 0 0 0 46 0 0 0<br />
Lane Group Flow (vph) 0 990 0 0 0 0 0 240 14 88 396 0<br />
Confl. Peds. (#/hr) 10 10 10 10<br />
Turn Type Perm NA NA Perm pm+pt NA<br />
Protected Phases 2 8 7 4<br />
Permitted Phases 2 8 4<br />
Actuated Green, G (s) 25.8 13.1 13.1 23.9 23.9<br />
Effective Green, g (s) 26.8 14.1 14.1 24.9 24.9<br />
Actuated g/C Ratio 0.45 0.23 0.23 0.41 0.41<br />
Clearance Time (s) 5.2 5.1 5.1 4.6 5.1<br />
Vehicle Extension (s) 3.0 3.0 3.0 3.0 3.0<br />
Lane Grp Cap (vph) 1938 393 326 380 695<br />
v/s Ratio Prot 0.14 0.03 c0.24<br />
v/s Ratio Perm 0.23 0.01 0.07<br />
v/c Ratio 0.51 0.61 0.04 0.23 0.57<br />
Uniform Delay, d1 11.9 20.5 17.7 11.3 13.4<br />
Progression Factor 1.11 1.00 1.00 1.61 1.39<br />
Incremental Delay, d2 0.9 2.8 0.1 0.2 0.6<br />
Delay (s) 14.2 23.3 17.8 18.4 19.2<br />
Level <strong>of</strong> Service B C B B B<br />
Approach Delay (s) 14.2 0.0 22.2 19.1<br />
Approach LOS B A C B<br />
Intersection Summary<br />
HCM 2000 Control Delay 16.9 HCM 2000 Level <strong>of</strong> Service B<br />
HCM 2000 Volume to Capacity ratio 0.58<br />
Actuated Cycle Length (s) <strong>60</strong>.0 Sum <strong>of</strong> lost time (s) 11.9<br />
Intersection Capacity Utilization 64.8% ICU Level <strong>of</strong> Service C<br />
Analysis Period (min) 15<br />
c Critical Lane Group<br />
PM Peak 5:00 pm 11/7/2012 2035 no-build conditions Synchro 8 Report<br />
Page 5
HCM Signalized Intersection Capacity Analysis<br />
6: 14 Avenue & SR <strong>60</strong> WB<br />
11/13/2012<br />
Movement EBL EBT EBR WBL WBT WBR NBL NBT NBR SBL SBT SBR<br />
Lane Configurations<br />
Volume (vph) 0 0 0 54 877 33 88 192 0 0 378 96<br />
Ideal Flow (vphpl) 1900 1900 1900 1900 1900 1900 1900 1900 1900 1900 1900 1900<br />
Lane Width 12 12 12 11 11 12 12 12 12 12 12 12<br />
Total Lost time (s) 4.1 4.1 5.0 4.0 4.0<br />
Lane Util. Factor 1.00 0.91 1.00 1.00 1.00<br />
Frpb, ped/bikes 1.00 1.00 1.00 1.00 1.00<br />
Flpb, ped/bikes 0.98 1.00 1.00 1.00 1.00<br />
Frt 1.00 0.99 1.00 1.00 0.97<br />
Flt Protected 0.95 1.00 0.95 1.00 1.00<br />
Satd. Flow (prot) 1512 4391 1592 1676 1616<br />
Flt Permitted 0.95 1.00 0.16 1.00 1.00<br />
Satd. Flow (perm) 1512 4391 266 1676 1616<br />
Peak-hour factor, PHF 1.00 1.00 1.00 0.71 0.84 0.75 0.80 0.72 1.00 1.00 0.86 0.72<br />
Adj. Flow (vph) 0 0 0 76 1044 44 110 267 0 0 440 133<br />
RTOR Reduction (vph) 0 0 0 0 7 0 0 0 0 0 18 0<br />
Lane Group Flow (vph) 0 0 0 76 1081 0 110 267 0 0 555 0<br />
Confl. Peds. (#/hr) 10 10 10 10<br />
Turn Type Perm NA pm+pt NA NA<br />
Protected Phases 6 3 8 4<br />
Permitted Phases 6 8<br />
Actuated Green, G (s) 19.0 19.0 30.4 30.4 20.7<br />
Effective Green, g (s) 20.5 20.5 29.9 31.4 21.7<br />
Actuated g/C Ratio 0.34 0.34 0.50 0.52 0.36<br />
Clearance Time (s) 5.6 5.6 4.5 5.0 5.0<br />
Vehicle Extension (s) 3.0 3.0 3.0 3.0 3.0<br />
Lane Grp Cap (vph) 516 1500 236 877 584<br />
v/s Ratio Prot c0.25 c0.04 0.16 c0.34<br />
v/s Ratio Perm 0.05 0.20<br />
v/c Ratio 0.15 0.72 0.47 0.30 0.95<br />
Uniform Delay, d1 13.7 17.2 11.4 8.1 18.6<br />
Progression Factor 0.74 0.90 1.<strong>60</strong> 0.56 1.00<br />
Incremental Delay, d2 0.6 2.8 1.3 0.2 25.4<br />
Delay (s) 10.7 18.3 19.6 4.8 44.1<br />
Level <strong>of</strong> Service B B B A D<br />
Approach Delay (s) 0.0 17.8 9.1 44.1<br />
Approach LOS A B A D<br />
Intersection Summary<br />
HCM 2000 Control Delay 23.4 HCM 2000 Level <strong>of</strong> Service C<br />
HCM 2000 Volume to Capacity ratio 0.81<br />
Actuated Cycle Length (s) <strong>60</strong>.0 Sum <strong>of</strong> lost time (s) 13.1<br />
Intersection Capacity Utilization 64.8% ICU Level <strong>of</strong> Service C<br />
Analysis Period (min) 15<br />
c Critical Lane Group<br />
PM Peak 5:00 pm 11/7/2012 2035 no-build conditions Synchro 8 Report<br />
Page 6
HCM Signalized Intersection Capacity Analysis<br />
7: Commerce Ave & SR <strong>60</strong> EB<br />
11/13/2012<br />
Movement EBL EBT EBR WBL WBT WBR NBL NBT NBR SBL SBT SBR<br />
Lane Configurations<br />
Volume (vph) 32 1097 29 0 0 0 0 20 16 30 29 0<br />
Ideal Flow (vphpl) 1900 1900 1900 1900 1900 1900 1900 1900 1900 1900 1900 1900<br />
Lane Width 12 11 12 12 12 12 12 12 12 12 12 12<br />
Total Lost time (s) 4.1 4.0 4.0 4.0<br />
Lane Util. Factor 0.91 1.00 1.00 1.00<br />
Frt 1.00 0.94 1.00 1.00<br />
Flt Protected 1.00 1.00 0.95 1.00<br />
Satd. Flow (prot) 4396 1572 1593 1676<br />
Flt Permitted 1.00 1.00 0.72 1.00<br />
Satd. Flow (perm) 4396 1572 1210 1676<br />
Peak-hour factor, PHF 0.65 0.89 0.70 1.00 1.00 1.00 1.00 0.70 0.65 0.66 0.65 1.00<br />
Adj. Flow (vph) 49 1233 41 0 0 0 0 29 25 45 45 0<br />
RTOR Reduction (vph) 0 4 0 0 0 0 0 22 0 0 0 0<br />
Lane Group Flow (vph) 0 1319 0 0 0 0 0 32 0 45 45 0<br />
Turn Type Perm NA NA Perm NA<br />
Protected Phases 2 8 4<br />
Permitted Phases 2 4<br />
Actuated Green, G (s) 44.4 5.5 5.5 5.5<br />
Effective Green, g (s) 45.4 6.5 6.5 6.5<br />
Actuated g/C Ratio 0.76 0.11 0.11 0.11<br />
Clearance Time (s) 5.1 5.0 5.0 5.0<br />
Vehicle Extension (s) 3.0 3.0 3.0 3.0<br />
Lane Grp Cap (vph) 3326 170 131 181<br />
v/s Ratio Prot 0.02 0.03<br />
v/s Ratio Perm 0.30 c0.04<br />
v/c Ratio 0.40 0.19 0.34 0.25<br />
Uniform Delay, d1 2.5 24.3 24.8 24.5<br />
Progression Factor 0.34 1.00 0.79 0.78<br />
Incremental Delay, d2 0.3 0.5 1.5 0.7<br />
Delay (s) 1.2 24.9 21.0 19.9<br />
Level <strong>of</strong> Service A C C B<br />
Approach Delay (s) 1.2 0.0 24.9 20.5<br />
Approach LOS A A C C<br />
Intersection Summary<br />
HCM 2000 Control Delay 3.3 HCM 2000 Level <strong>of</strong> Service A<br />
HCM 2000 Volume to Capacity ratio 0.39<br />
Actuated Cycle Length (s) <strong>60</strong>.0 Sum <strong>of</strong> lost time (s) 8.1<br />
Intersection Capacity Utilization 45.1% ICU Level <strong>of</strong> Service A<br />
Analysis Period (min) 15<br />
c Critical Lane Group<br />
PM Peak 5:00 pm 11/7/2012 2035 no-build conditions Synchro 8 Report<br />
Page 7
HCM Signalized Intersection Capacity Analysis<br />
8: Commerce Ave & SR <strong>60</strong> WB<br />
11/13/2012<br />
Movement EBL EBT EBR WBL WBT WBR NBL NBT NBR SBL SBT SBR<br />
Lane Configurations<br />
Volume (vph) 0 0 0 39 1308 3 50 39 0 0 35 50<br />
Ideal Flow (vphpl) 1900 1900 1900 1900 1900 1900 1900 1900 1900 1900 1900 1900<br />
Lane Width 12 12 12 12 11 12 12 12 12 12 12 12<br />
Total Lost time (s) 3.9 4.0 4.0 4.0<br />
Lane Util. Factor 0.86 1.00 1.00 1.00<br />
Frt 1.00 1.00 1.00 0.93<br />
Flt Protected 1.00 0.95 1.00 1.00<br />
Satd. Flow (prot) 5559 1593 1676 1567<br />
Flt Permitted 1.00 0.68 1.00 1.00<br />
Satd. Flow (perm) 5559 1140 1676 1567<br />
Peak-hour factor, PHF 1.00 1.00 1.00 0.51 0.79 0.37 0.79 0.68 1.00 1.00 0.56 0.86<br />
Adj. Flow (vph) 0 0 0 76 1656 8 63 57 0 0 62 58<br />
RTOR Reduction (vph) 0 0 0 0 1 0 0 0 0 0 27 0<br />
Lane Group Flow (vph) 0 0 0 0 1739 0 63 57 0 0 93 0<br />
Turn Type Perm NA Perm NA NA<br />
Protected Phases 6 8 4<br />
Permitted Phases 6 8<br />
Actuated Green, G (s) 41.8 7.8 7.8 7.8<br />
Effective Green, g (s) 43.3 8.8 8.8 8.8<br />
Actuated g/C Ratio 0.72 0.15 0.15 0.15<br />
Clearance Time (s) 5.4 5.0 5.0 5.0<br />
Vehicle Extension (s) 3.0 3.0 3.0 3.0<br />
Lane Grp Cap (vph) 4011 167 245 229<br />
v/s Ratio Prot 0.03 c0.06<br />
v/s Ratio Perm 0.31 0.06<br />
v/c Ratio 0.43 0.38 0.23 0.40<br />
Uniform Delay, d1 3.4 23.1 22.6 23.2<br />
Progression Factor 1.48 1.10 1.10 1.00<br />
Incremental Delay, d2 0.3 1.4 0.5 1.2<br />
Delay (s) 5.3 26.8 25.3 24.4<br />
Level <strong>of</strong> Service A C C C<br />
Approach Delay (s) 0.0 5.3 26.1 24.4<br />
Approach LOS A A C C<br />
Intersection Summary<br />
HCM 2000 Control Delay 7.8 HCM 2000 Level <strong>of</strong> Service A<br />
HCM 2000 Volume to Capacity ratio 0.43<br />
Actuated Cycle Length (s) <strong>60</strong>.0 Sum <strong>of</strong> lost time (s) 7.9<br />
Intersection Capacity Utilization 45.1% ICU Level <strong>of</strong> Service A<br />
Analysis Period (min) 15<br />
c Critical Lane Group<br />
PM Peak 5:00 pm 11/7/2012 2035 no-build conditions Synchro 8 Report<br />
Page 8
HCM Signalized Intersection Capacity Analysis<br />
9: SR <strong>60</strong> WB & 11 Avenue<br />
11/13/2012<br />
Movement EBL EBT EBR WBL WBT WBR NBL NBT NBR SBL SBT SBR<br />
Lane Configurations<br />
Volume (vph) 0 0 0 17 858 53 24 122 0 0 43 44<br />
Ideal Flow (vphpl) 1900 1900 1900 1900 1900 1900 1900 1900 1900 1900 1900 1900<br />
Lane Width 12 12 12 12 11 12 12 12 12 12 12 12<br />
Total Lost time (s) 3.9 4.0 4.2 4.2 4.2<br />
Lane Util. Factor 0.86 1.00 1.00 1.00 1.00<br />
Frt 0.99 1.00 1.00 1.00 0.85<br />
Flt Protected 1.00 0.95 1.00 1.00 1.00<br />
Satd. Flow (prot) 6123 1770 1863 1863 1583<br />
Flt Permitted 1.00 0.49 1.00 1.00 1.00<br />
Satd. Flow (perm) 6123 913 1863 1863 1583<br />
Peak-hour factor, PHF 1.00 1.00 1.00 0.70 0.87 0.71 0.75 0.73 1.00 1.00 0.92 0.92<br />
Adj. Flow (vph) 0 0 0 24 986 75 32 167 0 0 47 48<br />
RTOR Reduction (vph) 0 0 0 0 13 0 0 0 0 0 0 41<br />
Lane Group Flow (vph) 0 0 0 0 1072 0 32 167 0 0 47 7<br />
Turn Type Perm NA pm+pt NA NA Perm<br />
Protected Phases 6 3 8 4<br />
Permitted Phases 6 8 4<br />
Actuated Green, G (s) 34.3 15.1 15.1 7.3 7.3<br />
Effective Green, g (s) 35.8 16.1 16.1 8.3 8.3<br />
Actuated g/C Ratio 0.<strong>60</strong> 0.27 0.27 0.14 0.14<br />
Clearance Time (s) 5.4 5.0 5.2 5.2 5.2<br />
Vehicle Extension (s) 3.0 3.0 3.0 3.0 3.0<br />
Lane Grp Cap (vph) 3653 299 499 257 218<br />
v/s Ratio Prot 0.01 c0.09 0.03<br />
v/s Ratio Perm 0.18 0.02 0.00<br />
v/c Ratio 0.29 0.11 0.33 0.18 0.03<br />
Uniform Delay, d1 5.9 16.5 17.6 22.9 22.4<br />
Progression Factor 0.90 1.00 1.00 1.00 1.00<br />
Incremental Delay, d2 0.2 0.2 0.4 0.3 0.1<br />
Delay (s) 5.6 16.7 18.0 23.2 22.4<br />
Level <strong>of</strong> Service A B B C C<br />
Approach Delay (s) 0.0 5.6 17.8 22.8<br />
Approach LOS A A B C<br />
Intersection Summary<br />
HCM 2000 Control Delay 8.5 HCM 2000 Level <strong>of</strong> Service A<br />
HCM 2000 Volume to Capacity ratio 0.33<br />
Actuated Cycle Length (s) <strong>60</strong>.0 Sum <strong>of</strong> lost time (s) 12.1<br />
Intersection Capacity Utilization 38.9% ICU Level <strong>of</strong> Service A<br />
Analysis Period (min) 15<br />
c Critical Lane Group<br />
PM Peak 5:00 pm 11/7/2012 2035 no-build conditions Synchro 8 Report<br />
Page 9
HCM Signalized Intersection Capacity Analysis<br />
10: 10 Avenue & SR <strong>60</strong> WB<br />
11/13/2012<br />
Movement EBL EBT EBR WBL WBT WBR NBL NBT NBR SBL SBT SBR<br />
Lane Configurations<br />
Volume (vph) 0 0 0 14 682 22 101 121 0 0 118 69<br />
Ideal Flow (vphpl) 1900 1900 1900 1900 1900 1900 1900 1900 1900 1900 1900 1900<br />
Lane Width 12 12 12 12 11 12 12 12 12 12 12 12<br />
Total Lost time (s) 3.9 4.2 4.2 4.2<br />
Lane Util. Factor 0.86 1.00 1.00 1.00<br />
Frt 1.00 1.00 1.00 0.95<br />
Flt Protected 1.00 0.95 1.00 1.00<br />
Satd. Flow (prot) 61<strong>60</strong> 1770 1863 1772<br />
Flt Permitted 1.00 0.48 1.00 1.00<br />
Satd. Flow (perm) 61<strong>60</strong> 891 1863 1772<br />
Peak-hour factor, PHF 1.00 1.00 1.00 0.68 0.81 0.85 0.76 0.81 1.00 1.00 0.76 0.78<br />
Adj. Flow (vph) 0 0 0 21 842 26 133 149 0 0 155 88<br />
RTOR Reduction (vph) 0 0 0 0 5 0 0 0 0 0 40 0<br />
Lane Group Flow (vph) 0 0 0 0 884 0 133 149 0 0 203 0<br />
Turn Type Perm NA Perm NA NA<br />
Protected Phases 6 8 4<br />
Permitted Phases 6 8<br />
Actuated Green, G (s) 36.4 13.0 13.0 13.0<br />
Effective Green, g (s) 37.9 14.0 14.0 14.0<br />
Actuated g/C Ratio 0.63 0.23 0.23 0.23<br />
Clearance Time (s) 5.4 5.2 5.2 5.2<br />
Vehicle Extension (s) 3.0 3.0 3.0 3.0<br />
Lane Grp Cap (vph) 3891 207 434 413<br />
v/s Ratio Prot 0.08 0.11<br />
v/s Ratio Perm 0.14 c0.15<br />
v/c Ratio 0.23 0.64 0.34 0.49<br />
Uniform Delay, d1 4.8 20.7 19.2 19.9<br />
Progression Factor 1.00 0.94 0.92 1.00<br />
Incremental Delay, d2 0.1 6.3 0.4 0.9<br />
Delay (s) 4.9 25.8 18.0 20.8<br />
Level <strong>of</strong> Service A C B C<br />
Approach Delay (s) 0.0 4.9 21.7 20.8<br />
Approach LOS A A C C<br />
Intersection Summary<br />
HCM 2000 Control Delay 11.0 HCM 2000 Level <strong>of</strong> Service B<br />
HCM 2000 Volume to Capacity ratio 0.34<br />
Actuated Cycle Length (s) <strong>60</strong>.0 Sum <strong>of</strong> lost time (s) 8.1<br />
Intersection Capacity Utilization 37.0% ICU Level <strong>of</strong> Service A<br />
Analysis Period (min) 15<br />
c Critical Lane Group<br />
PM Peak 5:00 pm 11/7/2012 2035 no-build conditions Synchro 8 Report<br />
Page 10
HCM Signalized Intersection Capacity Analysis<br />
11: 10 Avenue & SR <strong>60</strong> EB<br />
11/13/2012<br />
Movement EBL EBT EBR WBL WBT WBR NBL NBT NBR SBL SBT SBR<br />
Lane Configurations<br />
Volume (vph) 47 678 46 0 0 0 0 143 18 13 79 0<br />
Ideal Flow (vphpl) 1900 1900 1900 1900 1900 1900 1900 1900 1900 1900 1900 1900<br />
Lane Width 12 11 12 12 12 12 12 12 12 12 12 12<br />
Total Lost time (s) 3.9 4.0 4.0 4.0<br />
Lane Util. Factor 0.91 1.00 1.00 1.00<br />
Frt 0.99 0.98 1.00 1.00<br />
Flt Protected 1.00 1.00 0.95 1.00<br />
Satd. Flow (prot) 4856 1833 1770 1863<br />
Flt Permitted 1.00 1.00 0.37 1.00<br />
Satd. Flow (perm) 4856 1833 682 1863<br />
Peak-hour factor, PHF 0.84 0.79 0.75 1.00 1.00 1.00 1.00 0.69 0.65 0.56 0.83 1.00<br />
Adj. Flow (vph) 56 858 61 0 0 0 0 207 28 23 95 0<br />
RTOR Reduction (vph) 0 9 0 0 0 0 0 9 0 0 0 0<br />
Lane Group Flow (vph) 0 966 0 0 0 0 0 226 0 23 95 0<br />
Turn Type Perm NA NA pm+pt NA<br />
Protected Phases 2 8 7 4<br />
Permitted Phases 2 4<br />
Actuated Green, G (s) 30.7 12.4 18.9 18.9<br />
Effective Green, g (s) 32.2 13.4 19.9 19.9<br />
Actuated g/C Ratio 0.54 0.22 0.33 0.33<br />
Clearance Time (s) 5.4 5.0 5.0 5.0<br />
Vehicle Extension (s) 3.0 3.0 3.0 3.0<br />
Lane Grp Cap (vph) 2<strong>60</strong>6 409 271 617<br />
v/s Ratio Prot c0.12 0.00 c0.05<br />
v/s Ratio Perm 0.20 0.02<br />
v/c Ratio 0.37 0.55 0.08 0.15<br />
Uniform Delay, d1 8.0 20.6 14.0 14.1<br />
Progression Factor 0.65 1.00 1.44 1.35<br />
Incremental Delay, d2 0.4 1.6 0.1 0.1<br />
Delay (s) 5.6 22.3 20.3 19.2<br />
Level <strong>of</strong> Service A C C B<br />
Approach Delay (s) 5.6 0.0 22.3 19.4<br />
Approach LOS A A C B<br />
Intersection Summary<br />
HCM 2000 Control Delay 9.8 HCM 2000 Level <strong>of</strong> Service A<br />
HCM 2000 Volume to Capacity ratio 0.42<br />
Actuated Cycle Length (s) <strong>60</strong>.0 Sum <strong>of</strong> lost time (s) 11.9<br />
Intersection Capacity Utilization 37.0% ICU Level <strong>of</strong> Service A<br />
Analysis Period (min) 15<br />
c Critical Lane Group<br />
PM Peak 5:00 pm 11/7/2012 2035 no-build conditions Synchro 8 Report<br />
Page 11
Build Conditions
HCM Signalized Intersection Capacity Analysis<br />
1: 20 Avenue SB & SR <strong>60</strong> EB<br />
11/13/2012<br />
Movement EBL EBT EBR WBL WBT WBR NBL NBT NBR SBL SBT SBR<br />
Lane Configurations<br />
Volume (vph) 0 756 65 0 0 0 0 0 0 27 166 0<br />
Ideal Flow (vphpl) 1900 1900 1900 1900 1900 1900 1900 1900 1900 1900 1900 1900<br />
Lane Width 12 11 12 12 12 12 12 12 12 12 12 12<br />
Total Lost time (s) 4.3 4.0<br />
Lane Util. Factor 0.91 0.95<br />
Frt 0.99 1.00<br />
Flt Protected 1.00 0.99<br />
Satd. Flow (prot) 4374 3168<br />
Flt Permitted 1.00 0.99<br />
Satd. Flow (perm) 4374 3168<br />
Peak-hour factor, PHF 1.00 0.71 0.75 1.00 1.00 1.00 1.00 1.00 1.00 0.75 0.58 1.00<br />
Adj. Flow (vph) 0 1065 87 0 0 0 0 0 0 36 286 0<br />
RTOR Reduction (vph) 0 7 0 0 0 0 0 0 0 0 61 0<br />
Lane Group Flow (vph) 0 1145 0 0 0 0 0 0 0 0 261 0<br />
Turn Type NA Split NA<br />
Protected Phases 2 3 3<br />
Permitted Phases<br />
Actuated Green, G (s) 61.0 15.8<br />
Effective Green, g (s) 62.0 16.8<br />
Actuated g/C Ratio 0.52 0.14<br />
Clearance Time (s) 5.3 5.0<br />
Vehicle Extension (s) 3.0 3.0<br />
Lane Grp Cap (vph) 2259 443<br />
v/s Ratio Prot c0.26 c0.08<br />
v/s Ratio Perm<br />
v/c Ratio 0.51 0.59<br />
Uniform Delay, d1 19.0 48.4<br />
Progression Factor 1.00 0.18<br />
Incremental Delay, d2 0.8 1.6<br />
Delay (s) 19.8 10.4<br />
Level <strong>of</strong> Service B B<br />
Approach Delay (s) 19.8 0.0 0.0 10.4<br />
Approach LOS B A A B<br />
Intersection Summary<br />
HCM 2000 Control Delay 17.7 HCM 2000 Level <strong>of</strong> Service B<br />
HCM 2000 Volume to Capacity ratio 0.39<br />
Actuated Cycle Length (s) 120.0 Sum <strong>of</strong> lost time (s) 14.8<br />
Intersection Capacity Utilization 30.8% ICU Level <strong>of</strong> Service A<br />
Analysis Period (min) 15<br />
c Critical Lane Group<br />
PM Peak 5:00 pm 11/7/2012 2035 build conditions Synchro 7 - Report<br />
Page 1
HCM Signalized Intersection Capacity Analysis<br />
2: 20 Avenue NB & SR <strong>60</strong> EB<br />
11/13/2012<br />
Movement EBL EBT EBR WBL WBT WBR NBL NBT NBR SBL SBT SBR<br />
Lane Configurations<br />
Volume (vph) 8 773 0 0 0 0 0 166 50 0 0 0<br />
Ideal Flow (vphpl) 1900 1900 1900 1900 1900 1900 1900 1900 1900 1900 1900 1900<br />
Total Lost time (s) 4.3 4.3 4.5<br />
Lane Util. Factor 1.00 0.91 0.95<br />
Frt 1.00 1.00 0.97<br />
Flt Protected 0.95 1.00 1.00<br />
Satd. Flow (prot) 1593 4577 3079<br />
Flt Permitted 0.95 1.00 1.00<br />
Satd. Flow (perm) 1593 4577 3079<br />
Peak-hour factor, PHF 0.58 0.84 1.00 1.00 1.00 1.00 1.00 0.71 0.75 1.00 1.00 1.00<br />
Adj. Flow (vph) 14 920 0 0 0 0 0 234 67 0 0 0<br />
RTOR Reduction (vph) 4 0 0 0 0 0 0 24 0 0 0 0<br />
Lane Group Flow (vph) 10 920 0 0 0 0 0 277 0 0 0 0<br />
Turn Type Split NA NA<br />
Protected Phases 2 3 2 3 4<br />
Permitted Phases<br />
Actuated Green, G (s) 82.1 82.1 27.4<br />
Effective Green, g (s) 83.1 83.1 28.4<br />
Actuated g/C Ratio 0.69 0.69 0.24<br />
Clearance Time (s) 5.5<br />
Vehicle Extension (s) 3.0<br />
Lane Grp Cap (vph) 1103 3169 728<br />
v/s Ratio Prot 0.01 c0.20 c0.09<br />
v/s Ratio Perm<br />
v/c Ratio 0.01 0.29 0.38<br />
Uniform Delay, d1 5.7 7.1 38.4<br />
Progression Factor 0.00 0.02 1.00<br />
Incremental Delay, d2 0.0 0.0 0.3<br />
Delay (s) 0.0 0.2 38.8<br />
Level <strong>of</strong> Service A A D<br />
Approach Delay (s) 0.2 0.0 38.8 0.0<br />
Approach LOS A A D A<br />
Intersection Summary<br />
HCM 2000 Control Delay 9.6 HCM 2000 Level <strong>of</strong> Service A<br />
HCM 2000 Volume to Capacity ratio 0.33<br />
Actuated Cycle Length (s) 120.0 Sum <strong>of</strong> lost time (s) 14.3<br />
Intersection Capacity Utilization 52.2% ICU Level <strong>of</strong> Service A<br />
Analysis Period (min) 15<br />
c Critical Lane Group<br />
PM Peak 5:00 pm 11/7/2012 2035 build conditions Synchro 7 - Report<br />
Page 2
HCM Signalized Intersection Capacity Analysis<br />
3: 20 Avenue SB & SR <strong>60</strong> WB<br />
11/13/2012<br />
Movement EBL EBT EBR WBL WBT WBR NBL NBT NBR SBL SBT SBR<br />
Lane Configurations<br />
Volume (vph) 0 0 0 42 1075 0 0 0 0 0 146 64<br />
Ideal Flow (vphpl) 1900 1900 1900 1900 1900 1900 1900 1900 1900 1900 1900 1900<br />
Total Lost time (s) 4.0 3.0<br />
Lane Util. Factor 0.91 0.95<br />
Frt 1.00 0.96<br />
Flt Protected 1.00 1.00<br />
Satd. Flow (prot) 4568 3068<br />
Flt Permitted 1.00 1.00<br />
Satd. Flow (perm) 4568 3068<br />
Peak-hour factor, PHF 1.00 1.00 1.00 0.71 0.74 1.00 1.00 1.00 1.00 1.00 0.58 0.78<br />
Adj. Flow (vph) 0 0 0 59 1453 0 0 0 0 0 252 82<br />
RTOR Reduction (vph) 0 0 0 0 4 0 0 0 0 0 26 0<br />
Lane Group Flow (vph) 0 0 0 0 1508 0 0 0 0 0 308 0<br />
Turn Type Prot NA NA<br />
Protected Phases 4! 4 6! 7!<br />
Permitted Phases<br />
Actuated Green, G (s) 88.4 16.5<br />
Effective Green, g (s) 91.4 17.5<br />
Actuated g/C Ratio 0.76 0.15<br />
Clearance Time (s) 4.0<br />
Vehicle Extension (s) 3.0<br />
Lane Grp Cap (vph) 3631 447<br />
v/s Ratio Prot c0.10 c0.10<br />
v/s Ratio Perm 0.23<br />
v/c Ratio 0.42 0.69<br />
Uniform Delay, d1 5.0 48.7<br />
Progression Factor 3.26 1.00<br />
Incremental Delay, d2 0.1 4.4<br />
Delay (s) 16.3 53.0<br />
Level <strong>of</strong> Service B D<br />
Approach Delay (s) 0.0 16.3 0.0 53.0<br />
Approach LOS A B A D<br />
Intersection Summary<br />
HCM 2000 Control Delay 22.9 HCM 2000 Level <strong>of</strong> Service C<br />
HCM 2000 Volume to Capacity ratio 0.49<br />
Actuated Cycle Length (s) 120.0 Sum <strong>of</strong> lost time (s) 14.3<br />
Intersection Capacity Utilization 37.5% ICU Level <strong>of</strong> Service A<br />
Analysis Period (min) 15<br />
! Phase conflict between lane groups.<br />
c Critical Lane Group<br />
PM Peak 5:00 pm 11/7/2012 2035 build conditions Synchro 7 - Report<br />
Page 3
HCM Signalized Intersection Capacity Analysis<br />
4: 20 Avenue NB & SR <strong>60</strong> WB<br />
11/13/2012<br />
Movement EBL EBT EBR WBL WBT WBR NBL NBT NBR SBL SBT SBR<br />
Lane Configurations<br />
Volume (vph) 0 0 0 0 1059 49 65 109 0 0 0 0<br />
Ideal Flow (vphpl) 1900 1900 1900 1900 1900 1900 1900 1900 1900 1900 1900 1900<br />
Total Lost time (s) 3.8 3.8 4.0<br />
Lane Util. Factor 0.91 1.00 0.95<br />
Frt 1.00 0.85 1.00<br />
Flt Protected 1.00 1.00 0.98<br />
Satd. Flow (prot) 4577 1425 3134<br />
Flt Permitted 1.00 1.00 0.98<br />
Satd. Flow (perm) 4577 1425 3134<br />
Peak-hour factor, PHF 1.00 1.00 1.00 1.00 0.73 0.76 0.85 0.71 1.00 1.00 1.00 1.00<br />
Adj. Flow (vph) 0 0 0 0 1451 64 76 154 0 0 0 0<br />
RTOR Reduction (vph) 0 0 0 0 0 31 0 54 0 0 0 0<br />
Lane Group Flow (vph) 0 0 0 0 1451 33 0 176 0 0 0 0<br />
Turn Type NA Perm Split NA<br />
Protected Phases 6 8 8<br />
Permitted Phases 6<br />
Actuated Green, G (s) 61.0 61.0 28.2<br />
Effective Green, g (s) 62.5 62.5 29.2<br />
Actuated g/C Ratio 0.52 0.52 0.24<br />
Clearance Time (s) 5.3 5.3 5.0<br />
Vehicle Extension (s) 3.0 3.0 3.0<br />
Lane Grp Cap (vph) 2383 742 762<br />
v/s Ratio Prot c0.32 c0.06<br />
v/s Ratio Perm 0.02<br />
v/c Ratio 0.61 0.04 0.23<br />
Uniform Delay, d1 20.2 14.1 36.4<br />
Progression Factor 1.13 1.83 0.04<br />
Incremental Delay, d2 0.8 0.1 0.2<br />
Delay (s) 23.7 25.9 1.8<br />
Level <strong>of</strong> Service C C A<br />
Approach Delay (s) 0.0 23.8 1.8 0.0<br />
Approach LOS A C A A<br />
Intersection Summary<br />
HCM 2000 Control Delay 20.9 HCM 2000 Level <strong>of</strong> Service C<br />
HCM 2000 Volume to Capacity ratio 0.43<br />
Actuated Cycle Length (s) 120.0 Sum <strong>of</strong> lost time (s) 15.8<br />
Intersection Capacity Utilization 34.8% ICU Level <strong>of</strong> Service A<br />
Analysis Period (min) 15<br />
c Critical Lane Group<br />
PM Peak 5:00 pm 11/7/2012 2035 build conditions Synchro 7 - Report<br />
Page 4
HCM Signalized Intersection Capacity Analysis<br />
5: 14 Avenue & SR <strong>60</strong> EB<br />
11/13/2012<br />
Movement EBL EBT EBR WBL WBT WBR NBL NBT NBR SBL SBT SBR<br />
Lane Configurations<br />
Volume (vph) 52 634 47 0 0 0 0 202 42 49 306 0<br />
Ideal Flow (vphpl) 1900 1900 1900 1900 1900 1900 1900 1900 1900 1900 1900 1900<br />
Lane Width 12 11 12 12 12 12 12 12 12 12 12 12<br />
Total Lost time (s) 4.2 4.1 4.1 3.6 4.1<br />
Lane Util. Factor 0.95 1.00 1.00 1.00 1.00<br />
Frpb, ped/bikes 1.00 1.00 0.98 1.00 1.00<br />
Flpb, ped/bikes 1.00 1.00 1.00 1.00 1.00<br />
Frt 0.99 1.00 0.85 1.00 1.00<br />
Flt Protected 1.00 1.00 1.00 0.95 1.00<br />
Satd. Flow (prot) 3021 1676 1391 1589 1676<br />
Flt Permitted 1.00 1.00 1.00 0.39 1.00<br />
Satd. Flow (perm) 3021 1676 1391 651 1676<br />
Peak-hour factor, PHF 0.64 0.78 0.71 1.00 1.00 1.00 1.00 0.86 0.72 0.57 0.79 1.00<br />
Adj. Flow (vph) 81 813 66 0 0 0 0 235 58 86 387 0<br />
RTOR Reduction (vph) 0 8 0 0 0 0 0 0 44 0 0 0<br />
Lane Group Flow (vph) 0 952 0 0 0 0 0 235 14 86 387 0<br />
Confl. Peds. (#/hr) 10 10 10 10<br />
Parking (#/hr) 10<br />
Turn Type Perm NA NA Perm pm+pt NA<br />
Protected Phases 2 8 7 4<br />
Permitted Phases 2 8 4<br />
Actuated Green, G (s) 25.9 13.0 13.0 23.8 23.8<br />
Effective Green, g (s) 26.9 14.0 14.0 24.8 24.8<br />
Actuated g/C Ratio 0.45 0.23 0.23 0.41 0.41<br />
Clearance Time (s) 5.2 5.1 5.1 4.6 5.1<br />
Vehicle Extension (s) 3.0 3.0 3.0 3.0 3.0<br />
Lane Grp Cap (vph) 1354 391 324 381 692<br />
v/s Ratio Prot 0.14 0.03 c0.23<br />
v/s Ratio Perm 0.32 0.01 0.07<br />
v/c Ratio 0.70 0.<strong>60</strong> 0.04 0.23 0.56<br />
Uniform Delay, d1 13.3 20.5 17.8 11.3 13.4<br />
Progression Factor 1.49 1.00 1.00 1.64 1.41<br />
Incremental Delay, d2 3.0 2.6 0.1 0.2 0.5<br />
Delay (s) 22.8 23.1 17.9 18.7 19.4<br />
Level <strong>of</strong> Service C C B B B<br />
Approach Delay (s) 22.8 0.0 22.1 19.3<br />
Approach LOS C A C B<br />
Intersection Summary<br />
HCM 2000 Control Delay 21.7 HCM 2000 Level <strong>of</strong> Service C<br />
HCM 2000 Volume to Capacity ratio 0.68<br />
Actuated Cycle Length (s) <strong>60</strong>.0 Sum <strong>of</strong> lost time (s) 11.9<br />
Intersection Capacity Utilization 71.2% ICU Level <strong>of</strong> Service C<br />
Analysis Period (min) 15<br />
c Critical Lane Group<br />
PM Peak 5:00 pm 11/7/2012 2035 build conditions Synchro 7 - Report<br />
Page 5
HCM Signalized Intersection Capacity Analysis<br />
6: 14 Avenue & SR <strong>60</strong> WB<br />
11/13/2012<br />
Movement EBL EBT EBR WBL WBT WBR NBL NBT NBR SBL SBT SBR<br />
Lane Configurations<br />
Volume (vph) 0 0 0 52 837 32 86 188 0 0 370 93<br />
Ideal Flow (vphpl) 1900 1900 1900 1900 1900 1900 1900 1900 1900 1900 1900 1900<br />
Lane Width 12 12 12 11 11 12 12 12 12 12 12 12<br />
Total Lost time (s) 4.1 4.1 5.0 4.0 4.0<br />
Lane Util. Factor 1.00 0.95 1.00 1.00 1.00<br />
Frpb, ped/bikes 1.00 1.00 1.00 1.00 1.00<br />
Flpb, ped/bikes 0.98 1.00 1.00 1.00 1.00<br />
Frt 1.00 0.99 1.00 1.00 0.97<br />
Flt Protected 0.95 1.00 0.95 1.00 1.00<br />
Satd. Flow (prot) 1286 3055 1592 1676 1616<br />
Flt Permitted 0.95 1.00 0.16 1.00 1.00<br />
Satd. Flow (perm) 1286 3055 271 1676 1616<br />
Peak-hour factor, PHF 1.00 1.00 1.00 0.71 0.84 0.75 0.80 0.72 1.00 1.00 0.86 0.72<br />
Adj. Flow (vph) 0 0 0 73 996 43 108 261 0 0 430 129<br />
RTOR Reduction (vph) 0 0 0 0 5 0 0 0 0 0 18 0<br />
Lane Group Flow (vph) 0 0 0 73 1034 0 108 261 0 0 541 0<br />
Confl. Peds. (#/hr) 10 10 10 10<br />
Parking (#/hr) 10 10<br />
Turn Type Perm NA pm+pt NA NA<br />
Protected Phases 6 3 8 4<br />
Permitted Phases 6 8<br />
Actuated Green, G (s) 19.5 19.5 29.9 29.9 20.2<br />
Effective Green, g (s) 21.0 21.0 29.4 30.9 21.2<br />
Actuated g/C Ratio 0.35 0.35 0.49 0.51 0.35<br />
Clearance Time (s) 5.6 5.6 4.5 5.0 5.0<br />
Vehicle Extension (s) 3.0 3.0 3.0 3.0 3.0<br />
Lane Grp Cap (vph) 450 1069 236 863 570<br />
v/s Ratio Prot c0.34 c0.04 0.16 c0.33<br />
v/s Ratio Perm 0.06 0.19<br />
v/c Ratio 0.16 0.97 0.46 0.30 0.95<br />
Uniform Delay, d1 13.4 19.2 11.5 8.4 18.9<br />
Progression Factor 0.76 0.97 1.59 0.55 1.00<br />
Incremental Delay, d2 0.7 19.8 1.3 0.2 25.3<br />
Delay (s) 10.9 38.5 19.7 4.7 44.1<br />
Level <strong>of</strong> Service B D B A D<br />
Approach Delay (s) 0.0 36.7 9.1 44.1<br />
Approach LOS A D A D<br />
Intersection Summary<br />
HCM 2000 Control Delay 33.7 HCM 2000 Level <strong>of</strong> Service C<br />
HCM 2000 Volume to Capacity ratio 0.91<br />
Actuated Cycle Length (s) <strong>60</strong>.0 Sum <strong>of</strong> lost time (s) 13.1<br />
Intersection Capacity Utilization 71.2% ICU Level <strong>of</strong> Service C<br />
Analysis Period (min) 15<br />
c Critical Lane Group<br />
PM Peak 5:00 pm 11/7/2012 2035 build conditions Synchro 7 - Report<br />
Page 6
HCM Signalized Intersection Capacity Analysis<br />
7: Commerce Ave & SR <strong>60</strong> EB<br />
11/13/2012<br />
Movement EBL EBT EBR WBL WBT WBR NBL NBT NBR SBL SBT SBR<br />
Lane Configurations<br />
Volume (vph) 31 1048 27 0 0 0 0 20 16 29 28 0<br />
Ideal Flow (vphpl) 1900 1900 1900 1900 1900 1900 1900 1900 1900 1900 1900 1900<br />
Lane Width 12 11 12 12 12 12 12 12 12 12 12 12<br />
Total Lost time (s) 4.1 4.0 4.0 4.0<br />
Lane Util. Factor 0.91 1.00 1.00 1.00<br />
Frt 1.00 0.94 1.00 1.00<br />
Flt Protected 1.00 1.00 0.95 1.00<br />
Satd. Flow (prot) 4395 1572 1593 1676<br />
Flt Permitted 1.00 1.00 0.72 1.00<br />
Satd. Flow (perm) 4395 1572 1210 1676<br />
Peak-hour factor, PHF 0.65 0.89 0.70 1.00 1.00 1.00 1.00 0.70 0.65 0.66 0.65 1.00<br />
Adj. Flow (vph) 48 1178 39 0 0 0 0 29 25 44 43 0<br />
RTOR Reduction (vph) 0 4 0 0 0 0 0 22 0 0 0 0<br />
Lane Group Flow (vph) 0 1261 0 0 0 0 0 32 0 44 43 0<br />
Turn Type Perm NA NA Perm NA<br />
Protected Phases 2 8 4<br />
Permitted Phases 2 4<br />
Actuated Green, G (s) 44.5 5.4 5.4 5.4<br />
Effective Green, g (s) 45.5 6.4 6.4 6.4<br />
Actuated g/C Ratio 0.76 0.11 0.11 0.11<br />
Clearance Time (s) 5.1 5.0 5.0 5.0<br />
Vehicle Extension (s) 3.0 3.0 3.0 3.0<br />
Lane Grp Cap (vph) 3332 167 129 178<br />
v/s Ratio Prot 0.02 0.03<br />
v/s Ratio Perm 0.29 c0.04<br />
v/c Ratio 0.38 0.19 0.34 0.24<br />
Uniform Delay, d1 2.5 24.4 24.8 24.6<br />
Progression Factor 0.44 1.00 0.80 0.79<br />
Incremental Delay, d2 0.3 0.6 1.5 0.7<br />
Delay (s) 1.4 25.0 21.3 20.1<br />
Level <strong>of</strong> Service A C C C<br />
Approach Delay (s) 1.4 0.0 25.0 20.7<br />
Approach LOS A A C C<br />
Intersection Summary<br />
HCM 2000 Control Delay 3.5 HCM 2000 Level <strong>of</strong> Service A<br />
HCM 2000 Volume to Capacity ratio 0.37<br />
Actuated Cycle Length (s) <strong>60</strong>.0 Sum <strong>of</strong> lost time (s) 8.1<br />
Intersection Capacity Utilization 43.9% ICU Level <strong>of</strong> Service A<br />
Analysis Period (min) 15<br />
c Critical Lane Group<br />
PM Peak 5:00 pm 11/7/2012 2035 build conditions Synchro 7 - Report<br />
Page 7
HCM Signalized Intersection Capacity Analysis<br />
8: Commerce Ave & SR <strong>60</strong> WB<br />
11/13/2012<br />
Movement EBL EBT EBR WBL WBT WBR NBL NBT NBR SBL SBT SBR<br />
Lane Configurations<br />
Volume (vph) 0 0 0 37 1250 3 49 38 0 0 34 49<br />
Ideal Flow (vphpl) 1900 1900 1900 1900 1900 1900 1900 1900 1900 1900 1900 1900<br />
Lane Width 12 12 12 12 11 12 12 12 12 12 12 12<br />
Total Lost time (s) 3.9 4.0 4.0 4.0<br />
Lane Util. Factor 0.86 1.00 1.00 1.00<br />
Frt 1.00 1.00 1.00 0.93<br />
Flt Protected 1.00 0.95 1.00 1.00<br />
Satd. Flow (prot) 5559 1593 1676 1567<br />
Flt Permitted 1.00 0.68 1.00 1.00<br />
Satd. Flow (perm) 5559 1142 1676 1567<br />
Peak-hour factor, PHF 1.00 1.00 1.00 0.51 0.79 0.37 0.79 0.68 1.00 1.00 0.56 0.86<br />
Adj. Flow (vph) 0 0 0 73 1582 8 62 56 0 0 61 57<br />
RTOR Reduction (vph) 0 0 0 0 1 0 0 0 0 0 32 0<br />
Lane Group Flow (vph) 0 0 0 0 1662 0 62 56 0 0 86 0<br />
Turn Type Perm NA Perm NA NA<br />
Protected Phases 6 8 4<br />
Permitted Phases 6 8<br />
Actuated Green, G (s) 41.9 7.7 7.7 7.7<br />
Effective Green, g (s) 43.4 8.7 8.7 8.7<br />
Actuated g/C Ratio 0.72 0.14 0.14 0.14<br />
Clearance Time (s) 5.4 5.0 5.0 5.0<br />
Vehicle Extension (s) 3.0 3.0 3.0 3.0<br />
Lane Grp Cap (vph) 4021 165 243 227<br />
v/s Ratio Prot 0.03 c0.05<br />
v/s Ratio Perm 0.30 0.05<br />
v/c Ratio 0.41 0.38 0.23 0.38<br />
Uniform Delay, d1 3.3 23.2 22.7 23.2<br />
Progression Factor 1.28 1.11 1.11 1.00<br />
Incremental Delay, d2 0.3 1.4 0.5 1.1<br />
Delay (s) 4.5 27.1 25.7 24.2<br />
Level <strong>of</strong> Service A C C C<br />
Approach Delay (s) 0.0 4.5 26.4 24.2<br />
Approach LOS A A C C<br />
Intersection Summary<br />
HCM 2000 Control Delay 7.1 HCM 2000 Level <strong>of</strong> Service A<br />
HCM 2000 Volume to Capacity ratio 0.41<br />
Actuated Cycle Length (s) <strong>60</strong>.0 Sum <strong>of</strong> lost time (s) 7.9<br />
Intersection Capacity Utilization 43.9% ICU Level <strong>of</strong> Service A<br />
Analysis Period (min) 15<br />
c Critical Lane Group<br />
PM Peak 5:00 pm 11/7/2012 2035 build conditions Synchro 7 - Report<br />
Page 8
HCM Signalized Intersection Capacity Analysis<br />
9: SR <strong>60</strong> WB & 11 Avenue<br />
11/13/2012<br />
Movement EBL EBT EBR WBL WBT WBR NBL NBT NBR SBL SBT SBR<br />
Lane Configurations<br />
Volume (vph) 0 0 0 16 820 50 23 119 0 0 42 43<br />
Ideal Flow (vphpl) 1900 1900 1900 1900 1900 1900 1900 1900 1900 1900 1900 1900<br />
Lane Width 12 12 12 12 11 12 12 12 12 12 12 12<br />
Total Lost time (s) 3.9 4.0 4.2 4.2 4.2<br />
Lane Util. Factor 0.86 1.00 1.00 1.00 1.00<br />
Frt 0.99 1.00 1.00 1.00 0.85<br />
Flt Protected 1.00 0.95 1.00 1.00 1.00<br />
Satd. Flow (prot) 6125 1770 1863 1863 1583<br />
Flt Permitted 1.00 0.49 1.00 1.00 1.00<br />
Satd. Flow (perm) 6125 910 1863 1863 1583<br />
Peak-hour factor, PHF 1.00 1.00 1.00 0.70 0.87 0.71 0.75 0.73 1.00 1.00 0.92 0.92<br />
Adj. Flow (vph) 0 0 0 23 943 70 31 163 0 0 46 47<br />
RTOR Reduction (vph) 0 0 0 0 13 0 0 0 0 0 0 41<br />
Lane Group Flow (vph) 0 0 0 0 1023 0 31 163 0 0 46 6<br />
Turn Type Perm NA pm+pt NA NA Perm<br />
Protected Phases 6 3 8 4<br />
Permitted Phases 6 8 4<br />
Actuated Green, G (s) 34.4 15.0 15.0 7.2 7.2<br />
Effective Green, g (s) 35.9 16.0 16.0 8.2 8.2<br />
Actuated g/C Ratio 0.<strong>60</strong> 0.27 0.27 0.14 0.14<br />
Clearance Time (s) 5.4 5.0 5.2 5.2 5.2<br />
Vehicle Extension (s) 3.0 3.0 3.0 3.0 3.0<br />
Lane Grp Cap (vph) 3664 297 496 254 216<br />
v/s Ratio Prot 0.01 c0.09 0.02<br />
v/s Ratio Perm 0.17 0.02 0.00<br />
v/c Ratio 0.28 0.10 0.33 0.18 0.03<br />
Uniform Delay, d1 5.8 16.6 17.7 22.9 22.5<br />
Progression Factor 0.92 1.00 1.00 1.00 1.00<br />
Incremental Delay, d2 0.2 0.2 0.4 0.3 0.1<br />
Delay (s) 5.5 16.7 18.1 23.3 22.5<br />
Level <strong>of</strong> Service A B B C C<br />
Approach Delay (s) 0.0 5.5 17.9 22.9<br />
Approach LOS A A B C<br />
Intersection Summary<br />
HCM 2000 Control Delay 8.6 HCM 2000 Level <strong>of</strong> Service A<br />
HCM 2000 Volume to Capacity ratio 0.32<br />
Actuated Cycle Length (s) <strong>60</strong>.0 Sum <strong>of</strong> lost time (s) 12.1<br />
Intersection Capacity Utilization 37.1% ICU Level <strong>of</strong> Service A<br />
Analysis Period (min) 15<br />
c Critical Lane Group<br />
PM Peak 5:00 pm 11/7/2012 2035 build conditions Synchro 7 - Report<br />
Page 9
HCM Signalized Intersection Capacity Analysis<br />
10: 10 Avenue & SR <strong>60</strong> WB<br />
11/13/2012<br />
Movement EBL EBT EBR WBL WBT WBR NBL NBT NBR SBL SBT SBR<br />
Lane Configurations<br />
Volume (vph) 0 0 0 13 651 21 98 118 0 0 116 68<br />
Ideal Flow (vphpl) 1900 1900 1900 1900 1900 1900 1900 1900 1900 1900 1900 1900<br />
Lane Width 12 12 12 12 11 12 12 12 12 12 12 12<br />
Total Lost time (s) 3.9 4.2 4.2 4.2<br />
Lane Util. Factor 0.86 1.00 1.00 1.00<br />
Frt 1.00 1.00 1.00 0.95<br />
Flt Protected 1.00 0.95 1.00 1.00<br />
Satd. Flow (prot) 61<strong>60</strong> 1770 1863 1772<br />
Flt Permitted 1.00 0.48 1.00 1.00<br />
Satd. Flow (perm) 61<strong>60</strong> 893 1863 1772<br />
Peak-hour factor, PHF 1.00 1.00 1.00 0.68 0.81 0.85 0.76 0.81 1.00 1.00 0.76 0.78<br />
Adj. Flow (vph) 0 0 0 19 804 25 129 146 0 0 153 87<br />
RTOR Reduction (vph) 0 0 0 0 5 0 0 0 0 0 40 0<br />
Lane Group Flow (vph) 0 0 0 0 843 0 129 146 0 0 200 0<br />
Turn Type Perm NA Perm NA NA<br />
Protected Phases 6 8 4<br />
Permitted Phases 6 8<br />
Actuated Green, G (s) 36.7 12.7 12.7 12.7<br />
Effective Green, g (s) 38.2 13.7 13.7 13.7<br />
Actuated g/C Ratio 0.64 0.23 0.23 0.23<br />
Clearance Time (s) 5.4 5.2 5.2 5.2<br />
Vehicle Extension (s) 3.0 3.0 3.0 3.0<br />
Lane Grp Cap (vph) 3921 203 425 404<br />
v/s Ratio Prot 0.08 0.11<br />
v/s Ratio Perm 0.14 c0.14<br />
v/c Ratio 0.21 0.64 0.34 0.49<br />
Uniform Delay, d1 4.6 20.9 19.4 20.1<br />
Progression Factor 1.00 0.98 0.96 1.00<br />
Incremental Delay, d2 0.1 6.0 0.5 1.0<br />
Delay (s) 4.7 26.5 19.1 21.1<br />
Level <strong>of</strong> Service A C B C<br />
Approach Delay (s) 0.0 4.7 22.6 21.1<br />
Approach LOS A A C C<br />
Intersection Summary<br />
HCM 2000 Control Delay 11.2 HCM 2000 Level <strong>of</strong> Service B<br />
HCM 2000 Volume to Capacity ratio 0.33<br />
Actuated Cycle Length (s) <strong>60</strong>.0 Sum <strong>of</strong> lost time (s) 8.1<br />
Intersection Capacity Utilization 36.1% ICU Level <strong>of</strong> Service A<br />
Analysis Period (min) 15<br />
c Critical Lane Group<br />
PM Peak 5:00 pm 11/7/2012 2035 build conditions Synchro 7 - Report<br />
Page 10
HCM Signalized Intersection Capacity Analysis<br />
11: 10 Avenue & SR <strong>60</strong> EB<br />
11/13/2012<br />
Movement EBL EBT EBR WBL WBT WBR NBL NBT NBR SBL SBT SBR<br />
Lane Configurations<br />
Volume (vph) 45 648 44 0 0 0 0 140 17 12 77 0<br />
Ideal Flow (vphpl) 1900 1900 1900 1900 1900 1900 1900 1900 1900 1900 1900 1900<br />
Lane Width 12 11 12 12 12 12 12 12 12 12 12 12<br />
Total Lost time (s) 3.9 4.0 4.0 4.0<br />
Lane Util. Factor 0.91 1.00 1.00 1.00<br />
Frt 0.99 0.98 1.00 1.00<br />
Flt Protected 1.00 1.00 0.95 1.00<br />
Satd. Flow (prot) 4855 1834 1770 1863<br />
Flt Permitted 1.00 1.00 0.37 1.00<br />
Satd. Flow (perm) 4855 1834 696 1863<br />
Peak-hour factor, PHF 0.84 0.79 0.75 1.00 1.00 1.00 1.00 0.69 0.65 0.56 0.83 1.00<br />
Adj. Flow (vph) 54 820 59 0 0 0 0 203 26 21 93 0<br />
RTOR Reduction (vph) 0 9 0 0 0 0 0 9 0 0 0 0<br />
Lane Group Flow (vph) 0 924 0 0 0 0 0 220 0 21 93 0<br />
Turn Type Perm NA NA pm+pt NA<br />
Protected Phases 2 8 7 4<br />
Permitted Phases 2 4<br />
Actuated Green, G (s) 30.8 12.3 18.8 18.8<br />
Effective Green, g (s) 32.3 13.3 19.8 19.8<br />
Actuated g/C Ratio 0.54 0.22 0.33 0.33<br />
Clearance Time (s) 5.4 5.0 5.0 5.0<br />
Vehicle Extension (s) 3.0 3.0 3.0 3.0<br />
Lane Grp Cap (vph) 2613 406 274 614<br />
v/s Ratio Prot c0.12 0.00 c0.05<br />
v/s Ratio Perm 0.19 0.02<br />
v/c Ratio 0.35 0.54 0.08 0.15<br />
Uniform Delay, d1 7.9 20.7 14.0 14.2<br />
Progression Factor 0.63 1.00 1.47 1.36<br />
Incremental Delay, d2 0.4 1.5 0.1 0.1<br />
Delay (s) 5.3 22.1 20.8 19.4<br />
Level <strong>of</strong> Service A C C B<br />
Approach Delay (s) 5.3 0.0 22.1 19.6<br />
Approach LOS A A C B<br />
Intersection Summary<br />
HCM 2000 Control Delay 9.6 HCM 2000 Level <strong>of</strong> Service A<br />
HCM 2000 Volume to Capacity ratio 0.40<br />
Actuated Cycle Length (s) <strong>60</strong>.0 Sum <strong>of</strong> lost time (s) 11.9<br />
Intersection Capacity Utilization 36.1% ICU Level <strong>of</strong> Service A<br />
Analysis Period (min) 15<br />
c Critical Lane Group<br />
PM Peak 5:00 pm 11/7/2012 2035 build conditions Synchro 7 - Report<br />
Page 11