sr 60 “twin pairs” - City of Vero Beach
sr 60 “twin pairs” - City of Vero Beach
sr 60 “twin pairs” - City of Vero Beach

You also want an ePaper? Increase the reach of your titles
YUMPU automatically turns print PDFs into web optimized ePapers that Google loves.
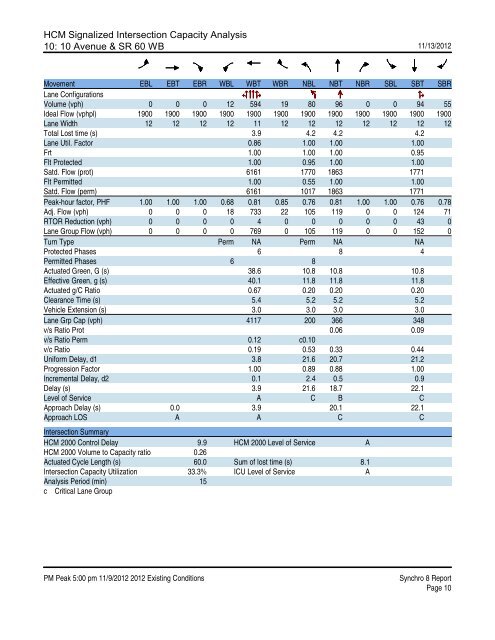
HCM Signalized Intersection Capacity Analysis<br />
10: 10 Avenue & SR <strong>60</strong> WB<br />
11/13/2012<br />
Movement EBL EBT EBR WBL WBT WBR NBL NBT NBR SBL SBT SBR<br />
Lane Configurations<br />
Volume (vph) 0 0 0 12 594 19 80 96 0 0 94 55<br />
Ideal Flow (vphpl) 1900 1900 1900 1900 1900 1900 1900 1900 1900 1900 1900 1900<br />
Lane Width 12 12 12 12 11 12 12 12 12 12 12 12<br />
Total Lost time (s) 3.9 4.2 4.2 4.2<br />
Lane Util. Factor 0.86 1.00 1.00 1.00<br />
Frt 1.00 1.00 1.00 0.95<br />
Flt Protected 1.00 0.95 1.00 1.00<br />
Satd. Flow (prot) 6161 1770 1863 1771<br />
Flt Permitted 1.00 0.55 1.00 1.00<br />
Satd. Flow (perm) 6161 1017 1863 1771<br />
Peak-hour factor, PHF 1.00 1.00 1.00 0.68 0.81 0.85 0.76 0.81 1.00 1.00 0.76 0.78<br />
Adj. Flow (vph) 0 0 0 18 733 22 105 119 0 0 124 71<br />
RTOR Reduction (vph) 0 0 0 0 4 0 0 0 0 0 43 0<br />
Lane Group Flow (vph) 0 0 0 0 769 0 105 119 0 0 152 0<br />
Turn Type Perm NA Perm NA NA<br />
Protected Phases 6 8 4<br />
Permitted Phases 6 8<br />
Actuated Green, G (s) 38.6 10.8 10.8 10.8<br />
Effective Green, g (s) 40.1 11.8 11.8 11.8<br />
Actuated g/C Ratio 0.67 0.20 0.20 0.20<br />
Clearance Time (s) 5.4 5.2 5.2 5.2<br />
Vehicle Extension (s) 3.0 3.0 3.0 3.0<br />
Lane Grp Cap (vph) 4117 200 366 348<br />
v/s Ratio Prot 0.06 0.09<br />
v/s Ratio Perm 0.12 c0.10<br />
v/c Ratio 0.19 0.53 0.33 0.44<br />
Uniform Delay, d1 3.8 21.6 20.7 21.2<br />
Progression Factor 1.00 0.89 0.88 1.00<br />
Incremental Delay, d2 0.1 2.4 0.5 0.9<br />
Delay (s) 3.9 21.6 18.7 22.1<br />
Level <strong>of</strong> Service A C B C<br />
Approach Delay (s) 0.0 3.9 20.1 22.1<br />
Approach LOS A A C C<br />
Intersection Summary<br />
HCM 2000 Control Delay 9.9 HCM 2000 Level <strong>of</strong> Service A<br />
HCM 2000 Volume to Capacity ratio 0.26<br />
Actuated Cycle Length (s) <strong>60</strong>.0 Sum <strong>of</strong> lost time (s) 8.1<br />
Intersection Capacity Utilization 33.3% ICU Level <strong>of</strong> Service A<br />
Analysis Period (min) 15<br />
c Critical Lane Group<br />
PM Peak 5:00 pm 11/9/2012 2012 Existing Conditions Synchro 8 Report<br />
Page 10