sr 60 “twin pairs” - City of Vero Beach
sr 60 “twin pairs” - City of Vero Beach
sr 60 “twin pairs” - City of Vero Beach

Create successful ePaper yourself
Turn your PDF publications into a flip-book with our unique Google optimized e-Paper software.
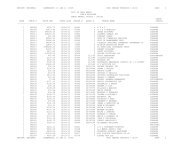
HCM Signalized Intersection Capacity Analysis<br />
9: SR <strong>60</strong> WB & 11 Avenue<br />
11/13/2012<br />
Movement EBL EBT EBR WBL WBT WBR NBL NBT NBR SBL SBT SBR<br />
Lane Configurations<br />
Volume (vph) 0 0 0 15 748 46 19 97 0 0 34 35<br />
Ideal Flow (vphpl) 1900 1900 1900 1900 1900 1900 1900 1900 1900 1900 1900 1900<br />
Lane Width 12 12 12 12 11 12 12 12 12 12 12 12<br />
Total Lost time (s) 3.9 4.0 4.2 4.2 4.2<br />
Lane Util. Factor 0.86 1.00 1.00 1.00 1.00<br />
Frt 0.99 1.00 1.00 1.00 0.85<br />
Flt Protected 1.00 0.95 1.00 1.00 1.00<br />
Satd. Flow (prot) 6124 1770 1863 1863 1583<br />
Flt Permitted 1.00 0.50 1.00 1.00 1.00<br />
Satd. Flow (perm) 6124 925 1863 1863 1583<br />
Peak-hour factor, PHF 1.00 1.00 1.00 0.70 0.87 0.71 0.75 0.73 1.00 1.00 0.92 0.92<br />
Adj. Flow (vph) 0 0 0 21 8<strong>60</strong> 65 25 133 0 0 37 38<br />
RTOR Reduction (vph) 0 0 0 0 13 0 0 0 0 0 0 33<br />
Lane Group Flow (vph) 0 0 0 0 933 0 25 133 0 0 37 5<br />
Turn Type Perm NA pm+pt NA NA Perm<br />
Protected Phases 6 3 8 4<br />
Permitted Phases 6 8 4<br />
Actuated Green, G (s) 35.6 13.8 13.8 7.4 7.4<br />
Effective Green, g (s) 37.1 14.8 14.8 8.4 8.4<br />
Actuated g/C Ratio 0.62 0.25 0.25 0.14 0.14<br />
Clearance Time (s) 5.4 5.0 5.2 5.2 5.2<br />
Vehicle Extension (s) 3.0 3.0 3.0 3.0 3.0<br />
Lane Grp Cap (vph) 3786 261 459 2<strong>60</strong> 221<br />
v/s Ratio Prot 0.00 c0.07 0.02<br />
v/s Ratio Perm 0.15 0.02 0.00<br />
v/c Ratio 0.25 0.10 0.29 0.14 0.02<br />
Uniform Delay, d1 5.2 17.4 18.3 22.6 22.3<br />
Progression Factor 0.89 1.03 1.01 1.00 1.00<br />
Incremental Delay, d2 0.2 0.2 0.4 0.3 0.0<br />
Delay (s) 4.8 18.1 18.9 22.9 22.3<br />
Level <strong>of</strong> Service A B B C C<br />
Approach Delay (s) 0.0 4.8 18.8 22.6<br />
Approach LOS A A B C<br />
Intersection Summary<br />
HCM 2000 Control Delay 7.8 HCM 2000 Level <strong>of</strong> Service A<br />
HCM 2000 Volume to Capacity ratio 0.28<br />
Actuated Cycle Length (s) <strong>60</strong>.0 Sum <strong>of</strong> lost time (s) 12.1<br />
Intersection Capacity Utilization 34.7% ICU Level <strong>of</strong> Service A<br />
Analysis Period (min) 15<br />
c Critical Lane Group<br />
PM Peak 5:00 pm 11/9/2012 2012 Existing Conditions Synchro 8 Report<br />
Page 9