sr 60 “twin pairs” - City of Vero Beach
sr 60 “twin pairs” - City of Vero Beach
sr 60 “twin pairs” - City of Vero Beach

You also want an ePaper? Increase the reach of your titles
YUMPU automatically turns print PDFs into web optimized ePapers that Google loves.
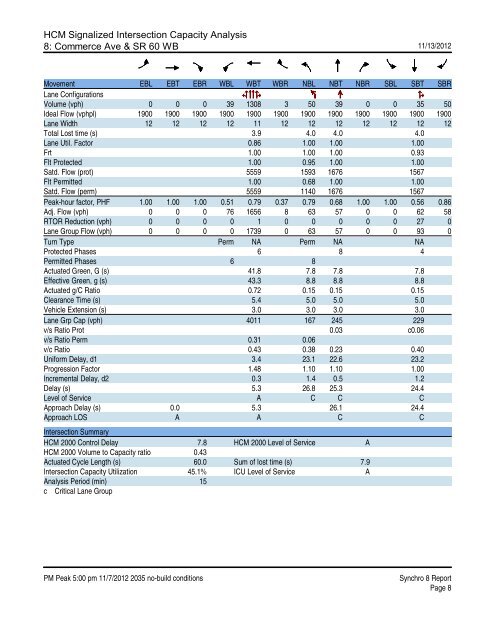
HCM Signalized Intersection Capacity Analysis<br />
8: Commerce Ave & SR <strong>60</strong> WB<br />
11/13/2012<br />
Movement EBL EBT EBR WBL WBT WBR NBL NBT NBR SBL SBT SBR<br />
Lane Configurations<br />
Volume (vph) 0 0 0 39 1308 3 50 39 0 0 35 50<br />
Ideal Flow (vphpl) 1900 1900 1900 1900 1900 1900 1900 1900 1900 1900 1900 1900<br />
Lane Width 12 12 12 12 11 12 12 12 12 12 12 12<br />
Total Lost time (s) 3.9 4.0 4.0 4.0<br />
Lane Util. Factor 0.86 1.00 1.00 1.00<br />
Frt 1.00 1.00 1.00 0.93<br />
Flt Protected 1.00 0.95 1.00 1.00<br />
Satd. Flow (prot) 5559 1593 1676 1567<br />
Flt Permitted 1.00 0.68 1.00 1.00<br />
Satd. Flow (perm) 5559 1140 1676 1567<br />
Peak-hour factor, PHF 1.00 1.00 1.00 0.51 0.79 0.37 0.79 0.68 1.00 1.00 0.56 0.86<br />
Adj. Flow (vph) 0 0 0 76 1656 8 63 57 0 0 62 58<br />
RTOR Reduction (vph) 0 0 0 0 1 0 0 0 0 0 27 0<br />
Lane Group Flow (vph) 0 0 0 0 1739 0 63 57 0 0 93 0<br />
Turn Type Perm NA Perm NA NA<br />
Protected Phases 6 8 4<br />
Permitted Phases 6 8<br />
Actuated Green, G (s) 41.8 7.8 7.8 7.8<br />
Effective Green, g (s) 43.3 8.8 8.8 8.8<br />
Actuated g/C Ratio 0.72 0.15 0.15 0.15<br />
Clearance Time (s) 5.4 5.0 5.0 5.0<br />
Vehicle Extension (s) 3.0 3.0 3.0 3.0<br />
Lane Grp Cap (vph) 4011 167 245 229<br />
v/s Ratio Prot 0.03 c0.06<br />
v/s Ratio Perm 0.31 0.06<br />
v/c Ratio 0.43 0.38 0.23 0.40<br />
Uniform Delay, d1 3.4 23.1 22.6 23.2<br />
Progression Factor 1.48 1.10 1.10 1.00<br />
Incremental Delay, d2 0.3 1.4 0.5 1.2<br />
Delay (s) 5.3 26.8 25.3 24.4<br />
Level <strong>of</strong> Service A C C C<br />
Approach Delay (s) 0.0 5.3 26.1 24.4<br />
Approach LOS A A C C<br />
Intersection Summary<br />
HCM 2000 Control Delay 7.8 HCM 2000 Level <strong>of</strong> Service A<br />
HCM 2000 Volume to Capacity ratio 0.43<br />
Actuated Cycle Length (s) <strong>60</strong>.0 Sum <strong>of</strong> lost time (s) 7.9<br />
Intersection Capacity Utilization 45.1% ICU Level <strong>of</strong> Service A<br />
Analysis Period (min) 15<br />
c Critical Lane Group<br />
PM Peak 5:00 pm 11/7/2012 2035 no-build conditions Synchro 8 Report<br />
Page 8