marc lémann,* jean–yves mary,‡ bernard duclos,§ michel - IG-IBD
marc lémann,* jean–yves mary,‡ bernard duclos,§ michel - IG-IBD
marc lémann,* jean–yves mary,‡ bernard duclos,§ michel - IG-IBD

Create successful ePaper yourself
Turn your PDF publications into a flip-book with our unique Google optimized e-Paper software.
April 2006 INFLIXIMAB AND AZATHIOPRINE 1057<br />
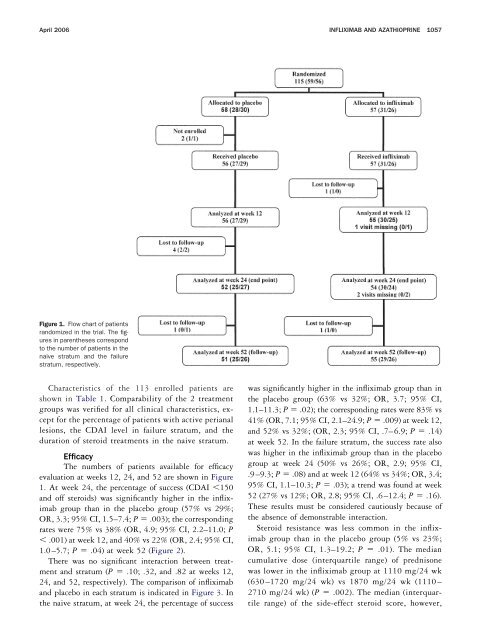
Figure 1. Flow chart of patients<br />
randomized in the trial. The figures<br />
in parentheses correspond<br />
to the number of patients in the<br />
naive stratum and the failure<br />
stratum, respectively.<br />
Characteristics of the 113 enrolled patients are<br />
shown in Table 1. Comparability of the 2 treatment<br />
groups was verified for all clinical characteristics, except<br />
for the percentage of patients with active perianal<br />
lesions, the CDAI level in failure stratum, and the<br />
duration of steroid treatments in the naive stratum.<br />
Efficacy<br />
The numbers of patients available for efficacy<br />
evaluation at weeks 12, 24, and 52 are shown in Figure<br />
1. At week 24, the percentage of success (CDAI 150<br />
and off steroids) was significantly higher in the infliximab<br />
group than in the placebo group (57% vs 29%;<br />
OR, 3.3; 95% CI, 1.5–7.4; P .003); the corresponding<br />
rates were 75% vs 38% (OR, 4.9; 95% CI, 2.2–11.0; P<br />
.001) at week 12, and 40% vs 22% (OR, 2.4; 95% CI,<br />
1.0–5.7; P .04) at week 52 (Figure 2).<br />
There was no significant interaction between treatment<br />
and stratum (P .10; .32, and .82 at weeks 12,<br />
24, and 52, respectively). The comparison of infliximab<br />
and placebo in each stratum is indicated in Figure 3. In<br />
the naive stratum, at week 24, the percentage of success<br />
was significantly higher in the infliximab group than in<br />
the placebo group (63% vs 32%; OR, 3.7; 95% CI,<br />
1.1–11.3; P .02); the corresponding rates were 83% vs<br />
41% (OR, 7.1; 95% CI, 2.1–24.9; P .009) at week 12,<br />
and 52% vs 32%; (OR, 2.3; 95% CI, .7–6.9; P .14)<br />
at week 52. In the failure stratum, the success rate also<br />
was higher in the infliximab group than in the placebo<br />
group at week 24 (50% vs 26%; OR, 2.9; 95% CI,<br />
.9–9.3; P .08) and at week 12 (64% vs 34%; OR, 3.4;<br />
95% CI, 1.1–10.3; P .03); a trend was found at week<br />
52 (27% vs 12%; OR, 2.8; 95% CI, .6–12.4; P .16).<br />
These results must be considered cautiously because of<br />
the absence of demonstrable interaction.<br />
Steroid resistance was less common in the infliximab<br />
group than in the placebo group (5% vs 23%;<br />
OR, 5.1; 95% CI, 1.3–19.2; P .01). The median<br />
cumulative dose (interquartile range) of prednisone<br />
was lower in the infliximab group at 1110 mg/24 wk<br />
(630–1720 mg/24 wk) vs 1870 mg/24 wk (1110–<br />
2710 mg/24 wk) (P .002). The median (interquartile<br />
range) of the side-effect steroid score, however,