The State of Working Pennsylvania 2004 - The Keystone Research ...
The State of Working Pennsylvania 2004 - The Keystone Research ...
The State of Working Pennsylvania 2004 - The Keystone Research ...

You also want an ePaper? Increase the reach of your titles
YUMPU automatically turns print PDFs into web optimized ePapers that Google loves.
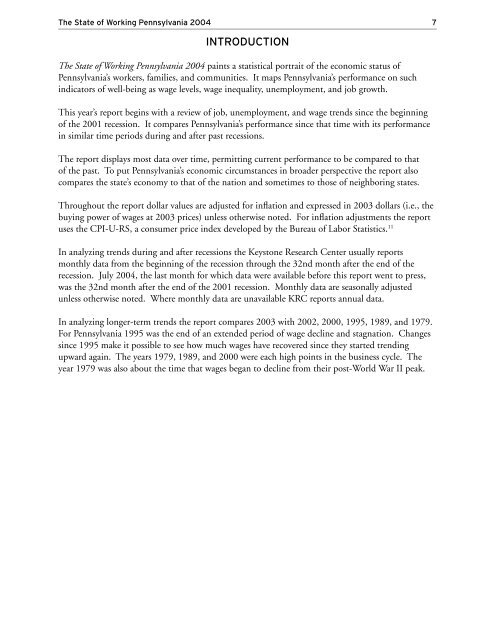
<strong>The</strong> <strong>State</strong> <strong>of</strong> <strong>Working</strong> <strong>Pennsylvania</strong> <strong>2004</strong> 7<br />
INTRODUCTION<br />
<strong>The</strong> <strong>State</strong> <strong>of</strong> <strong>Working</strong> <strong>Pennsylvania</strong> <strong>2004</strong> paints a statistical portrait <strong>of</strong> the economic status <strong>of</strong><br />
<strong>Pennsylvania</strong>’s workers, families, and communities. It maps <strong>Pennsylvania</strong>’s performance on such<br />
indicators <strong>of</strong> well-being as wage levels, wage inequality, unemployment, and job growth.<br />
This year’s report begins with a review <strong>of</strong> job, unemployment, and wage trends since the beginning<br />
<strong>of</strong> the 2001 recession. It compares <strong>Pennsylvania</strong>’s performance since that time with its performance<br />
in similar time periods during and after past recessions.<br />
<strong>The</strong> report displays most data over time, permitting current performance to be compared to that<br />
<strong>of</strong> the past. To put <strong>Pennsylvania</strong>’s economic circumstances in broader perspective the report also<br />
compares the state’s economy to that <strong>of</strong> the nation and sometimes to those <strong>of</strong> neighboring states.<br />
Throughout the report dollar values are adjusted for inflation and expressed in 2003 dollars (i.e., the<br />
buying power <strong>of</strong> wages at 2003 prices) unless otherwise noted. For inflation adjustments the report<br />
uses the CPI-U-RS, a consumer price index developed by the Bureau <strong>of</strong> Labor Statistics. 11<br />
In analyzing trends during and after recessions the <strong>Keystone</strong> <strong>Research</strong> Center usually reports<br />
monthly data from the beginning <strong>of</strong> the recession through the 32nd month after the end <strong>of</strong> the<br />
recession. July <strong>2004</strong>, the last month for which data were available before this report went to press,<br />
was the 32nd month after the end <strong>of</strong> the 2001 recession. Monthly data are seasonally adjusted<br />
unless otherwise noted. Where monthly data are unavailable KRC reports annual data.<br />
In analyzing longer-term trends the report compares 2003 with 2002, 2000, 1995, 1989, and 1979.<br />
For <strong>Pennsylvania</strong> 1995 was the end <strong>of</strong> an extended period <strong>of</strong> wage decline and stagnation. Changes<br />
since 1995 make it possible to see how much wages have recovered since they started trending<br />
upward again. <strong>The</strong> years 1979, 1989, and 2000 were each high points in the business cycle. <strong>The</strong><br />
year 1979 was also about the time that wages began to decline from their post-World War II peak.