The State of Working Pennsylvania 2004 - The Keystone Research ...
The State of Working Pennsylvania 2004 - The Keystone Research ...
The State of Working Pennsylvania 2004 - The Keystone Research ...

Create successful ePaper yourself
Turn your PDF publications into a flip-book with our unique Google optimized e-Paper software.
<strong>The</strong> <strong>State</strong> <strong>of</strong> <strong>Working</strong> <strong>Pennsylvania</strong> <strong>2004</strong> 31<br />
<strong>Pennsylvania</strong>’s average annual job growth ranking improved from 44 th during 1979-1989 and 1989-<br />
2000 to 41 st during 1995-2000 to 29 th during 2002-2003 (when the state lost jobs at about the same<br />
rate as the entire U.S.) before slipping back to 40 th from 2002-2003.<br />
Erie and Reading Lose Jobs Fastest Since Recession Began; Altoona, Harrisburg,<br />
and Philadelphia Suburbs Gain<br />
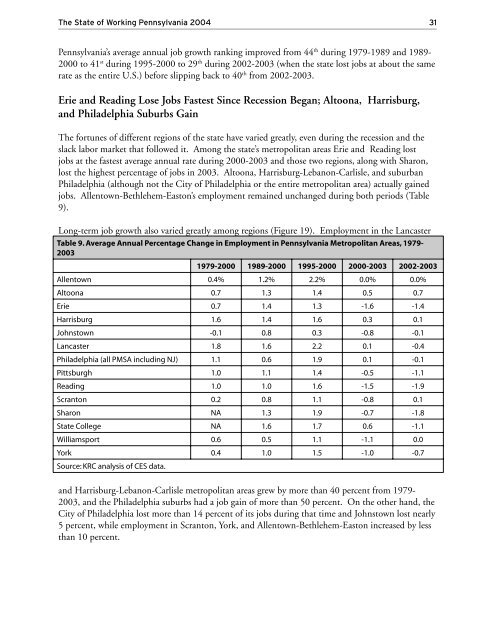
<strong>The</strong> fortunes <strong>of</strong> different regions <strong>of</strong> the state have varied greatly, even during the recession and the<br />
slack labor market that followed it. Among the state’s metropolitan areas Erie and Reading lost<br />
jobs at the fastest average annual rate during 2000-2003 and those two regions, along with Sharon,<br />
lost the highest percentage <strong>of</strong> jobs in 2003. Altoona, Harrisburg-Lebanon-Carlisle, and suburban<br />
Philadelphia (although not the City <strong>of</strong> Philadelphia or the entire metropolitan area) actually gained<br />
jobs. Allentown-Bethlehem-Easton’s employment remained unchanged during both periods (Table<br />
9).<br />
Long-term job growth also varied greatly among regions (Figure 19). Employment in the Lancaster<br />
Table 9. Average Annual Percentage Change in Employment in <strong>Pennsylvania</strong> Metropolitan Areas, 1979-<br />
2003<br />
1979-2000 1989-2000 1995-2000 2000-2003 2002-2003<br />
Allentown 0.4% 1.2% 2.2% 0.0% 0.0%<br />
Altoona 0.7 1.3 1.4 0.5 0.7<br />
Erie 0.7 1.4 1.3 -1.6 -1.4<br />
Harrisburg 1.6 1.4 1.6 0.3 0.1<br />
Johnstown -0.1 0.8 0.3 -0.8 -0.1<br />
Lancaster 1.8 1.6 2.2 0.1 -0.4<br />
Philadelphia (all PMSA including NJ) 1.1 0.6 1.9 0.1 -0.1<br />
Pittsburgh 1.0 1.1 1.4 -0.5 -1.1<br />
Reading 1.0 1.0 1.6 -1.5 -1.9<br />
Scranton 0.2 0.8 1.1 -0.8 0.1<br />
Sharon NA 1.3 1.9 -0.7 -1.8<br />
<strong>State</strong> College NA 1.6 1.7 0.6 -1.1<br />
Williamsport 0.6 0.5 1.1 -1.1 0.0<br />
York 0.4 1.0 1.5 -1.0 -0.7<br />
Source: KRC analysis <strong>of</strong> CES data.<br />
and Harrisburg-Lebanon-Carlisle metropolitan areas grew by more than 40 percent from 1979-<br />
2003, and the Philadelphia suburbs had a job gain <strong>of</strong> more than 50 percent. On the other hand, the<br />
City <strong>of</strong> Philadelphia lost more than 14 percent <strong>of</strong> its jobs during that time and Johnstown lost nearly<br />
5 percent, while employment in Scranton, York, and Allentown-Bethlehem-Easton increased by less<br />
than 10 percent.