The State of Working Pennsylvania 2004 - The Keystone Research ...
The State of Working Pennsylvania 2004 - The Keystone Research ...
The State of Working Pennsylvania 2004 - The Keystone Research ...

Create successful ePaper yourself
Turn your PDF publications into a flip-book with our unique Google optimized e-Paper software.
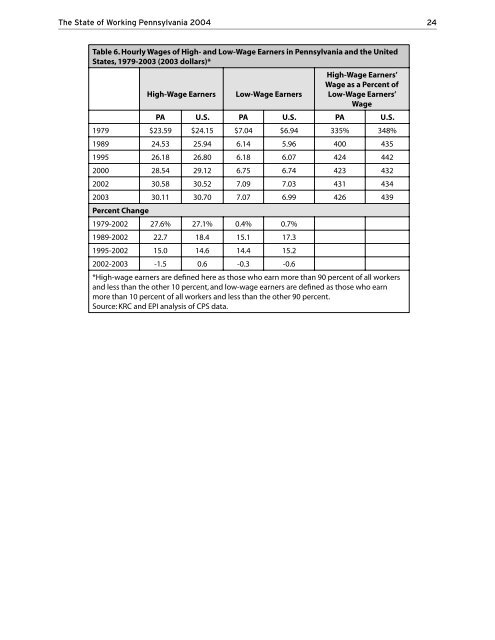
<strong>The</strong> <strong>State</strong> <strong>of</strong> <strong>Working</strong> <strong>Pennsylvania</strong> <strong>2004</strong> 24<br />
Table 6. Hourly Wages <strong>of</strong> High- and Low-Wage Earners in <strong>Pennsylvania</strong> and the United<br />
<strong>State</strong>s, 1979-2003 (2003 dollars)*<br />
High-Wage Earners Low-Wage Earners<br />
High-Wage Earners’<br />
Wage as a Percent <strong>of</strong><br />
Low-Wage Earners’<br />
Wage<br />
PA U.S. PA U.S. PA U.S.<br />
1979 $23.59 $24.15 $7.04 $6.94 335% 348%<br />
1989 24.53 25.94 6.14 5.96 400 435<br />
1995 26.18 26.80 6.18 6.07 424 442<br />
2000 28.54 29.12 6.75 6.74 423 432<br />
2002 30.58 30.52 7.09 7.03 431 434<br />
2003 30.11 30.70 7.07 6.99 426 439<br />
Percent Change<br />
1979-2002 27.6% 27.1% 0.4% 0.7%<br />
1989-2002 22.7 18.4 15.1 17.3<br />
1995-2002 15.0 14.6 14.4 15.2<br />
2002-2003 -1.5 0.6 -0.3 -0.6<br />
*High-wage earners are defined here as those who earn more than 90 percent <strong>of</strong> all workers<br />
and less than the other 10 percent, and low-wage earners are defined as those who earn<br />
more than 10 percent <strong>of</strong> all workers and less than the other 90 percent.<br />
Source: KRC and EPI analysis <strong>of</strong> CPS data.