The State of Working Pennsylvania 2004 - The Keystone Research ...
The State of Working Pennsylvania 2004 - The Keystone Research ...
The State of Working Pennsylvania 2004 - The Keystone Research ...

You also want an ePaper? Increase the reach of your titles
YUMPU automatically turns print PDFs into web optimized ePapers that Google loves.
<strong>The</strong> <strong>State</strong> <strong>of</strong> <strong>Working</strong> <strong>Pennsylvania</strong> <strong>2004</strong> 21<br />
WHITE<br />
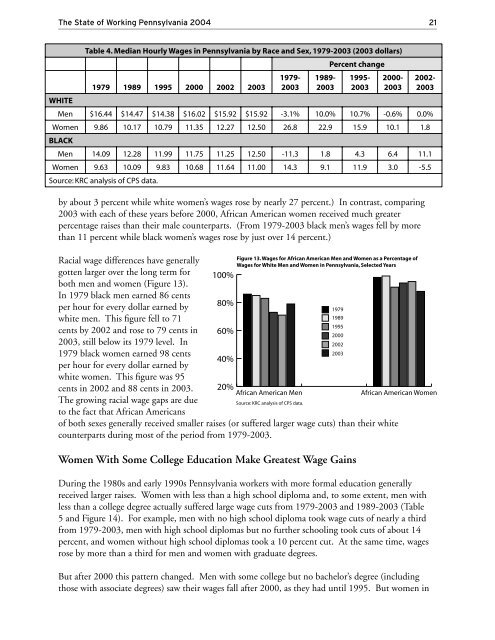
Table 4. Median Hourly Wages in <strong>Pennsylvania</strong> by Race and Sex, 1979-2003 (2003 dollars)<br />
1979 1989 1995 2000 2002 2003<br />
by about 3 percent while white women’s wages rose by nearly 27 percent.) In contrast, comparing<br />
2003 with each <strong>of</strong> these years before 2000, African American women received much greater<br />
percentage raises than their male counterparts. (From 1979-2003 black men’s wages fell by more<br />
than 11 percent while black women’s wages rose by just over 14 percent.)<br />
Racial wage differences have generally<br />
gotten larger over the long term for<br />
both men and women (Figure 13).<br />
In 1979 black men earned 86 cents<br />
per hour for every dollar earned by<br />
white men. This figure fell to 71<br />
cents by 2002 and rose to 79 cents in<br />
2003, still below its 1979 level. In<br />
1979 black women earned 98 cents<br />
per hour for every dollar earned by<br />
white women. This figure was 95<br />
cents in 2002 and 88 cents in 2003.<br />
<strong>The</strong> growing racial wage gaps are due<br />
to the fact that African Americans<br />
<br />
<br />
<br />
<br />
<br />
1979-<br />
2003<br />
<br />
<br />
<br />
<br />
1989-<br />
2003<br />
<strong>of</strong> both sexes generally received smaller raises (or suffered larger wage cuts) than their white<br />
counterparts during most <strong>of</strong> the period from 1979-2003.<br />
Women With Some College Education Make Greatest Wage Gains<br />
Percent change<br />
<br />
During the 1980s and early 1990s <strong>Pennsylvania</strong> workers with more formal education generally<br />
received larger raises. Women with less than a high school diploma and, to some extent, men with<br />
less than a college degree actually suffered large wage cuts from 1979-2003 and 1989-2003 (Table<br />
5 and Figure 14). For example, men with no high school diploma took wage cuts <strong>of</strong> nearly a third<br />
from 1979-2003, men with high school diplomas but no further schooling took cuts <strong>of</strong> about 14<br />
percent, and women without high school diplomas took a 10 percent cut. At the same time, wages<br />
rose by more than a third for men and women with graduate degrees.<br />
But after 2000 this pattern changed. Men with some college but no bachelor’s degree (including<br />
those with associate degrees) saw their wages fall after 2000, as they had until 1995. But women in<br />
<br />
<br />
<br />
<br />
<br />
<br />
1995-<br />
2003<br />
2000-<br />
2003<br />
2002-<br />
2003<br />
Men $16.44 $14.47 $14.38 $16.02 $15.92 $15.92 -3.1% 10.0% 10.7% -0.6% 0.0%<br />
Women 9.86 10.17 10.79 11.35 12.27 12.50 26.8 22.9 15.9 10.1 1.8<br />
BLACK<br />
Men 14.09 12.28 11.99 11.75 11.25 12.50 -11.3 1.8 4.3 6.4 11.1<br />
Women 9.63 10.09 9.83 10.68 11.64 11.00 14.3 9.1 11.9 3.0 -5.5<br />
Source: KRC analysis <strong>of</strong> CPS data.