ECE 401L COMMUNICATIONS LABORATORY LAB 7 - University of ...
ECE 401L COMMUNICATIONS LABORATORY LAB 7 - University of ...
ECE 401L COMMUNICATIONS LABORATORY LAB 7 - University of ...

You also want an ePaper? Increase the reach of your titles
YUMPU automatically turns print PDFs into web optimized ePapers that Google loves.
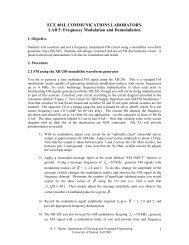
Figure 1: (top) Noncoherent demodulation <strong>of</strong> FSK (bottom) coherent demodulation <strong>of</strong> FSK.<br />
2. Prelab Assignment<br />
You should create a preliminary design for your FSK demodulator. Refinements to the design<br />
may be required as you construct and test your circuit. The design can be done as a lab group or<br />
individually. Prepare and submit a clear schematic for your design (at least one per lab group).<br />
Specify the key design equations used for each module in the design (i.e., BPF center frequency,<br />
BPF bandwidth, BPF Q-factor, time constant <strong>of</strong> envelope detectors, etc).<br />
3. Procedure<br />
3.1 BPF<br />
It is recommended that you construct your circuit in modules and test each module. In particular,<br />
construct each BPF and test the frequency response. Make sure the center frequency <strong>of</strong> each is<br />
very close to the desired frequency (note the two center frequencies are only 200 Hz apart). You<br />
may need to adjust your resistor values (possibly with a potentiometer for R3 to tune the BPF<br />
center frequencies). Once you are satisfied with the frequency response you observe, collect at<br />
least 10 magnitude frequency response measurements (output peak-to-peak voltage divided by<br />
input peak-to-peak voltage) around the center frequency <strong>of</strong> each BPF and generate a magnitude<br />
frequency response plot for each BPF. Do the BPFs behave as expected? It will be helpful to<br />
show the two frequency-response plots on the same axis in your report, since they work as a pair.<br />
Generate an FSK signal with the waveform generator. Be sure to correctly enter the two<br />
frequencies. Set the FSK rate (1/2 the bit rate) initially to 10 Hz to make it easier to test and<br />
debug your circuit. Inspect the output <strong>of</strong> one BPF on Channel 1 and the output <strong>of</strong> the other on<br />
Channel 2. One BPF output should have a large amplitude, while the other is small, and vice<br />
versa. If the BPFs appear to be working correctly, increase the FSK rate to 150 Hz (300 bits per<br />
second). Capture the outputs <strong>of</strong> the two BPFs simultaneously at this V.21 rate for your report.<br />
R. C. Hardie, Department <strong>of</strong> Electrical and Computer Engineering,<br />
<strong>University</strong> <strong>of</strong> Dayton, Fall 2003<br />
2