The impact of subdivision and sedentarization of ... - Land Portal
The impact of subdivision and sedentarization of ... - Land Portal
The impact of subdivision and sedentarization of ... - Land Portal

You also want an ePaper? Increase the reach of your titles
YUMPU automatically turns print PDFs into web optimized ePapers that Google loves.
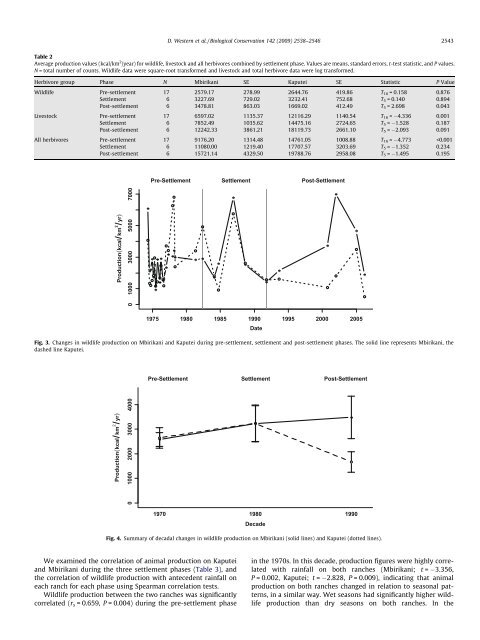
Table 2<br />
Average production values (kcal/km 2 /year) for wildlife, livestock <strong>and</strong> all herbivores combined by settlement phase. Values are means, st<strong>and</strong>ard errors, t-test statistic, <strong>and</strong> P values.<br />
N = total number <strong>of</strong> counts. Wildlife data were square-root transformed <strong>and</strong> livestock <strong>and</strong> total herbivore data were log transformed.<br />
Herbivore group Phase N Mbirikani SE Kaputei SE Statistic P Value<br />
Wildlife Pre-settlement 17 2579.17 278.99 2644.76 419.86 T16 = 0.158 0.876<br />
Settlement 6 3227.69 729.02 3232.41 752.68 T 5 = 0.140 0.894<br />
Post-settlement 6 3478.81 863.03 1669.02 412.49 T 5 = 2.698 0.043<br />
Livestock Pre-settlement 17 6597.02 1135.37 12116.29 1140.54 T 16 = 4.336 0.001<br />
Settlement 6 7852.49 1035.62 14475.16 2724.65 T 5 = 1.528 0.187<br />
Post-settlement 6 12242.33 3861.21 18119.73 2661.10 T 5 = 2.093 0.091<br />
All herbivores Pre-settlement 17 9176.20 1314.48 14761.05 1008.88 T16 = 4.773