The impact of subdivision and sedentarization of ... - Land Portal
The impact of subdivision and sedentarization of ... - Land Portal
The impact of subdivision and sedentarization of ... - Land Portal

You also want an ePaper? Increase the reach of your titles
YUMPU automatically turns print PDFs into web optimized ePapers that Google loves.
2544 D. Western et al. / Biological Conservation 142 (2009) 2538–2546<br />
Table 3<br />
Spearman correlation tests <strong>of</strong> differences in wildlife, livestock <strong>and</strong> total herbivore<br />
production between Kaputei <strong>and</strong> Mbirikani during all three settlement phases.<br />
Phase N Wildlife Livestock Total herbivores<br />
subsequent settlement <strong>and</strong> post-settlement phases however, the<br />
correlation in wildlife production between Kaputei <strong>and</strong> Mbirikani<br />
declined to insignificance (Table 3). <strong>The</strong> divergence in seasonality<br />
corresponds to a declining abundance <strong>and</strong> mobility <strong>of</strong> wildlife on<br />
Kaputei.<br />
Neither livestock nor total herbivore production was significantly<br />
correlated with rainfall or between Kaputei <strong>and</strong> Mbirikani<br />
during any settlement phase (Table 4), indicating that livestock<br />
use <strong>of</strong> both ranches, unlike wildlife, did not vary seasonally.<br />
3.2. Wildlife responses to human activity<br />
rs P Value rs P Value rs P Value<br />
Pre-settlement 17 0.66 0.004 0.32 0.209 0.31 0.224<br />
Settlement 6 0.77 0.072 0.03 0.957 0.03 0.957<br />
Post-settlement 6 0.66 0.156 0.37 0.468 0.66 0.156<br />
Having demonstrated that wildlife numbers <strong>and</strong> production declined<br />
significantly on Kaputei <strong>and</strong> increased on Mbirikani, we<br />
investigated factors that might account for the decline, including<br />
the rate <strong>of</strong> change in human population, settlement numbers, the<br />
spatial spread <strong>of</strong> settlements (i.e. the proportion <strong>of</strong> grid cells occupied<br />
by settlement), <strong>and</strong> changes in the livestock population.<br />
To test whether the divergence in wildlife production on Kaputei<br />
<strong>and</strong> Mbirikani can be explained by differences in settlement<br />
intensity or human population growth, we looked at wildlife re-<br />
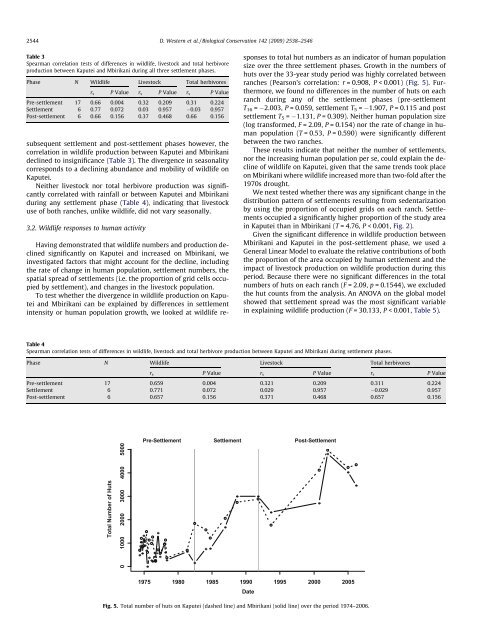
Total Number <strong>of</strong> Huts<br />
0 1000 2000 3000 4000 5000<br />
Pre-Settlement Settlement Post-Settlement<br />
sponses to total hut numbers as an indicator <strong>of</strong> human population<br />
size over the three settlement phases. Growth in the numbers <strong>of</strong><br />
huts over the 33-year study period was highly correlated between<br />
ranches (Pearson’s correlation: r = 0.908, P < 0.001) (Fig. 5). Furthermore,<br />
we found no differences in the number <strong>of</strong> huts on each<br />
ranch during any <strong>of</strong> the settlement phases (pre-settlement<br />
T16 = 2.003, P = 0.059, settlement T5 = 1.907, P = 0.115 <strong>and</strong> post<br />
settlement T 5 = 1.131, P = 0.309). Neither human population size<br />
(log transformed, F = 2.09, P = 0.154) nor the rate <strong>of</strong> change in human<br />
population (T = 0.53, P = 0.590) were significantly different<br />
between the two ranches.<br />
<strong>The</strong>se results indicate that neither the number <strong>of</strong> settlements,<br />
nor the increasing human population per se, could explain the decline<br />
<strong>of</strong> wildlife on Kaputei, given that the same trends took place<br />
on Mbirikani where wildlife increased more than two-fold after the<br />
1970s drought.<br />
We next tested whether there was any significant change in the<br />
distribution pattern <strong>of</strong> settlements resulting from <strong>sedentarization</strong><br />
by using the proportion <strong>of</strong> occupied grids on each ranch. Settlements<br />
occupied a significantly higher proportion <strong>of</strong> the study area<br />
in Kaputei than in Mbirikani (T = 4.76, P < 0.001, Fig. 2).<br />
Given the significant difference in wildlife production between<br />
Mbirikani <strong>and</strong> Kaputei in the post-settlement phase, we used a<br />
General Linear Model to evaluate the relative contributions <strong>of</strong> both<br />
the proportion <strong>of</strong> the area occupied by human settlement <strong>and</strong> the<br />
<strong>impact</strong> <strong>of</strong> livestock production on wildlife production during this<br />
period. Because there were no significant differences in the total<br />
numbers <strong>of</strong> huts on each ranch (F = 2.09, p = 0.1544), we excluded<br />
the hut counts from the analysis. An ANOVA on the global model<br />
showed that settlement spread was the most significant variable<br />
in explaining wildlife production (F = 30.133, P < 0.001, Table 5).<br />
Table 4<br />
Spearman correlation tests <strong>of</strong> differences in wildlife, livestock <strong>and</strong> total herbivore production between Kaputei <strong>and</strong> Mbirikani during settlement phases.<br />
Phase N Wildlife Livestock Total herbivores<br />
rs P Value rs P Value rs P Value<br />
Pre-settlement 17 0.659 0.004 0.321 0.209 0.311 0.224<br />
Settlement 6 0.771 0.072 0.029 0.957 0.029 0.957<br />
Post-settlement 6 0.657 0.156 0.371 0.468 0.657 0.156<br />
1975 1980 1985 1990<br />
Date<br />
1995 2000 2005<br />
Fig. 5. Total number <strong>of</strong> huts on Kaputei (dashed line) <strong>and</strong> Mbirikani (solid line) over the period 1974–2006.