2. The Thermal Conductivity Detector (TCD) - Eawag-Empa Library
2. The Thermal Conductivity Detector (TCD) - Eawag-Empa Library
2. The Thermal Conductivity Detector (TCD) - Eawag-Empa Library
Create successful ePaper yourself
Turn your PDF publications into a flip-book with our unique Google optimized e-Paper software.
<strong>2.</strong> <strong>The</strong> <strong>The</strong>rmal <strong>Conductivity</strong> <strong>Detector</strong> (<strong>TCD</strong>)<br />
<strong>2.</strong>1 DETECTION MECHANISM<br />
<strong>The</strong> thermal conductivity detector is among the most commonly used measuring<br />
devices in gas chromatography for monitoring substances separated in the column.<br />
This detector measures changes in the thermal conductivity of the carrier gas, caused<br />
by the presence of the eluted substances.<br />
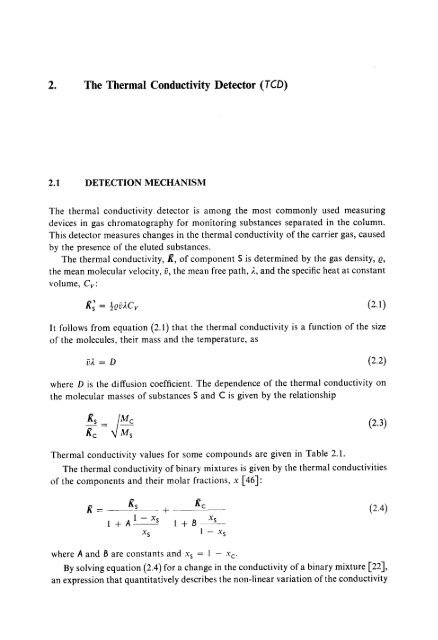
<strong>The</strong> thermal conductivity, If, of component S is determined by the gas density, e,<br />
the mean molecular velocity, ij, the mean free path, 2, and the specific heat at constant<br />
volume, Cv:<br />
It follows from equation (<strong>2.</strong>1) that the thermal conductivity is a function of the size<br />
of the molecules, their mass and the temperature, as<br />
where D is the diffusion coefficient. <strong>The</strong> dependence of the thermal conductivity on<br />
the molecular masses of substances S and C is given by the relationship<br />
<strong>The</strong>rmal conductivity values for some compounds are given in Table <strong>2.</strong>1.<br />
<strong>The</strong> thermal conductivity of binary mixtures is given by the thermal conductivities<br />
of the components and their molar fractions, x [46]:<br />
where A and B are constants and .yS = 1 - sc.<br />
By solving equation (<strong>2.</strong>4) for a change in the conductivity of a binary mixture [22],<br />
an expression that quantitatively describes the non-linear variation of the conductivity
40<br />
with the concentration is obtained (see Fig. <strong>2.</strong>1)<br />
TABLE <strong>2.</strong>1<br />
THE THERMAL CONDUCTIVITY OF SOME COMPOUNDS<br />
w N<br />
Compound KS x lo3 [W/cm. K] Compound KS x lo3 [W/cm. K]<br />
1710<br />
1470<br />
303<br />
240<br />
239<br />
24s<br />
23 I<br />
216<br />
164<br />
7 0<br />
FIG. <strong>2.</strong>1. <strong>The</strong>rmal conductivities of some binary mixtures.<br />
145<br />
86.2<br />
154<br />
173<br />
152<br />
111<br />
190<br />
170<br />
For very low concentrations of the eluted substance, all the terms in the expanded<br />
Taylor series (equation (<strong>2.</strong>5)) can be neglected except for the first, thus giving a linear<br />
relationship between the concentration of the eluted substance and the change in the<br />
conductivity of the binary system.<br />
Measurement with the <strong>TCD</strong> is based on monitoring changes in the electric con-<br />
ductivity of the filament, caused by variations in its temperature during passage of
the gaseous mixture through the measuring cell. A temperature gradient is established<br />
due to transfer of thermal energy by the medium. Under stationary conditions, the<br />
amount of heat transferred, Q, is proportional to the thermal conductivity of the<br />
flowing gaseous mixture and to the difference in the temperatures of the filament, T,,<br />
and the cell walls, T,:<br />
During the design of practical measuring devices, it was found that the overall<br />
amount of heat transferred is not given by the thermal conductivity of the medium<br />
alone, but that the molar heat capacity and other factors also play a role. <strong>The</strong> follow-<br />
ing processes contribute to the overall heat change, i.e., to the measured signal:<br />
- the thermal conductivity of the medium;<br />
- forced convection of the gaseous mixture;<br />
- free convection and diffusion of the gas;<br />
- the thermal conductivity of leads and connections;<br />
- thermal radiation.<br />
<strong>The</strong> participation of the thermal conductivity and of forced convection of the gas<br />
in the overall heat transfer can be distinguished only with great difficulty. Forced<br />
convection represents heat transfer coupled with mass transport under the dynamic<br />
conditions present in the gas chromatograph and amounts to about 25% of the<br />
overall change. This part of the transferred heat is proportional to the volume velocity<br />
of the gas, u, and to its heat capacity, C,:<br />
Hence the <strong>TCD</strong> signal depends on the flow-rate of the carrier gas.<br />
<strong>The</strong> contribution of free convection corresponds to energy transfer in the concen-<br />
tration gradient and is negligible compared with the other factors.<br />
Heat transfer by the leads and electrical connections is determined by their cross-<br />
section, length and thermal conductivity. <strong>The</strong>refore, it is desirable that the leads to<br />
the sensor should be as short as possible and have as small a cross-section as possible.<br />
It has been found that this parameter does not have a large influence on the overall<br />
change in the <strong>TCD</strong> signal in devices with heated filements, but that its importance<br />
increases when thermistors and transistors are used as sensors:<br />
Heat radiation depends on the surface area of the measuring element, on its<br />
temperature and on its material quality. <strong>The</strong> literature gives values of less than 4%<br />
for the contribution of thermal radiation to the overall heat transfer.<br />
41
42<br />
<strong>2.</strong>2 <strong>TCD</strong> SIGNAL<br />
Measurement with the thermal conductivity detector is based on monitoring changes<br />
in the resistance of the sensor, R,. A current I passes through the sensor and the<br />
thermal equilibrium in the measuring cell, through which a gaseous mixture with<br />
a thermal conductivity of K passes, can be expressed by the equation<br />
12Rf = J d(T, - T,)<br />
where a is the geometric constant of the measuring cell and J is Joule’s constant.<br />
It follows from the experimental arrangement that part of the thermal energy is lost<br />
during the passage of the gaseous mixture through the measuring cell and is manifested<br />
by a decrease in the sensor temperature, T,, as the temperature of the cell walls, T,,<br />
can be considered to be constant because of their high heat capacity. <strong>The</strong> sensor<br />
resistance is a linear function of the temperature:<br />
R, = RP(1 + XT,)<br />
(<strong>2.</strong>10)<br />
and therefore the measured changes in the resistance are given by the relationships<br />
and<br />
AR, = aRP. AT,<br />
AK<br />
AT, = - (T, - T,)<br />
K<br />
(<strong>2.</strong>11)<br />
(<strong>2.</strong>12)<br />
<strong>The</strong> signal of the thermal conductivity detector, SrcD, is proportional to the change<br />
in the voltage of the measuring bridge, AE:<br />
srcD N AE -f --<br />
AR<br />
- AR a(T, - T,)<br />
(<strong>2.</strong>13)<br />
R, K (1 + aT,)<br />
From equation (<strong>2.</strong>13) it follows that the signal depends on a number of parameters,<br />
the most important being<br />
- the voltage of the measuring bridge, E;<br />
- the geometric constant of the measuring cell, a;<br />
- the properties of the construction material, expressed by a;<br />
- the temperatures of the sensor and the cell walls, T, and T‘, respectively;<br />
- the thermal conductivity of the carrier gas, gc, and its flow-rate;<br />
- the thermal conductivity of the eluted substance, AK.<br />
As has already been mentioned, the <strong>TCD</strong> signal is not given by changes in the<br />
thermal conductivity of the gaseous mixture alone; forced convection of the material,<br />
which has a certain heat capacity, is also important. It is obvious that this contribu-
tion will become smaller with increasing participation of diffusion in the mass trans-<br />
port in the measuring cell. <strong>The</strong>refore, the term containing heat capacities is most<br />
significant with flow-through cells. Bearing this in mind, the following expression has<br />
been derived for SJCD [28, 291:<br />
43<br />
(<strong>2.</strong>14)<br />
where constants A and 6 are determined by the effective collision cross-sections and<br />
by the molecular weights of the eluted substances and of the carrier gas, where<br />
0 < A < 1 < 6, and u, is the molar flow-rate.<br />
<strong>The</strong> signal of the thermal conductivity detector is therefore strongly dependent on<br />
the molecular weights of the eluted substance and the carrier gas. It generally holds<br />
that the thermal conductivity decreases with increasing molecular weight, whereas<br />
the heat capacity increases. If hydrogen is the carrier gas, then all eluted substances<br />
will have lower thermal conductivities and higher heat capacities. <strong>The</strong> difference in<br />
the thermal conductivity term in the proportionality (<strong>2.</strong>14) increases with increasing<br />
molecular weight of the eluted substance and is always negative; the difference in the<br />
thermal capacity term increases and is positive. Hence the two processes have opposite<br />
effects and under certain circumstances their sum is equal to zero.<br />
<strong>2.</strong><strong>2.</strong>1 <strong>TCD</strong> background current<br />
<strong>The</strong> background current of the thermal conductivity detector is given by the compo-<br />
sition of the carrier gas, by its flow rate and by the detector temperature. As all<br />
practical designs employ a compensation bridge circuit, it is pointless to specify<br />
background current values. <strong>The</strong> <strong>TCD</strong> noise is caused by fluctuations in the detector<br />
temperature and in the carrier gas flow-rate [12]. For this reason, the measuring and<br />
the reference branches of the thermal conductivity detector are usually connected in<br />
a bridge circuit. This circuit is indispensable with flow-through and semi-diffusion<br />
cells, while diffusion cells yield results that are independent of the flow-rate and thus<br />
they have the lowest noise level.<br />
<strong>2.</strong><strong>2.</strong>2 <strong>TCD</strong> response<br />
<strong>The</strong> <strong>TCD</strong> response is the sum of the signals, SJCD, over the substance elution time.<br />
It follows from equations (<strong>2.</strong>13) and (<strong>2.</strong>14) that the relative magnitude of the signal<br />
depends on the character of the eluted substance; it decreases with increasing mo-<br />
lecular weight. A criterion frequently applied during evaluation of the effect of the<br />
structure of the eluted substance on the signal of the thermal conductivity detector<br />
is the relative molar response (RMR) [2, 3, 471. <strong>The</strong> RMR values are proportional<br />
to the various measuring sensitivities for various substances caused by their different
44<br />
thermal conductivites. <strong>The</strong> literature gives the dependences of S<strong>TCD</strong> on the molar and<br />
weight percent content of a substance. When light carrier gases are employed, then<br />
the proportionality of the signal to the weight per cent of the substance is usually<br />
TABLE <strong>2.</strong>2<br />
THE RELATIVE MOLAR RESPONSE TO ORGANIC OXYGEN-CONTAINING<br />
COMPOUNDS AND TO ALKYL-AROMATIC HYDROCARBONS [16]<br />
M - molecular weight<br />
Organic compounds<br />
Number of carbon<br />
atoms<br />
Equation for RMR<br />
n-Alkyl-aromatic c6-c10 0.741.M + 17.0<br />
hydrocarbons<br />
Primary alcohols c1-c4 0.67<strong>2.</strong>M + 25.4<br />
Esters RCOOR’<br />
Methyl ketones<br />
R = Co-C,;<br />
R’ = Ci-C4<br />
C,-C2<br />
0.630.M + 25.9<br />
0.688.M + 24.6<br />
n-Aldehydes<br />
n-Ethers<br />
c1-c6<br />
c2-c4<br />
0.631.M+ 21.9<br />
0.473.M + 49.5<br />
used. In any event, the use of relative responses is to be recommended for quantitative<br />
measurements, as they depend very little on experimental conditions such as the<br />
bridge voltage, cell temperature and flow-rate. <strong>The</strong> RMR values for homologous<br />
FIG. <strong>2.</strong><strong>2.</strong> <strong>The</strong> concentration dependence of the <strong>TCD</strong> response to some hydrocarbons,<br />
N, - carrier gas, 1 - pentane, 2 - heptane, 3 - octane [29].<br />
series of hydrocarbons, alcohols, etc., are given in Table <strong>2.</strong>2 [16]. <strong>The</strong>se values are<br />
obtained using hydrogen as the carrier gas and only a narrow range of molecular<br />
masses is covered. When the values are compared with those given in the literature
[25, 341, substantial differences are found. <strong>The</strong> validity of the published relative re-<br />
sponse rates must be judged carefully, as data concerning the measuring cell geometry<br />
and the experimental conditions are sometimes not specified. RMR values differing<br />
by as much as 18% between flow-through and semi-diffusion cells have been found<br />
[40]. It should be emphasized that, when using nitrogen as the carrier gas, even the<br />
significance of empirical RMR values is doubtful. Under these conditions, direct<br />
calculation of the concentration from the temperature dependences of il in the<br />
carrier gas employed [SO] has only limited validity.<br />
<strong>The</strong> molecular weight of the eluted substance significantly affects the character and<br />
magnitude of the JCD response. As the thermal conductivity decreases with increasing<br />
molecular weight, while the heat capacity increases, these two parameters have oppo-<br />
site effects and lead to conversion of negative peaks into positive peaks. This conver-<br />
sion is important with high-molecular-weight carrier gases, e.g., nitrogen. Fig. <strong>2.</strong>2<br />
shows that the change in the signal polarity is attained earlier with increasing mole-<br />
cular weight.<br />
TABLE <strong>2.</strong>3<br />
PARAMETERS CHARACTERIZING THE THERMAL CONDUCTIVITY<br />
DETECTOR WITH VARIOUS SENSORS<br />
Parameters ~.<br />
Sensor<br />
heated filament thermistor transistor<br />
Sensitivity [mV/mole] 4 x 10⁴ 4 x 10⁵ <strong>2.</strong>5 x 106<br />
Linear dynamic range 5 4.4<br />
Noise [pV]<br />
<strong>The</strong> lower detectable amount<br />
f 3 [I1 & 10 56<br />
[PPnlI<br />
Proportionality constant<br />
5 0.2 0.012<br />
ImVIKI 6 2900<br />
<strong>The</strong> basic parameters of the thermal conductivity detector depend on the exper-<br />
imental conditions used and therefore they are discussed in greater detail in the<br />
following paragraphs. Generally, it can be stated that the thermal conductivity<br />
detector is a universal measuring device with a wide linear dynamic range. However,<br />
the minimum detectable amounts are sometimes large and then other detectors are<br />
preferable. Some parameters characterizing the thermal conductivity detector are<br />
listed in Table <strong>2.</strong>3. <strong>The</strong> linearity and linear dynamic range must be given in log-log<br />
coordinates because of the exponential form of equation (1.23).<br />
45
46<br />
<strong>2.</strong>3 EFFECT OF EXPERIMENTAL PARAMETERS<br />
ON THE MAGNITUDE AND SHAPE OF THE <strong>TCD</strong> SIGNAL<br />
<strong>2.</strong>3.1 Carrier gas<br />
In measurements with the thermal conductivity detector, hydrogen, helium, nitrogen,<br />
argon [45], carbon dioxide and mixtures of various gases, e.g., air or nitrogen with<br />
5-10% of hydrogen or helium [43], are employed as carrier gases. <strong>The</strong> suitability<br />
of various carrier gases can be evaluated with reference to the discussion related to<br />
equation (<strong>2.</strong>14).<br />
If hydrogen or helium is used as the carrier gas, the difference in the thermal<br />
conductivities is always large and always negative. When the eluted substance is an<br />
inert gas with a low molecular weight, then the term containing the heat capacities<br />
plays almost no role and the <strong>TCD</strong> value is given chiefly by the change in the thermal<br />
conductivity of the gaseous mixture.<br />
When nitrogen is used as the carrier gas, the changes in the conductivity caused by<br />
the presence of an eluted substance are small, but the difference in the heat capacities<br />
increases significantly. It is evident that the magnitude of the <strong>TCD</strong> signal is inversely<br />
proportional to the molecular weight of the eluted substance and generally SL, is<br />
greater than SLY, as the thermal conductivity and heat capacity terms in equation<br />
(<strong>2.</strong>14) are comparable for nitrogen.<br />
<strong>The</strong> purity of the carrier gas effects the magnitude of the <strong>TCD</strong> signal [20]. If<br />
a sample is injected into a carrier gas containing impurities, then, owing to changes<br />
in the partial pressures, the impurities are replaced by the eluted substance and the<br />
resulting change in the signal is small. For this reason, pure carrier gases should be<br />
employed, although identical sensitivities for measurement with pure and impure<br />
carrier gases have sometimes been reported [45].<br />
<strong>The</strong> pronounced dependence of the signal of the thermal conductivity detector on<br />
the gas flow-rate follows from the detection mechanism, involving removal of heat<br />
by forced convection of gases in the measuring cell. As already mentioned, this<br />
effect decreases with increasing participation of diffusion processes in the measuring<br />
cell; the dependence of the <strong>TCD</strong> signal on the flow-rate is negligible with the diffusion<br />
type of cell, expecially when a light carrier gas is employed [38]. It follows from<br />
equation (<strong>2.</strong>14) that the thermal conductivity term is independent of the flow-rate.<br />
<strong>The</strong> change in the signal with increasing flow-rate will be greater the greater is the<br />
(CP, - CP~) value, i.e., the greater is the molecular weight of the eluted substance.<br />
This change, leading to peak inversion, will naturally be greater and more frequent<br />
when nitrogen is used as a carrier gas because of the similarity of the conductivity<br />
and heat capacity terms in equation (<strong>2.</strong>14).<br />
A decrease in the signal is not always observed during a change in the carrier gas<br />
flow-rate; in fact, over a certain range of flow-rates, there is virtually no signal change.<br />
This is due to the fact that the elution peak becomes narrower with increasing flow-
ate and hence the fdet/d t ratio increases with increasing detector volume. Consequently,<br />
the mean concentration of the eluted substance in the effective volume of<br />
the detector increases and a maximum concentration is attained.<br />
<strong>The</strong> dependence of the response on the flow-rate, which is regulated either before<br />
or after the column, is depicted in Fig. <strong>2.</strong>3, from which it follows that the two<br />
dependences have the same shapes, i.e., the products of Cs and of the integration time<br />
are identical.<br />
t<br />
t ' I-<br />
I<br />
FIG. 1.3. <strong>The</strong> dependence of the JCD response on the flow-rate of the gaseous mixture;<br />
A - flow-rate varied before the column, B - flow-rate varied after the column, before<br />
the detector inlet [18].<br />
From these dependences, it follows that the type of carrier gas used is of basicimpor-<br />
tance. It is advisable to avoid the use of nitrogen and to work with hydrogen or helium.<br />
When using heavier carrier gases, the relationship between the response and the concen-<br />
tration may be markedly non-linear in the region of chromatographically significant<br />
concentrations, resulting in distortion and inversion of chromatographic peaks.<br />
<strong>2.</strong>3.2 Construction of the JCD<br />
<strong>The</strong> measurement of thermal conductivity is carried out with a sensor, the resistance<br />
of which is strongly dependent on the temperature of the medium (Fig. <strong>2.</strong>4). <strong>The</strong><br />
sensor itself is at a temperature 7;, which is higher than the temperature of the walls<br />
47
48<br />
of the measuring cell T,. <strong>The</strong> sensor temperature is constant with stationary heating<br />
conditions and a constant flow-rate of an unchanging gaseous mixture. A change in<br />
the composition of the flowing gases is reflected in a change in the sensor temperature,<br />
causing a change in the sensor resistance, R,, thus providing an electrically treatable<br />
signal. At present, heated filaments, thermistors and transistors are employed as<br />
sensors.<br />
FIG. <strong>2.</strong>4. <strong>The</strong> dependence of the sensor resistance on temperature; a - heated filament,<br />
b - thermistor, c - transistor.<br />
<strong>The</strong> heated filament was the first sensor to be used in the thermal conductivity<br />
detector. <strong>The</strong> dependence of its resistance on temperature is linear over wide temperature<br />
range (up to 400" C). This advantage is partly offset by its relatively low<br />
sensitivity to temperature changes (see Table <strong>2.</strong>3.).<br />
In addition to heated filaments, thermistors with negative thermal coefficients are<br />
used as sensors. <strong>The</strong> thermistor resistance is an exponential function of temperature<br />
and the maximum temperature used is about 100 "C; above this value, the sensitivity<br />
of the thermistor towards ,temperature changes is very low. If the thermistor resistance<br />
equals RP at a particular standard temperature, To, (usually 25 'C), then the resistance<br />
at temperature T, is given by the relationship.<br />
R, = RP exp [ - (A - 31 (<strong>2.</strong>15)<br />
A transistor was first used as a sensor in the thermal conductivity detector in 1972<br />
[31], its use being based on the direct conversion of changes in the sensor temperature<br />
into an electric signal. As transistors cannot be heated directly, they are maintained<br />
at a temperature T, by an external source. <strong>The</strong> steady-state thermal equilibrium can<br />
be expressed in terms of the transistor collector current, I,:<br />
I, E = 0 . R (T, - T,) (<strong>2.</strong>16)
<strong>The</strong> sensor temperature, T,, changes during the elution and the change is manifested<br />
in a change in the collector current, AI,, which is measured directly. A bridge circuit is<br />
not used and this method leads to a considerable increase in sensitivity.<br />
<strong>2.</strong>3.<strong>2.</strong>1 Seiisor heating voltage<br />
In contrast to the heated filament detector, the dependence of the SrcD obtained<br />
with a thermistor on the voltage exhibits a maximum. <strong>The</strong> optimum value of the<br />
heating voltage is given by the relationship<br />
E,,, - J (RO . 6. Rc . T,) (<strong>2.</strong>17)<br />
Under constant thermistor parameters, i.e., standard-state resistance, Ro, and ma-<br />
terial constant, 6, and with a given carrier gas characterized by a thermal conductivity<br />
Kc, the optimum temperature of the supply voltage depends solely on the temperature<br />
of the detector walls (see Fig. <strong>2.</strong>5).<br />
FIG. <strong>2.</strong>5. <strong>The</strong> dependence of the relative<br />
magnitude of SrCD on the heating voltage<br />
and the detection block temperature;<br />
a, b - thermistor, c - heated filament.<br />
49<br />
Fig. <strong>2.</strong>6. <strong>The</strong> dependence of S<strong>TCD</strong> on the<br />
carrier gas quality; 1 - nitrogen,<br />
2 - hydrogen.<br />
A change in the carrier gas results in a change in the optimum heating voltage.<br />
As follows from the introductory section, carrier gases with lower molecular weights<br />
absorb more heat and therefore a larger heat supply is necessary in order to maintain<br />
the same sensor temperature and a similar sensitivity. This dependence is depicted<br />
schematically in Fig. <strong>2.</strong>6.<br />
<strong>2.</strong>3.<strong>2.</strong>2 Sensor pararneters<br />
<strong>The</strong> signal of the thermal conductivity detector with a heated filament depends on the<br />
properties of the filament, especially on its specific resistance, e, and its thermal
50<br />
coefficient, a. <strong>The</strong> signal is related to these values by the relationship<br />
S<strong>TCD</strong> - alJe<br />
<strong>The</strong> values of a, e and S<strong>TCD</strong> for some materials are summarized in Table <strong>2.</strong>4.<br />
TABLE <strong>2.</strong>4<br />
THE SPECIFIC RESISTANCE, THERMAL COEFFICIENT<br />
AND THE RELATIVE RESPONSE OF SOME MATERIALS<br />
USED AS <strong>TCD</strong> SENSORS<br />
Material a. 103[K-'] p [Q. mm2/m] s<strong>TCD</strong><br />
Platinum 4.0 0.106 13<br />
Pt-Ir 90-10 1.2 0.24 <strong>2.</strong>5<br />
80- 20 0.8 0.31 1.5<br />
Tungsten 4.54 0.058 19<br />
Nickel 4.91 0.072 18<br />
(<strong>2.</strong>18)<br />
One of the most commonly used materials is platinum, which, however, has poor<br />
mechanical properies; the filament diameter is therefore generally rather large (about<br />
0.02 mm). Alloys of platinum with iridium or rhodium have better mechanical proper-<br />
ties but yield smaller signals then platinum sensors. After platinum, tungsten is the<br />
most commonly used filament material. Its relative response is comparable with that<br />
of platinum and it also has very satisfactory mechanical properties, so that very thin<br />
filaments (down to 0.006 mm) can be used. However, it is oxidizeh by atmospheric<br />
oxygen at temperatures above 500 "C. Nickel filaments are occasionally used in<br />
corrosive media, but their use is limited by their poor mechanical properties [8, 9,<br />
13, 15, 36, 441.<br />
A number of workers have tried to prolong the life-time of sensors, decrease the<br />
noise level and prevent drift of the background current. In addition to passivation of<br />
the W-Re filament at 330 "C by formation of oxides [8], the surface of the filament<br />
was gilded [17] and treated with HF [15] or CH,Cl, [36] vapour. <strong>The</strong>se modifi-<br />
cations led to an increase in the detector stability. <strong>The</strong> measuring filament has also<br />
been covered with a palladium catalyst [13], increasing the sensitivity for both<br />
a- and p-olefins.<br />
<strong>The</strong>rmistors are characterized by the values of Ro and the material constant. <strong>The</strong><br />
thermistor resistance varies within a wide range, from 1 to lo6 0. In general, the<br />
detector can be used at higher temperatures if a high-resistance thermistor is em-<br />
ployed, but a recorder with a high input impedance must be used. As the sensitivity<br />
of the thermistor to temperature changes is highest at low temperatures, thermistors<br />
with low resistances (of the order of lo3 to lo4 62) can be employed.<br />
<strong>The</strong> thermistor material constant corresponds to the energy required to increase
the temperature by AT,. Hence it is evident that, with increasing material constant,<br />
the detector time constant will increase, thus rendering the results less reliable.<br />
<strong>2.</strong>3.<strong>2.</strong>3 Cell geometric constant<br />
<strong>The</strong> amount of heat removed from the surface of a heated filament is proportional to<br />
its surface area (see equation (<strong>2.</strong>6)). For a cylindrical body, this geometric constant<br />
is given by the relationship<br />
51<br />
(<strong>2.</strong>19)<br />
where 1 is the length of the heated filament, rc is the internal radius of the cell and rf<br />
is the external radius of the filament. It follows from equations (<strong>2.</strong>6) and (<strong>2.</strong>19) that<br />
S<strong>TCD</strong> increases with increasing length and radius of the heated filament and is inversely<br />
proportional to the cell radius. <strong>The</strong>se dependences must be evaluated correctly, as it<br />
is impossible simultaneously to lengthen the filament and make the cell volume smaller.<br />
If the filament is lengthened, the cell must be larger and the detector volume increases;<br />
this leads to an increase in the detector time constant. Existing commercial detectors<br />
represent a compromise among the above requirements. <strong>The</strong> effect of the geometric<br />
constant on the magnitude of the <strong>TCD</strong> signal is represented schematically in Fig. <strong>2.</strong>7.<br />
0 M 15 -a<br />
I<br />
m<br />
FIG. <strong>2.</strong>7. <strong>The</strong> dependence of the FIG. <strong>2.</strong>8. <strong>The</strong> dependence of S<strong>TCD</strong> on the<br />
<strong>TCD</strong> signal on the geometric constant<br />
at various temperatures of the heated<br />
temperature of the filament and of the cell<br />
walls; the difference (Tf - T,) is plotted<br />
filament. on the x-axis.<br />
When a thermistor is employed as the sensor, it is assumed to be spherical and the<br />
geometric constant is expressed by the relationship<br />
4xrrrc<br />
a = - - 4nrt<br />
rc - rf<br />
(<strong>2.</strong>20)<br />
<strong>The</strong>refore, the signal of a detector employing a thermistor is directly proportional to<br />
its radius.
52<br />
<strong>2.</strong>3.<strong>2.</strong>4<br />
Temperatures of the sensor and the cell walls<br />
From the principle of the thermal conductivity detector, it follows that T, must<br />
generally be larger than T, (when a heated filament is used), so that (T, - T,) 2<br />
I - 200 "C. <strong>The</strong> detector signal is directly proportional to the difference between the<br />
temperatures of the heated filament and the cell walls, from which follow important<br />
conclusions concerning the adjustment of the experimental conditions.<br />
At a selected detection block temperature, SrCD is proportional to the temperature<br />
of the heated filament, i.e., to the heating intensity (Fig. <strong>2.</strong>8); on the other hand, at<br />
a given temperature of the heated filament, i.e., with constant heating, S<strong>TCD</strong> is<br />
inversely proportional to the detection block temperature. In practice, it is most<br />
advantageous to maintain the temperature of the heated filament as high as possible<br />
(taking care not to burn the filament) and the detection block temperature as low as<br />
possible (avoiding condensation of eluted substances in the cell).<br />
When working with columns with programmed temperatures, the possibility of<br />
a decrease in the <strong>TCD</strong> signal must be borne in mind if the detection block is connected<br />
to the column thermostat. During an increase in the temperature of the column<br />
thermostat, the temperature difference (T, - T,) decreases and consequently S<strong>TCD</strong><br />
also decreases.<br />
<strong>The</strong> above rules also hold for thermistor sensors. It has been found experimentally<br />
that the highest measuring sensitivity is attained for a small difference between the<br />
sensor and cell temperatures, (T, - T,) = 35 - 50 "C, while the sensor temperature<br />
should not exceed 100 "C. S<strong>TCD</strong> is strongly dependent on the detection block temperature:<br />
STcD 81.5R1l2T-2 f c (<strong>2.</strong>21)<br />
<strong>The</strong>refore, it is preferable to maintain the detection block temperature as low as<br />
possible.<br />
<strong>2.</strong>3.<strong>2.</strong>5<br />
Time constant of the <strong>TCD</strong><br />
<strong>The</strong> magnitude of the time constant depends on the effective volume of the detector.<br />
<strong>The</strong> requirement that the time constant of the measuring device should be as low as<br />
possible, leading to the smallest possible distortion of the elution curves, is partially<br />
in opposition to the requirements regarding the magnitude of the detector signal<br />
concerning, for example, the length of the heated filament or a large thermistor radius.<br />
<strong>The</strong> cell time constant is expressed by the relationships<br />
and<br />
vdet = ' * 'dst<br />
7 = 0.632td,,<br />
<strong>The</strong>se relationships are valid, however, only for cells in which transport occurs
exclusively through convection. A number of thermal conductivity designs have been<br />
proposed in which both diffusion processes and mass convection towards the sensor<br />
surface participate. According to this criterion, cells are classified as flow-through,<br />
semi-diffusion and diffusion. <strong>The</strong> shapes of these cell types are depicted in Fig. <strong>2.</strong>9.<br />
FIG. <strong>2.</strong>9. Various shapes of thermal conductivity cells; a - flow-through,<br />
b - diffusion, c - semi-diffusion.<br />
<strong>The</strong> expression for the time constant of flow-through cells reflects the significant<br />
dependence of their signal on the gas flow-rate. <strong>The</strong>refore, manostats are placed<br />
before the cells in order to stabilize the flow-rate and the pressure [12]. <strong>The</strong> smallest<br />
distortion of the shape of the elution curve is achieved with a low time constant;<br />
designers of thermal conductivity cells thus attempt to make the flow-through cell<br />
volume as small as possible. Cells with volumes of 20 pI [21], <strong>2.</strong>6 ,d [32] and even<br />
1 pL1[23] have been described.<br />
TABLE <strong>2.</strong>5<br />
TIME CONSTANTS OF VARIOUS CELL TYPES<br />
IN THERMAL CONDUCTIVITY DETECTORS<br />
Cell 7 [sec] Notes<br />
Flow-through 0. I- 1 most frequently used, most<br />
sensitive to all changes<br />
Diffusion 10-20 unsuitable for modern<br />
measuring requirements<br />
Semi-diffusion o1 /r2 > 1 up to 10 properties of the flow-through cell<br />
CI/U2 J. 1 up to 20 properties of the diffusion cell<br />
53
54<br />
It is obvious that the time constant will increase with increasing participation of<br />
diffusion in the transport process. <strong>The</strong> time constant of a semi-diffusion cell can be<br />
expressed by the relationship<br />
1<br />
z = 0.632t,,, -<br />
2-- V<br />
111<br />
where trl is the gas flow-rate through the measuring branch (see Fig. <strong>2.</strong>9). <strong>The</strong> time<br />
constants of the cell types discussed are listed in Table <strong>2.</strong>5. In addition to the time<br />
constant of the measuring cell, the sensor time constant, determined by its mass and<br />
heat capacity, must also be considered. Thus the sensor requires a certain time to<br />
record a change. <strong>The</strong> time constant of a heated filament is given by the relationship<br />
As the heat capacity of the filament is proportional to its volume, i.e., mC, - $1, the<br />
requirement of high <strong>TCD</strong> sensitivity (see equations (<strong>2.</strong>9) and (<strong>2.</strong>19)) leads to an<br />
increase in the sensor time constant. <strong>The</strong> heat capacity of the thermistor approxima-<br />
tely equals the material constant, 6, and varies around 1 sec for most sensors of this<br />
type. In a provisional arrangement, the transistor sensor had a large time constant<br />
of 10 sec [31], which the authors felt could be decreased to 0.6 sec.<br />
In some designs, the heated filament is sealed in glass in order to decrease the<br />
catalytic action of the heated filament on the thermal decomposition of substances<br />
and to prevent corrosion of the sensor. Similarly, materials other than glass have also<br />
been employed, e.g., fluorinated plastic [5]. <strong>The</strong>se modifications lead to an increase<br />
in the lifetime of the sensor and make its use at higher temperatures possible, but the<br />
TABLE <strong>2.</strong>6<br />
THE TIME CONSTANT OF THE THERMAL CONDUCTIVITY DETECTOR<br />
Cell<br />
Sensor<br />
heated filament<br />
filament in thermistor transistor<br />
Length of cell<br />
- sensor [cm]<br />
2 10 2 0.2 0.2<br />
Diameter of cell<br />
- sensor [cm]<br />
0.5 0.002 0.1 0.2 0.2<br />
Gas flow-rate [ml/min] 30<br />
Time constant [sec] 0.45 0.01 4 1 9.6
time constant of the sensor and consequently that of the whole detector are increased<br />
considerably due to an increase in the heat capacity of the measuring element. Cell<br />
time constants and those of individual sensor types are given in Table <strong>2.</strong>6, from<br />
which it follows that a heated filament has the lowest time constant. It should be<br />
used in combination with a flow-through cell whenever theoretical or quantitative<br />
empirical conclusions are to be made on the basis of the measured results.<br />
<strong>2.</strong>3.<strong>2.</strong>6 Measuring circuits<br />
If a heated filament or thermistor is used as a sensor in the thermal conductivity<br />
detector, it is connected in a Wheatstone bridge for compensation measurements.<br />
When a voltage E is brought to a bridge consisting of the sensor resistance, R,,<br />
and a reference sensor resistance, R,, then, for the current passing through the circuit<br />
(Fig. <strong>2.</strong>10)<br />
_-<br />
.I<br />
U<br />
E = I(R, + R,)<br />
A signal corresponding to the voltage change due to a change in the sensor resistance<br />
can be measured at the bridge output.<br />
f f<br />
FIG. <strong>2.</strong>10. Scheme of the<br />
FIG. <strong>2.</strong>1 1. Scheme of the <strong>TCD</strong> circuit with a constant<br />
<strong>TCD</strong> constant-current circuit. sensor temperature.<br />
<strong>The</strong> above principle is used in both constant-current and constant-voltage circuits,<br />
with either two or four sensors. A single thermistor in a voltage-powered bridge has<br />
also been employed [7]; however, the only advantage of this circuit was its simplicity,<br />
the JCD parameters not being improved. In addition to the measurement of d.c.<br />
voltage and current, square-wave JCD operation has also been proposed. Constant-<br />
current bridges yield a broader linear dynamic range than constant-voltage bridges.<br />
Recently, a thermal conductivity detector with a constant sensor temperature was<br />
introduced [49]. In this circuit, a single variable resistor is connected in the bridge<br />
(Fig. <strong>2.</strong>11). <strong>The</strong> uncompensated output voltage is amplified and fed back to the bridge<br />
55
56<br />
through a transistor controlling the current passing through the bridge. In this<br />
way, the current is instantaneously adjusted so that the sensor resistance, R,, and<br />
consequently its temperature, T,, do not change.<br />
It has been found experimentally that a device with a constant-temperature<br />
sensor has a number of advantages over constant-voltage or constant-current circuits.<br />
<strong>The</strong> lowest detectable amount is decreased ten-fold, the linear dynamic range is<br />
broader by one order of magnitude and the detector time constant is decreased.<br />
Concentrations of 10% by volume were measured in this way without a change in the<br />
detector linearity.<br />
<strong>The</strong> pronounced improvement in the JCD parameters when a constant temperature<br />
is used can be explained by the fact that, owing to the constant sensor temperature<br />
during the elution, the entire elution curve is measured under constant conditions<br />
with constant sensitivity. With constant-voltage or constant current circuits, the<br />
sensor temperature gradient follows the concentration gradient of the eluted substance.<br />
With increasing amounts of eluted substances, the measuring sensitivity decreases<br />
owing to a decrease in the sensor temperature.<br />
<strong>2.</strong>4 APPLICATIONS OF THE <strong>TCD</strong><br />
<strong>The</strong> thermal conductivity detector is one of the most commonly used detectors in gas<br />
and liquid-solid chromatography [41]. In addition to a number of reviews [17, 19,<br />
TABLE <strong>2.</strong>1<br />
EXAMPLES OF THE APPLICATION OF THE THERMAL CONDUCTlVITY<br />
DETECTOR<br />
Substance determined Material analyzed <strong>The</strong> lowest detect- Ref,<br />
able amount<br />
Permanent gases in air<br />
Permanent gases in chlorine<br />
Permanent gases<br />
in high purity ethylene<br />
N2, 02, c02<br />
in exhaled air<br />
NO, in air<br />
0 in organic compounds<br />
N in organic compounds<br />
Metal halides<br />
PCI,<br />
Chlorinated hydrocarbons<br />
Alkanes, alcohols, aliphatic acids<br />
Olefins, branched olefins<br />
‘BH18; C10H22;<br />
0.002 1.11 10, 23,<br />
35,43<br />
I1<br />
17a<br />
30<br />
3a<br />
27<br />
1 1.1g 39<br />
1.9 x mole 5<br />
8.7 X mole 5<br />
15<br />
37<br />
13<br />
1.4; <strong>2.</strong>7; 3.5ppm 32
24, 33, 34, 42, 481, the excellent treatment of the <strong>TCD</strong> in the book by Jentzsch and<br />
Otte [18] should be mentioned. Some examples of <strong>TCD</strong> applications are given in<br />
Table <strong>2.</strong>7. When the <strong>TCD</strong> is compared with other detectors, for example the discharge<br />
detector [l], E CD [5] or FP D [14], better parameters are usually found for the <strong>TCD</strong>.<br />
Comparison of the <strong>TCD</strong> with the FID [4, 35, 371 depends on the structures of the<br />
eluted substances. <strong>The</strong> <strong>TCD</strong> is, of course, more suitable for inorganic gases such as<br />
CS,, COS, H,S and SO, [35]. During measurement of the signal ratio, S"/SrCD,<br />
n<br />
FIG. <strong>2.</strong>1<strong>2.</strong> Analysis of air using a <strong>TCD</strong> with a transmodulator [23].<br />
values greater than unity were obtained for alkanes, and values smaller than unity for<br />
oxygen-containing compounds [37]. It can be presumed that the thermal conductivity<br />
detector will find further use in analyses of inorganic gases, of silylated samples, etc.<br />
[26]. A thermal conductivity detector with a palladium transmodulator [23] gave<br />
excellent results in analyses for rare gases in air (Fig. <strong>2.</strong>12).<br />
<strong>2.</strong>5 LITERATURE<br />
I. Arnikar H. J., Rao T. S., Karmarkar K. 13.: J. Chrornatogr. 38, 126 (1968)<br />
<strong>2.</strong> Barry E. F., Rosie D. M.: J. Chrorwtogr. 59. 269 (1971)<br />
3. Barry E. F., Jr.: Chenz. Abslr. 76, 50 486c (1972)<br />
3a. Beskova G. S., Filipov V. S.: Zaaod. Lab. 38, 154 (1972)<br />
4. Bogoslovskii Yu. N., Razin V. L.: Zlz. Fiz. Khim. 45, 2490 (1971)<br />
5. Brazhnikov V. V., Sakodynskii K. I.: Clzern. Absrr. 74, 94 013j (1971)<br />
6. Castello G., DAmato G.: J. Chromatogr. 32, 625 (1968)<br />
7. Chowdhury B., Karasek F. W.: J. Chroniatogr. Sci. 8, 199 (1970)<br />
8. Cieplinski E. W., Spencer S. F., Illingsworth W. L.: US Pat. 3,537,914 (Nov. 3, 1970)<br />
57
58<br />
9. Delew R. B.: J. Chromatogr. Sci. 10, 600 (1972)<br />
10. Ediz S. H., van Swaay M., McBride H. D.: Chem. Instruni. 3, 299 (1972)<br />
11. Gerdes W. F.: US Pat. 3,474,661 (Oct. 28, 1969)<br />
1<strong>2.</strong> Goryunov Yu. A,, Zalkin V. S., Okhotnikov B. P., Rotin V. A., Rozanova L. I., Maksimov<br />
B. G.: USSR Pat. 371 511 (Feb. 22, 1973)<br />
13. Guillot J., Bottazzi H., Gyuot A., Trambouze Y.: J. Gas Chromatogr. 6, 605 (1965)<br />
14. Gutsche B., Herrmann R.: <strong>2.</strong> Anal. Chem. 249, 168 (1970)<br />
15. Hachenberg H., Gutberlet J.: Brensf. Chem. 49, 242 (1968)<br />
16. Hara N., Katsuda M., Kato H., Hasegawa K., Ikebe K.: Chem. Abstr. 68, 65 5D4r (1968)<br />
17. Hartmann C. H.: Anal. Chenz. 43, 113A (1971)<br />
17a. Jadrijevic V., Deur-Siftar D.: Chromafogruphia 7, 19 (1974)<br />
18. Jentzsch D., Otto E.: Detektoren in der Gas Chromatographie, Akademische Verlaggeselschaft,<br />
Frankfurt a. M. 1970<br />
19. Johns T., Stapp A. C.: J. Chromatogr. Sci. 11, 234 (1973)<br />
20. Karp S., Lowell S.: Anal. Chern. 43, 1910 (1971)<br />
21. Kiefer M. E.: Ger. Offen. <strong>2.</strong>222 617 (Nov. 30, 1972)<br />
2<strong>2.</strong> Lindsay A. L., Bromley L. A,: Ind. Eng. Chem. 42, 1508 (1950)<br />
23. Lovelock J. E., Simmonds P. C., Shoemake G. R.: Anal. Chem. 43, 1958 (1971)<br />
24. McNair H. M., Chandler G. D.: J. Chromatogr. Sci. 11, 454 (1972)<br />
25. Monfort J. P.: Chim. Anal. (Paris) 53, 646 (1971)<br />
26. Morrow R. W., Dean J. A., Shults W. D., Guerin M. R.: J. Chromatogr. Sci. 7, 572 (1969)<br />
27. Nikolaeva N. A., Dolgopolskaya P. I., Rezler R. Yu.: Chem. Abstr. 70, 111 448s (1969)<br />
28. Novik J., WiEar S., Janak J.: Coll. Czech. Chem. Commun. 33, 3642 (1968)<br />
29. Novak J., Janiik J.: Coll. Czech. Chem. Commun. 35, 212 (1970)<br />
30. Noviik J., JaniEek M.: Chem. Listy 65, 739 (1971)<br />
31. Otte E., Gut J.: Chromatographia 5, 246 (1972)<br />
3<strong>2.</strong> Pecsar R. E., De Lew R. B., Iwao K. R.: Ana. Chem. 45, 2191 (1973)<br />
33. Richmond A. D.: J. Chrornatogr. Sci. 9, 92 (1971)<br />
34. Rosie D. M., Barry E. F.: J. Chromatogr. Sci. 11, 237 (1973)<br />
35. Schaeffer B. A.: Anal. Chenz. 42, 448 (1970)<br />
36. Seibel A. C., Johns T.: US Pat. 3,533,858 (Oct. 13, 1970)<br />
37. Sokolov D. N., Golubeva L. K.: Zauod Lab. 35, 143 (1969)<br />
38. Tamura H., Hozumi K.: Chem. Abstr. 72, 128 311f (1970)<br />
39. Thuerauf W.: <strong>2.</strong> Anal. Chem. 250, 11 1 (1970)<br />
40. Vermont J., Guillemin C. L.: Anal. Chem. 45, 775 (1973)<br />
41. Versino C., Fogliano L., Giaretti F.: Riu. Combust. 21, 389 (1967)<br />
4<strong>2.</strong> Villalobos R.: Chem. Eng. Progr. 64, 55 (1968)<br />
43. Volkov E. F., Rabinovich S. I., Breshchenko V. Ya.: Ref. Zh. Khim. 1969, 5 G 14<br />
44. Wade R. L., Cram S. P.: J. Chromatogr. Sci. 10, 622 (1972)<br />
45. Walsa J. T., McCarthy K. J., Merritt C., Jr.: J. Gas Chromatogr. 6, 416 (1968)<br />
46. Wassiljewa A.: Physik. <strong>2.</strong> 5, 737 (1904)<br />
47. Watanabe S., Nakasato S., Kuwayama H., Sasamoto Y., Shihaishi S., Seino H., Nagai T.,<br />
Negishi M., Hayano S.: Yukagaku 22, 102 (1973)<br />
48. Winefordner J. D., Glenn T. H.: Aduan. Chromatogr. 5, 263 (1968)<br />
49. Wittebrood R. T.: Chromatographia 5, 454 (1972)<br />
50. Zalkin V. S.: Zauod. Lab. 36, 129 (1970)


