(B) fo.z foro
(B) fo.z foro
(B) fo.z foro

Create successful ePaper yourself
Turn your PDF publications into a flip-book with our unique Google optimized e-Paper software.
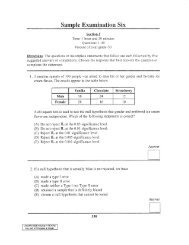
32 Sample Exarnination Two Section E<br />
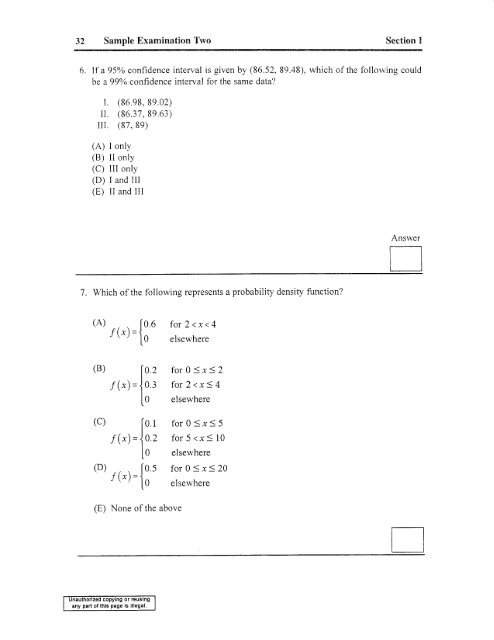
6. If a 95% confidence interval is given by (86^52, 89.48), which of the <strong>fo</strong>llowing could<br />
be a99o/o confidence interval <strong>fo</strong>r the same data?<br />
L (86.98, 89.42)<br />
II. (86.37,89.63)<br />
III. (87,89)<br />
(A) I only<br />
(B) II only<br />
(C) III only<br />
(D) I and Ill<br />
(E) II and III<br />
7. Which of the <strong>fo</strong>llowing represents a probability density function?<br />
(A) [0.0 <strong>fo</strong>r2
Section I Sample Examination Ttvo 33<br />
8. Maritsa scored 82 on a geometry exam <strong>fo</strong>r which the class mean was 74 and the<br />
standard deviation 3.2 and she scored 86 on a biology exam <strong>fo</strong>r which the class mean<br />
was 77 rvith a standard deviation of 2.9.In comparison to other members of each of<br />
these classes, which of the <strong>fo</strong>llowing conclusions can you draw?<br />
(A) Her per<strong>fo</strong>rmance on the geometry exam was L:etter than her per<strong>fo</strong>rmance c,n the<br />
biology exam.<br />
(B) Her per<strong>fo</strong>rmance on the biology exam was better than her per<strong>fo</strong>rmanee on the<br />
geometry exam.<br />
(C) Her relative per<strong>fo</strong>rrnance was the same <strong>fo</strong>r both exams.<br />
(D) Her relative per<strong>fo</strong>rmance was graded unfairly.<br />
(E) No conclusion can be drawn frorn this data.<br />
[-l<br />
Answer<br />
ll<br />
9. Assurning that birthdays are uni<strong>fo</strong>rmly distributed throughout the week, the probability<br />
that trvo strangers passing each other on the street were both bom on Sulday is<br />
(A) 1t7<br />
(B) 2t7<br />
(c) 1t4e<br />
(D) 2t4e<br />
(E) 4t4e<br />
10. Which of the <strong>fo</strong>llowing are characteristics of a r-distribution curve?<br />
l. The graph of a l-distribution extends infinitely to the left and to the right and<br />
approaches the x-axis asymptotically as x increases in absolute value.<br />
IL There are an infinite number of different /-curves, each determined by a<br />
parameter called degrees of freedom.<br />
Ill. The maximum point on the graph of a r-distribution occurs at its mean which<br />
is always 0.<br />
(A) I only<br />
(B) II only<br />
(C) Iil only<br />
(D) I and III only<br />
(E) I, il, and III<br />
EAnswer<br />
Answer<br />
tt<br />
tl<br />
ot<br />
any part of thls page Is lllegal
34 Sample Examination Two Section E<br />
ll' A teacher raised each student's grade by t0 points on an algebra exam. Which of the<br />
<strong>fo</strong>llowing describes the correlation betu,een students' original srades and their adjusted<br />
grades?<br />
(A) slightly negatrve<br />
(B) slightly positive<br />
(C) close to 0<br />
(D) -1<br />
(E) I<br />
12. In conducting a hypothesis test, thep-rralue is the<br />
(A) probability of obtaining a result as extreme or more extreme than the one<br />
obtained if the null hvpothesis is true<br />
(B) significance level of the test<br />
(C) probability of making a T1,pe I error<br />
(D) probabilitv of making a T,vpe II error<br />
(E) probability that the null h.vpothesis is true<br />
13. In constructing a confidence interval based on a large sample to estimate the mean p<br />
of a population with a knorm standard deviation o, which of the <strong>fo</strong>llon,ing does NOT<br />
affect the rvidth of the confidence interval?<br />
(A) the sample mean<br />
(B) the popuiation standard deviation<br />
(C) the confidence level<br />
(D) the sample size<br />
(E) the sample standard deviation<br />
or reusing<br />
any part of this page is lllegal.<br />
Answer<br />
Anslver<br />
Answer
Section tr<br />
14. Which of the <strong>fo</strong>llov-'ing are conditions <strong>fo</strong>r a binomial experirnent'/<br />
Sarnptre Examination Two 35<br />
I. The number of trials n is a fixed number.<br />
II. T'he n trials are independent.<br />
IIi. The probabilifl of success p is equal to the probabilitS' of failure q'<br />
(A) i only<br />
(B) II only<br />
(C) III oniy<br />
(D) I and ll onl,r,<br />
(E) I, II. and III<br />
15. Which of the <strong>fo</strong>llowing is NOT true concerning sampling distributions?<br />
Answer<br />
r--]<br />
ll<br />
(A) If the sample size n is large, the sampling distribution of T, drawn from a normal<br />
population, is approximately normal.<br />
(B) The mean of the sampling distribution of p is equal to the population propor-tion<br />
t)<br />
(C) The mean of the sampling distribution of the difference of trvo means (x, - rr) is<br />
equal to the difference of the population means (l'L'- llr).<br />
(D) The standard deviation of the sampling distribution of I is (r1,6., where o is the<br />
population standard deviation.<br />
(E) The standard deviation of the sampling distribution of the differences of two<br />
means 6x,-z.is equal to the sum of the respective population standard deviations.<br />
Answer<br />
or reus<br />
any part of this Page is illegal
36 Sarnple Exarnimation Two Section I<br />
16. The all-time leader in career bafting average among major league basebail players is Ty<br />
Cobb with a career average of 0.366. This means he got a hit in 36.5oh of his official<br />
at-bats. What was Cobb's probabiliry of getting at least one hit in <strong>fo</strong>ur official at-bats?<br />
(A) 0.092<br />
(B) 0.134<br />
(c) 0.162<br />
(D) 0.366<br />
(E) 0.838<br />
17. Which of the <strong>fo</strong>lloiving accurately describes the polr,er of a statistical test of<br />
hypothesis?<br />
(A) It is equal to the p-value.<br />
(B) It is equal to 1- (p-value).<br />
(C) It is equal to d, the significance level.<br />
(D) It is the probability that a test using a fixed value of s will reject H,, when a<br />
particular alternative value of the parameter is true.<br />
(E) It is equal to p.<br />
Answer<br />
Answer<br />
I 8. The equation of the least squares regression line lor a set of points in a scatterplot is<br />
given by i = 2.2+ 0.8lx. The point (5, 7) is one poinr on this scatterplot. Which of the<br />
<strong>fo</strong>llowing is the residual <strong>fo</strong>r the point (5,7)?<br />
(A) 0,71<br />
(B) 0.7s<br />
(c) 4.0s<br />
(D) 6.25<br />
(E) 7.87<br />
or<br />
any Part ot thls page ls lllsgal<br />
Answer
Section t Sample Exarnination T\vo 37<br />
19. 'fhe table below shows the probability distribution <strong>fo</strong>r the number of tails (X) in five<br />
tosses of a fair coin. What is E(X)" the exnected value of X?<br />
(A) 2.0<br />
(B) 2.5<br />
(c) 3.0<br />
(D) 3.5<br />
(E) 4.0<br />
X 0 I a J 4 5<br />
D/ta\ 03125 r5525 .3r25 .3t25 15625 .03125<br />
20" Which of the <strong>fo</strong>llowing statemen"ts is a consequence of the Central Limit Theorem?<br />
I. If the original population is uni<strong>fo</strong>rmly disstributed, then the sampling<br />
distribution of x rvill be uni<strong>fo</strong>rnt <strong>fo</strong>r large samples.<br />
II. The sampling distribution of x will be approximately normal <strong>fo</strong>r large samples.<br />
III. The mean of the sampling distribution of t will be close to I <strong>fo</strong>r large samples.<br />
(A) I only<br />
(B) II only<br />
(C) III only<br />
(D) II and III only<br />
(E) I, II, and III<br />
21 " The probability of a tourist visiting an area cave is 0.70 and of a tourist visiting a nearby<br />
park is 0.60. The probability of visiting both places on the same day is 0.40. The<br />
probability that a tourist visits at least one of these two places is<br />
(A) 0.08<br />
(B) 0.28<br />
(c) 0.42<br />
(D) 0.e0<br />
(E) 0.9s<br />
EAnswer<br />
Answer<br />
Ansrver<br />
Unauthorized copylng or reuslng<br />
any part of this page is lllegal.
38 Samp[e Examination Two Section I<br />
22. The correlation between height and weight among men betr,veen the ages of 18 and 70<br />
in the United States is appro.ximately 0.42. Which of the <strong>fo</strong>lloivine conciusions does<br />
NOT <strong>fo</strong>llow from the data?<br />
(A) Talier men tend to be heavier.<br />
(B) Changing the units of 'weight and height wouid stiil yieid the sarne correiation value.<br />
(C) Heavier mell tend io be tailer.<br />
(D) [f a man in this gloup ciranses his diet and gains ] 0 pounds, he is likeiy to get taller.<br />
(E) There is a moderate association betn'een a il]an's height and weight.<br />
23. A high school guidance counselor wishes to compare the PSAT results <strong>fo</strong>r the male and<br />
female students in the junior ciass at your high school. \\'hich is the best technique <strong>fo</strong>r<br />
gathering the data needed?<br />
(A) census<br />
(B) experiment<br />
(C) observational study<br />
(D) sample survey<br />
(E) a double blind experiment<br />
Unauthorized copying or reusing<br />
any part of thls page is illegal<br />
Answer<br />
[]<br />
Answer
Section I Sample Examination Two 39<br />
24. The stem plot below summarizes the number of gold medals earned by 40 countries in<br />
the Winter Olympics <strong>fo</strong>r 1924-1998.<br />
0 827990201 I 1001 101 10001000<br />
l 988<br />
2 9571<br />
3 9895<br />
43<br />
59<br />
6t<br />
78<br />
88<br />
The data depicts a distribution that is<br />
(A) skewed to the left<br />
(B) skerved to the right<br />
(C) symmetric<br />
(D) uni<strong>fo</strong>rm<br />
(E) not determinable from the in<strong>fo</strong>rmation given<br />
Ansrver<br />
25. A tire manufacturer claims that it has developed a new all-season radial tire <strong>fo</strong>r<br />
passenger cars (excluding SUVs) which has a shorter skid distance than the known mean<br />
skid distance, 140 feet, <strong>fo</strong>r all tires currently available. A consumer group wishes to test<br />
this claim. If 1.2 represents the true mean skid distance <strong>fo</strong>r this new tire, which of the<br />
<strong>fo</strong>llowing states the null hypothesis and alternative hypothesis that the consumer group<br />
should test?<br />
(A) H.: p < 140 ft. H,: lt > 140 ft.<br />
(B) H": /1< 140 ft. H^: lt > 140 ft.<br />
(C) H,: lt= I40 ft^ H^: /1< 140 ft.<br />
(D) H": F = 140 ft. H^: P < 140 ft.<br />
(E) H.: F = 140 ft' H^: F + 140 ft.<br />
lAnswer<br />
Unauthorized copying or reusing<br />
any part of this page is illegal.
4CI SarnpBe Examiuration Two Sectiom !<br />
25. Suppose that A and B are events in a sample space with P(A) = 0.8 and P(Blal = 61.5.<br />
Theri P(AandB) =<br />
(A) 0.3<br />
(B) 0.4<br />
(c) 0.62s<br />
(D) 0.8<br />
(E) i<br />
27 . A telephone survey of 1000 adult Americans ret eals the <strong>fo</strong>llowing data conceming the<br />
President's tax cut plan<br />
Support Oppose Undecided<br />
Male 300 180 90<br />
Female 2ra 190 30<br />
Suppose a study is conducted to test the assoication between gender and position on the<br />
tax cut plan. What is the expected number in the cell representing females who support<br />
the tax cut plan?<br />
(A) 210<br />
(B) 21s<br />
(c) 21e.3<br />
(D) 240.3<br />
(E) Not enough in<strong>fo</strong>rmation given<br />
Unauthorized copylng or reuslng<br />
any part of this page is lllegal<br />
nAnswer<br />
Ansrver
Section I Saenple Exarslinat[on Two 43<br />
28. Two independent random samples of size nr= 45andnz= 38. r,vith respective standard<br />
deviations 6r=2.3 and dz= 1.8, are drawn from trvo normally distributed populations.<br />
Which of the <strong>fo</strong>llor,ving represents an estimate of the standard deviation of the sampling<br />
distribution corresponding to xt- x2?<br />
(A) 0.2s<br />
rB) 0.31<br />
(c) 0.4s<br />
(D) 0.s0<br />
(E) 2,05<br />
29. SRS refers to a simple random sample. Suppose an SRS of size n is drawn from a<br />
population. Which of the <strong>fo</strong>llowing accurately character\zes this sample?<br />
I. It is a sample drawn in such a manner so that every set of n subjects in the<br />
population has an equal chance to be the sample chosen.<br />
Il. It is a sample drawn in such a manner so that every subject has some chance<br />
of being chosen.<br />
III. It is a sample drawn in such a manner that every subject in the population has<br />
an equal chance of being selected.<br />
(A) I only<br />
(B) II only<br />
(C) III only<br />
(D) II and III only<br />
(E) I, II, and III<br />
nAnsrver<br />
Answer<br />
any part of thls Page ls illegal
l'l Sample Examinaticn Two Section tr<br />
30. The points (x, y) on a scatterplot <strong>fo</strong>rm an<br />
can be concluded aboul the correlation r<br />
(A) r deueases in absolute value<br />
(B) r increases in absoluie value<br />
(C) r remains constant<br />
(D) the value of r changes sign<br />
(E) nc conclusion can be drarvn<br />
ellipse. As the ellipse becomes thinner. what<br />
between the variabies x and y'i<br />
EAnsrver<br />
31. The histogram below displays a set of measurements. Which of the boxplots belou'<br />
disolavs the same set of measurements?<br />
B<br />
7<br />
6<br />
>.5 O-<br />
C<br />
Oi<br />
l'<br />
o<br />
E3 LL<br />
(A) -il- E<br />
(D)<br />
ffl-.-<br />
copylng or<br />
any part ot this page is lllegal.<br />
2<br />
1<br />
0<br />
q<br />
(B)<br />
(E)<br />
(c)<br />
o<br />
Answer
Section tr Sample Examination T\vo<br />
32. The correlation r between the magnitude of an earthquake and the depth below the<br />
surface of the earlh at which the quake occurs has been determined experimentally to<br />
be about 0.51, Suppose we use the magnitude of the earthquake (x) to predict the depth<br />
below the surface (y) at which the quake occurs. We can infer that<br />
(A) the least squares regression line ofy on x has slope equal to 0.51<br />
(B) the fraction of the variatioir in depths explained by the least squares regression<br />
line ofy on x is 0.26<br />
(C) about 5lYo of the time, the magnitude of an earthquake will accurately predict<br />
the depth at which the earthquake occurs<br />
(D) the numerical value of the depth is usually 51% of the numerical value of the<br />
earthquake<br />
(E) twenty-six percent of the data values lie on the leas{ squaies regression line<br />
33. A report from the Maine Department of Inland Fisheries and Wildlife indicates that<br />
there occurs on average one fatality per 100 collisions between cars and deer. In 300<br />
collisions between a car and a deer, what is the expected number of fatalities and the<br />
standard deviation?<br />
(A) mean: 0.33 standard deviation : 0.01<br />
(B) mean: 1 standard deviation : 0.01<br />
(C) mean : 3 standard deviation : 1.72<br />
(D) mean: 3 standard deviation :2.97<br />
(E) mean: 30 standard deviation : 3.0<br />
43<br />
TAnswer<br />
Answer<br />
Unauthorized copying or reusing<br />
any part of this page is illegal.
Sample Examination TWo Section I<br />
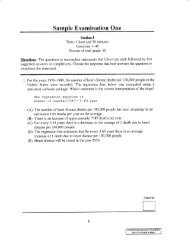
34. Johannes Kepler (1571-1630) was able to show that the square of the period of<br />
revolution of a planet is proportional to the eube of its mean distance from the sun. The<br />
equation y = 0.001118x''. where x is the distance of a planet irom the sun (in millions<br />
of miles) and y is the period of revolution (in years) of a planet around the sun, is a<br />
power regression model ivhich represents this relationslrip. Which of tire <strong>fo</strong>iiowing lviii<br />
produce a linear representation of this inodel?<br />
(A) plotting y versers ln x<br />
(B) plotting x versus ln x<br />
(C) plotting x versus ln y<br />
(D) plotting ln x versus ln y<br />
(E) constructing the residuai plot <strong>fo</strong>r the scatterplot of y vs. r<br />
3 5 . Which of the <strong>fo</strong>llowing is an appropriate graph to display univariate categorical data?<br />
(A) stemplot<br />
(B) histogram<br />
(C) boxplot<br />
(D) pie chart<br />
(E) scatterplot<br />
Answer<br />
Ansrver<br />
36. A large university is considering introducing a new major in Economic Geography and<br />
wishes to poll the current student body <strong>fo</strong>r their opinion of the feasibility of introducing<br />
such a rnajor. The Office of Public Relations mails a questionnaire on this issue to a<br />
SRS of 2000 students currently enrolled in the university. Of the 2000 questionnaires<br />
mailed, 532 have been returned of which2lg students supporl the new major. Which<br />
of the <strong>fo</strong>llowing represents the population <strong>fo</strong>r this study?<br />
(A) the 2000 students receiving the questionnaire<br />
(B) the 532 students who responded<br />
(C) the 219 students who support the nerv major<br />
(D) the 2000 students selected represent a sample of the population of all currently<br />
enrolled students<br />
(E) all students who are currently enrolled and all past alumni of the university<br />
copylng or<br />
any Part of this page Is lllegal.<br />
Answer
Section I Sample Examination Two<br />
37. A Physicians' Study Group wishes to design a matched pairs test to determine the<br />
effects of a medication on reducing the elevated cholesterol levels in 200 adults in the<br />
35-65 age group. Which of the <strong>fo</strong>llowing represents such a design?<br />
(A) The Physicians'Group compares cholesterol levels of each patient be<strong>fo</strong>re he/she<br />
begins a daily regimen of the medieine to the patient's cholesterol level after six<br />
weeks of using the medication.<br />
(B) The Physicians'Group compares the cholesterol ievels of tire patients using the<br />
medicine <strong>fo</strong>r six weeks with the cholesterol levels of 200 aduits in the same age<br />
group who exhibited elevated cholesterol ievels and did not take the medicine.<br />
(C) The Physicians' Group compared the mean cholesterol level of the 200 patients<br />
six weeks after using the medicine with a published national mean cholesterol<br />
level <strong>fo</strong>r ali adults in this age group.<br />
(D) The Physician's group compares cholesterol levels of the 200 patients using the<br />
medicine <strong>fo</strong>r six weeks with the cholesterol levels of 200 adults in the same ase<br />
group who were taking a placebo.<br />
(E) All of the above are representative of a matched pairs design.<br />
3 8. Let X represent the number of independent rolls of a fair die required to obtain the first<br />
"2".What is P(X = 5)?<br />
(A) (1/6)'(s/6)<br />
(B) (1/6)4<br />
(c) (s/6)'( 1/6)<br />
(D) (s/6)'<br />
(E) (5.6)'<br />
Answer<br />
Answer<br />
45<br />
copylng or reusing<br />
any part of thls page ls lllegal.
Sample Examination Tlvo Section I<br />
39. A local university has a "drop-in center" located near the Student Union rvhere students<br />
can "drop-in" to speak to a counselor on any issue or concern whether personal or<br />
academic. A researcher stations herself at a receptionist's desk during a few random<br />
evenings to collect data on whether men or women are more likely to use this service<br />
and whether a particular class (freshman, sophornore, junior. senior) is more likely to<br />
"drop-in." This study may be described as a<br />
(A) controlled experiment<br />
(B) matched pairs design<br />
(C) census<br />
(D) observational study<br />
(E) a double blind completely randomized experirnent<br />
40. A researcher wishes to use a 95o/o confidence interval to estimate the proportion of<br />
Americans who have visited an entertainment theme park near Orlando rvithin the last<br />
five years. The researcher rvishes to choose a size that will insure a margin of error not<br />
to exceed 0.05. Which of the <strong>fo</strong>llowins is the smallest size that meets these criteria?<br />
(A) 40<br />
(B) 200<br />
(c) 400<br />
(D) 600<br />
(E) 800<br />
copyrng or<br />
any part of thls Page ls lllegal.<br />
Answer<br />
nAnswer
Section II Sample Examination TWo<br />
Section II<br />
Part A<br />
Time-65 minutes<br />
Questions 1-5<br />
Percent of Section II srade-75<br />
Directions: Show all 5rour work. Indicate clearly the methods you use, because you will<br />
be gi'aded on the correctness of your method as well as on the accuracy of your results<br />
and exnlanations.<br />
L The table below shows the home run output of all Ameriean League and National<br />
League baseball teams during the 2000 season.<br />
American Leasue Home Runs<br />
Cleveland<br />
Kansas City<br />
Chicago White Sox<br />
Texas<br />
Anaheim<br />
New York Yankees<br />
Detroit<br />
Toronto<br />
Baltimore<br />
Minnesota<br />
Oakland<br />
Seattle<br />
Boston<br />
Tampa Bay<br />
221<br />
150<br />
2t6<br />
173<br />
236<br />
205<br />
177<br />
244<br />
184<br />
116<br />
239<br />
198<br />
167<br />
t62<br />
National Leazue Home Runs<br />
Colorado<br />
San Francisco<br />
Houston<br />
Cincinnati<br />
Atlanta<br />
St. Louis<br />
Pittsburgh<br />
Montreal<br />
Arizona<br />
New York Mets<br />
Florida<br />
Los Angeles<br />
Chicago Cubs<br />
San Diego<br />
Philadelphia<br />
Milwaukee<br />
161<br />
226<br />
249<br />
200<br />
t79<br />
235<br />
168<br />
178<br />
179<br />
198<br />
160<br />
2t1<br />
i83<br />
(a) In the area provided below, construct one histogram displaying the distribution of<br />
homerun output <strong>fo</strong>r all teams (both American and National Leagues). Describe<br />
the nature of the distribution noting the center of the distribution, skewness, and<br />
outliers (if any).<br />
183<br />
1AA<br />
ITT<br />
t77<br />
Unauthorized coDvino or<br />
any part of this page is illegal.
Sample Examination Two Section II<br />
(b) Draw box plots <strong>fo</strong>r the data in each of the two leagues and identifl, the fivenumber<br />
summary <strong>fo</strong>r each plot. What comparisons can you make between the<br />
homerun outputs of the two ieagues?<br />
(c) Construct a back-to-back stemplot displaying the homerun outputs of teams in<br />
the two leagues,<br />
or<br />
any part of thls page ls
Section I Sample Examination Two<br />
2. A telecommunications company uses three different systems to produce the print shaft<br />
holder <strong>fo</strong>r its most popular fax machine. System A produces 50o/o of the shaft holders,<br />
System B produces 30% ofthe shaft holders, and System C produces 20% ofthe shaft<br />
holders. The percentages of defective shaft holders produced by each system are<br />
respectively, 3Vo, 4Yo and 5o/o.<br />
(a) If a shaft holder is selected at random, what is the probability that it is defective?<br />
(b) If a shaft holder is selected at random and <strong>fo</strong>und to be defective, what is the<br />
probability that it was produced by System A?<br />
any part of thls pagB ls lll6gal.
50 Sample Exarnination Two Section [I<br />
3. A Television Monitoring Group (TMG) claims that at least three out of every <strong>fo</strong>ur<br />
Americans believe that realitv-based television shorvs are untruthful. They tested their<br />
claim by using data from a recent Gallup poll ufiich indicated that in a sample of 1 ,015<br />
Americans, 812 thought the shows were either somewhat or totally untruthful.<br />
(a) Testthe claim of theTMC using a signifieance level of 0.0i. State cleariy your<br />
assumptions and u,hat test of hypothesis you are using. Identifu an appropriate<br />
p-r'alue and interpret vour results ri'itiriir the context of the problenr.<br />
(b) Construct a9SYo confidence interval to estimate the true proportion of Americans<br />
who thinli these shows are essentially untruthful.<br />
Unauthorized coovino or<br />
any part of this page is lllegal.
Sectiosr II Sarnple Examination Two 51<br />
4. A survey was conducted recently in ten large American cities to<br />
there is any relationship between average weekday hotel rates and<br />
rates. The <strong>fo</strong>llowine data was collected.<br />
Daily Hotel Rate (x)<br />
(in dollars)<br />
149<br />
187<br />
17l<br />
r22<br />
lt)<br />
147<br />
128<br />
2r2<br />
168<br />
181<br />
(a) Construct a scatternlot <strong>fo</strong>r this data.<br />
(b) Use the scatterplot to determine if there<br />
variables.<br />
Daily Car Rental Rate (y)<br />
(in dollars)<br />
49<br />
50<br />
52<br />
49<br />
39<br />
44<br />
aa<br />
JI<br />
OJ<br />
40<br />
5l<br />
determine whether<br />
average car rental<br />
is a linear relationshio between the tu'o<br />
copying or reusing<br />
any part of this page is illegal
52 Sample Examination Two Section II<br />
(c) If there is a linear relationship, numerically describe the strength of this<br />
relationship and construct a least squares regression model.<br />
(d) Find tlie residual associated with the point (168, 46).<br />
(e) What percent of the variation in car rental rates is explained by the regression of<br />
yonx?<br />
ol<br />
any Part of thls page ls lllegal.
Section II Sample Examination Two<br />
5. A medical research group is interested in comparing the effectiveness of two new<br />
medications in reducing cholesterol levels in adult males ranging in age from 35-65<br />
years of age who have exhibited elevated cholesterol levels <strong>fo</strong>r at least six months, Four<br />
hundred men with elevated cholesterol levels in this age group were randomly selected<br />
in New Ycrrk City and 340 men were randomly selected in Philadelphia. It is suspected<br />
that results will differ greatly between the two cities due to a recent 'heart health'<br />
initiative in Philadelphia. Describe a randomized block design to conduct this<br />
experiment.<br />
53<br />
ot<br />
any part of thls page ls lllegal.
f,{ Sample Examination Two Seetion [I<br />
Section II<br />
Fart B<br />
Time-25 minutes<br />
Question 6<br />
Percent of Section II erade-25<br />
Direetions: Show'all your work. Indicate clearly the methods you use, because you wiil<br />
be graded on the correctness of your method as rvell as on the accuracy of your results<br />
and explanations.<br />
6. In 1 908 W. S. Gosset wrote a paper titled, "The Probable Error of a Mean". in the paper<br />
Gossett reported on the corn yieid using two different kinds of seeds. The first seed was<br />
the usual seed used by farmers in England at that time. The second seed type was kilndried.<br />
Each type of seed was planted in adjacent plots, accounting <strong>fo</strong>r 11 pairs of "split"<br />
plots. The data are given belorv. The numbers are in pounds per acre.<br />
Plot Regular Kiln-Dried<br />
1 903 20a9<br />
2 1935 1915<br />
J 1910 2011<br />
A<br />
L+ 2496 2463<br />
5 2 108 2180<br />
6 1961 1925<br />
7 2060 2122<br />
8 441 t482<br />
9 612 1542<br />
10 316 1443<br />
1t 5il 153 5<br />
The <strong>fo</strong>llowing computer outputs show the descriptive statistics of the two variables and<br />
a regression output which resulted from fitting a least squares regression line using<br />
yield from "regular" seed to predict yield from "kiln-dried" seed.<br />
Variable N Mean Medi-an TrMean StDev SE Mean<br />
Regular 11 1841 191-0 1-827 343 t_03<br />
Kiln-Dri 1l- 1875 L925 1858 333 t-00<br />
Variable Minimum Maximum Ql- Q3<br />
Regular l-31-6 2496 1511- 2060<br />
xiln-ori L443 2463 1535 2L22<br />
Predictor<br />
onstrant<br />
Ponrr'l rr<br />
copying or reusing<br />
any part of this page is lllegal.<br />
Coef StDev<br />
120 .4 LL6 .'l<br />
0.95293 0.06241<br />
R-Sq=l$.39 R-Sq (adj )<br />
=95.98<br />
T<br />
1-.03<br />
15 .21<br />
P<br />
0 "329<br />
0. 000
Section trI Sample Examination T\vo 55<br />
Below is a residual plot and a normal quantile plot of the residuals resulting from the<br />
regression.<br />
e<br />
E<br />
z<br />
2<br />
.2<br />
Residuals Versus REGULAR<br />
tesph3. is KLN-DRI)<br />
rso 2@ 25m<br />
REGULAR<br />
Normal Probabili\i Plot of the Residuals<br />
G.s@nse is KLN-oRl)<br />
Residual<br />
(a) Use side-by-side box plots to compare the corn yield <strong>fo</strong>r the two groups. Write a<br />
few sentences commenting on your display.<br />
(b) Can yield of "regular seed" be used to predict the yield of "kiln dried seed"?<br />
Give statistical justification to support your response.<br />
or reusrng<br />
any part of this page is illegal
Sample Examination Two Section Itr<br />
(c) Is there a difference in yield betu,een the two types of seeds'/ Give statistical<br />
justification to support your response.<br />
or<br />
any part ot thls Page ls lllegal.