Snail Lab Student
Snail Lab Student
Snail Lab Student

Create successful ePaper yourself
Turn your PDF publications into a flip-book with our unique Google optimized e-Paper software.
Page 1 of 4<br />
Name:<br />
Partner:<br />
Period:<br />
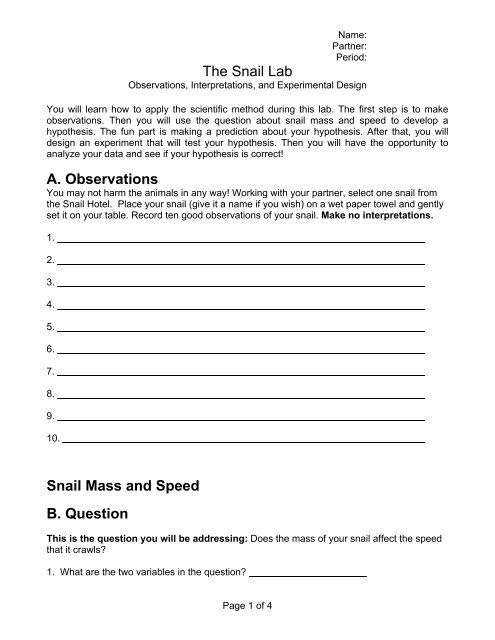
The <strong>Snail</strong> <strong>Lab</strong><br />
Observations, Interpretations, and Experimental Design<br />
You will learn how to apply the scientific method during this lab. The first step is to make<br />
observations. Then you will use the question about snail mass and speed to develop a<br />
hypothesis. The fun part is making a prediction about your hypothesis. After that, you will<br />
design an experiment that will test your hypothesis. Then you will have the opportunity to<br />
analyze your data and see if your hypothesis is correct!<br />
A. Observations<br />
You may not harm the animals in any way! Working with your partner, select one snail from<br />
the <strong>Snail</strong> Hotel. Place your snail (give it a name if you wish) on a wet paper towel and gently<br />
set it on your table. Record ten good observations of your snail. Make no interpretations.<br />
1.<br />
2.<br />
3.<br />
4.<br />
5.<br />
6.<br />
7.<br />
8.<br />
9.<br />
10.<br />
<strong>Snail</strong> Mass and Speed<br />
B. Question<br />
This is the question you will be addressing: Does the mass of your snail affect the speed<br />
that it crawls?<br />
1. What are the two variables in the question?
C. Hypothesis<br />
You and your partner decide on a hypothesis for the question. A hypothesis is a statement<br />
that explains an observation. H0 is your hypothesis of no difference (no effect) – There is no<br />
effect of the independent variable on the dependent variable. HA is your alternate hypothesis.<br />
H0:<br />
HA:<br />
Variables<br />
The independent variable is the factor that is the cause. The dependent variable is the effect<br />
and is influenced by the cause. A constant variable is a factor that needs to be the same for<br />
all snails tested. Fill in the following:<br />
Independent variable:<br />
Dependent variable:<br />
Constant variable 1:<br />
Constant variable 2:<br />
Constant variable 3:<br />
D. Materials & Methods<br />
Make a list of all the materials that you will need in order to conduct the experiment.<br />
Write a detailed description of how to test the effect of snail mass on speed. The level of<br />
detail must be sufficient for someone who is unfamiliar with this lab to be able to redo your<br />
experiment from your methods. Your experiment must run for at least 10 minutes.<br />
Do not proceed with your experiment until the teacher signs off on your lab write up. NO<br />
CREDIT will be given on this assignment if you do not get my signature. I will check your<br />
work and either tell you what needs to be changed or I will sign off on it.<br />
Teacher Signature<br />
Page 2 of 4
E. Results<br />
Observations and Notes<br />
Record the following: 1) observations on what you saw, 2) ideas on how to improve the<br />
experiment, and 3) any additional comments during the experiment.<br />
Data<br />
Fill in the following table with the data collected during the experiment. Don’t forget to write in<br />
the time interval used when the snail distances are calculated (e.g., 2 minute intervals).<br />
Table 1. The distance traveled by snails for each interval<br />
<strong>Snail</strong> Mass,<br />
g<br />
<strong>Snail</strong> A<br />
<strong>Snail</strong> B<br />
<strong>Snail</strong> C<br />
Distance<br />
Travelled, cm<br />
minutes<br />
Distance<br />
Travelled, cm<br />
minutes<br />
Distance<br />
Travelled, cm<br />
minutes<br />
Page 3 of 4<br />
Distance<br />
Travelled, cm<br />
minutes<br />
Total Distance Travelled (Cumulative) = distance travelled (time 1) + distance travelled (time 2)<br />
Table 2. Total distance travelled during the experiment<br />
Time, minutes<br />
Total Distance<br />
Travelled, cm<br />
<strong>Snail</strong> A<br />
Total Distance<br />
Travelled, cm<br />
<strong>Snail</strong> B<br />
Distance<br />
Travelled, cm<br />
minutes<br />
Total Distance<br />
Travelled, cm<br />
<strong>Snail</strong> C<br />
Graph<br />
Make an XY graph (line graph) of Time and Total Distance Travelled using the data from<br />
your 3 snails. Include a title (descriptive of all variables measured and the subject organism),<br />
label the axes, indicate units (min and cm), and number the axes ticks. Include a legend<br />
that indicates which snail is graphed for each set of data points. Connect the data points for<br />
each snail with a line, starting from 0. Make sure the independent and dependent<br />
variables are on the correct axes!
F. Conclusion<br />
What is the answer to the question you set out to answer about the snails? Include the<br />
following in your paragraph:<br />
1. Restate your original hypothesis (HA).<br />
2. Write about whether or not your Hypothesis was correct or not and why – refer to your data<br />
that you collected. Use actual numbers that you measured in your experiment.<br />
3. Why do you think you got the results that you did?<br />
4. What future experiments could be done with snails?<br />
Page 4 of 4