SampHe Exaxmixnati*rs Six - La Jolla High School
SampHe Exaxmixnati*rs Six - La Jolla High School
SampHe Exaxmixnati*rs Six - La Jolla High School

You also want an ePaper? Increase the reach of your titles
YUMPU automatically turns print PDFs into web optimized ePapers that Google loves.
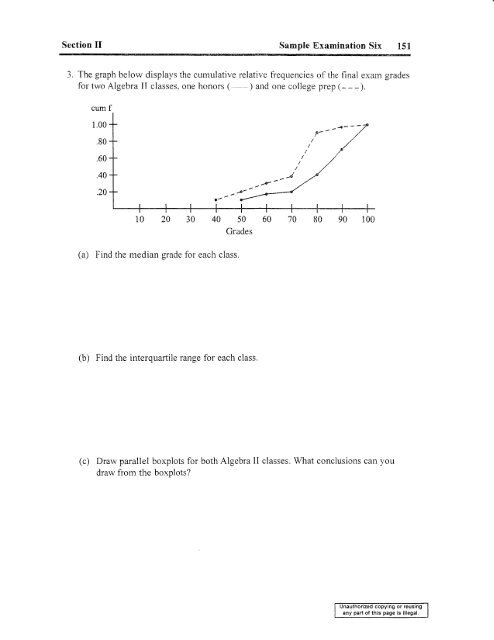
Section II Sample Examination <strong>Six</strong> 151<br />
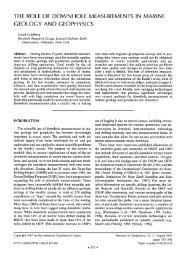
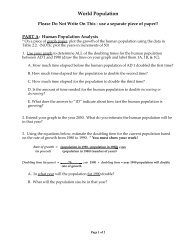
3. The graph below displays<br />
for two Alsebra II ciasses.<br />
cum f<br />
i.00<br />
.80<br />
.60<br />
.40<br />
.24<br />
t0<br />
20<br />
(a) Find the median grade<br />
the cumulative relatrve frequencies ofthe final exam grades<br />
onehonors( )and one college Frep (- - = ).<br />
30 4A 50 60<br />
for each class.<br />
Grades<br />
(b) Find the interquartile range for each class.<br />
(c) Drarv parallel boxplots for both Algebra II classes. What conciusions can you<br />
draw from the boxnlots?<br />
70<br />
BO<br />
90<br />
r00<br />
Unauthorized copying or reusing<br />
any part of this page is illegal.