Sample Examination One - La Jolla High School
Sample Examination One - La Jolla High School
Sample Examination One - La Jolla High School

Create successful ePaper yourself
Turn your PDF publications into a flip-book with our unique Google optimized e-Paper software.
<strong>Sample</strong> <strong>Examination</strong> <strong>One</strong><br />
Section I<br />
Time-l hour and 30 minutes<br />
Questions 1-40<br />
Percent of total grade-50<br />
Directions: The questions or incomplete statements that follow are each followed by five<br />
suggested answers or completions. Choose the response that best answers the question or<br />
completes the statement.<br />
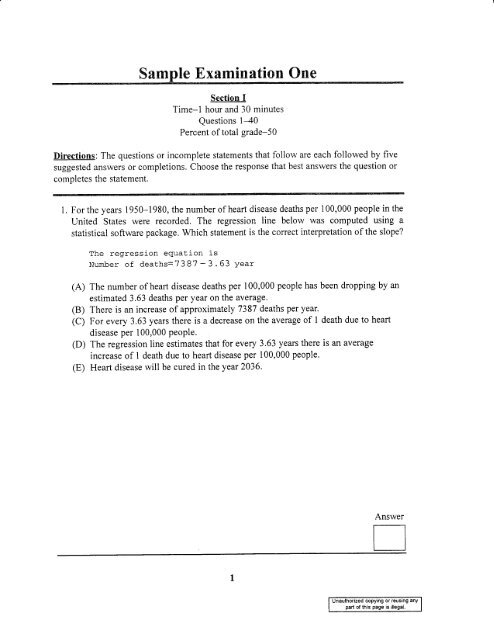
L F'or the years I950-1980, the number of heart disease deaths per I00,000 people in the<br />
United States were recorded. The regression line below was computed using a<br />
statistical software package. Which statement is the correct interpretation of the slope?<br />
The recrression eY- vv equaEion is<br />
Number of deaths=7387 - 3.63 year<br />
(A) The number of heart disease deaths per 100,000 people has been dropping by an<br />
estimated 3.63 deaths per year on the average'<br />
(B) There is an increase of approximately 7387 deaths per year"<br />
(C) For every 3,63 years there is a decrease on the average of I death due to heart<br />
disease per 100,000 people.<br />
(D) The regression line estimates that for every 3.63 years there is an average<br />
increase of I death due to heart disease per 100,000 people.<br />
(E) Heart disease will be cured in the year 2036'<br />
EAnswer<br />
coPyrng or reusrng any<br />
of this page is illegal.
Sarnple Exarnination <strong>One</strong> Section I<br />
2. Which of the follorving statements about a linear regression model is true?<br />
I. T'he sum of the residuals is al*,ays zero.<br />
IL [f 12= 0. the regression line is a horizontal line.<br />
III. No pattem in the residual plot is an indication that a nonlinear model ivili<br />
show a better fit to the data than a straight-line resressicn model.<br />
(A) i only<br />
(B) I and Il onll'<br />
(C) I and III oniy<br />
(D) II and III onl5'<br />
(E) I, II, and III<br />
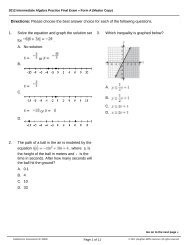
3. Whichof the following is more likeli, to be true of this distribution?<br />
(A) Mean:3<br />
(B) Mean = 3.5<br />
(C) Mean:4<br />
(D) Mean:3.5<br />
(E) Mean:3<br />
copyrng or reustng any<br />
part of lhis page is illegal<br />
Median<br />
Median<br />
Median<br />
Median<br />
Median<br />
3 Mode<br />
4 Mode<br />
3.5 Mode<br />
3.5 Mode<br />
2 Mode<br />
-a<br />
_J<br />
_J<br />
*a<br />
_J<br />
:5<br />
Answer<br />
tl<br />
Anslver
Section I<br />
Saxnple Exarnination <strong>One</strong><br />
4. For the past two-hundred years population per square feet in a northwest suburb can be<br />
modeled using the exponential equation: | = ab' The scatter plot of the data is shown<br />
below The R2 value of the exponential model is 0.98.<br />
c.)<br />
!<br />
d<br />
6)<br />
70<br />
60<br />
50<br />
40<br />
Which of the following statements is true?<br />
30<br />
2A<br />
10<br />
0<br />
1800 1900 2uuu<br />
(A) tf an attempt is made at fitting a straight iine model to the original data, the<br />
corresponding residual plot would be approximately linear'<br />
(B) If an attempt is made at fitting a straight line model to the original data, the<br />
corresponding residual plot would be scattered, and shorv no pattem.<br />
(C) lf an attempt is made at fitting a straight line model to the original data, the<br />
corresponding residual plot would be a straight line'<br />
(D) plotting the logarithm of the population per square mile against year should be<br />
approximatelY linear.<br />
(g) plotting the logarithm of the population per square mile against the logarithm of<br />
year should be approximately linear.<br />
Year<br />
Answer<br />
tt<br />
II<br />
copying or reuslng any<br />
parl of this page is illegal
<strong>Sample</strong> Exarnination <strong>One</strong> Section X<br />
Use thefollowing information.for question 5 and 6<br />
Those that study child development found a linear regression model for infants that<br />
uses age in months to predict height. A sample of l2 babies was randomly selected and<br />
the information shoivn below was senerated.<br />
S = 0 . 2560 R_Sq = 68 .98 R_Sq (adj ) = 69.5%<br />
Variable N Meari l"leor an TrMean StDev SE Mean<br />
Ase L2 23 .50 23.50 23.50 3 .61 1.04<br />
Heisht L2 79.850 79.800 79 .860 2.302 0.565<br />
5. The approximate slope of the least squares line is<br />
(A) 0.44<br />
(B) 0.s3<br />
(c) 1.08<br />
(D) 1.30<br />
(E) The slope cannot be determined from the given information<br />
6. About what percent of the observed variation in the height can be explained by leastsquares<br />
regression of height on age?<br />
(A) 26%<br />
(B) 2e%<br />
(c) 6e%<br />
(D) 83%<br />
(E) es%<br />
tJnauthorized copying or reusing any<br />
part of this page is<br />
Answer<br />
nAnswer
Section I <strong>Sample</strong> <strong>Examination</strong> <strong>One</strong><br />
7. In a statistics course, a linear regression equation was computed to predict the final<br />
exam score based on the score on the first test of the term. The equation was:<br />
y = 25 + 0.7 x where y is the final exam score and x is the score on the first test. George<br />
scored 80 on the first test. On the final exam Georse scored 85. What is the value of his<br />
residual?<br />
(A)<br />
(B)<br />
(c)<br />
(D)<br />
(E)<br />
I<br />
-T<br />
,+<br />
-.J<br />
8l<br />
8. Suppose the regression line for a set of data,<br />
If x and y are the sample means of the x and y<br />
(A) t<br />
(B) 7-2<br />
(c) r+5<br />
(D) 3x<br />
(E) 3r- I<br />
IAnswer<br />
] = 3x + b, passes through point (2, 5)"<br />
values respectively, then y =<br />
Ansrver<br />
9. You have sampled 25 students to find the mean SAT scores at Morris Knolls <strong>High</strong><br />
<strong>School</strong>. A95% confidence interval forthe mean SAT score is 900 to 1100. Which of<br />
the following statement gives a valid interpretation of this interval?<br />
(A) 95% of the 25 students have a mean score between 900 and I 100.<br />
(B) 95% of the population of all students at Morris Knolls have a score between 900<br />
and 1,100.<br />
(C) If this procedure were repeated many times, 95Y, of the resulting confidence<br />
intervals would contain the true mean SAT score at Morris Knolls.<br />
(D) If this procedure were repeated many times, 95%o of the sample means would be<br />
between 900 and 1100.<br />
(E) If 100 samples were taken and a95%o confidence interval was computed,5 of<br />
them would be in the interval from 900 to 1100.<br />
Answer<br />
Unauthorized copying or reusing any<br />
part of this page is illegal.
Sarnple Exarnination <strong>One</strong> Section I<br />
Use the folloving graphs.for questions l0-ll. Assume the heights (frequencies) of each<br />
picture use the same scale.<br />
30<br />
A<br />
_11<br />
40 20 30<br />
A{\<br />
'f L,<br />
10. Which distribution above iras the smallest standard deviation?<br />
11.<br />
(A) A<br />
(B) B<br />
(C) C<br />
(D) It cannot be determined from the graphs<br />
(E) All three distributions have the same standard deviation<br />
FJ<br />
In which distribution(s) would you be more likely to find the mean and median the<br />
same?<br />
(A) A only<br />
(B) B onll<br />
(C) C only<br />
(D)AandBonly<br />
(E) A, B, and C<br />
or reusrng any<br />
part of this page is illegal.<br />
20<br />
30<br />
L<br />
Answer<br />
Answer
Section I<br />
<strong>Sample</strong> Exarnination <strong>One</strong><br />
12. Ag0% confidence interval for a population mean is determined to be 800 to 900. If the<br />
confidence is increased to 95o/o confidence while the sample statistics and sample size<br />
remain the same, the confidence intenral fot /l<br />
(A) becomes narrower<br />
(B) becomes 0.05<br />
(C) does not change<br />
(D) becornes wider<br />
(E) becomes 0.025<br />
13, A large sample hypothesis test with o known of a null hypothesis lt--15 against the<br />
aitemative hypothesis lt+I5 results in the test statistic value of z=1.37' Assuming o<br />
is known, the corresponding p-value is approximately<br />
(A) 0.08s3<br />
(B) 0.1707<br />
(c) 0.4147<br />
(D) 0.8293<br />
(E) 0.9147<br />
Ansrver<br />
Answer<br />
14. Multiplying each element of the data set by an integer n nill have which affect on the<br />
mean and variance?<br />
(A) There is no change in the *.un and the variance is multiplied by n.<br />
(B) The variance is divided by / n and the mean is multiplied by iz.<br />
(C) The mean is multiplied by n and the variance is multiplied by n1<br />
(D) The mean is multiplie dby n and the variance is multipliedby / n.<br />
(E) Since mean and variance are dependent on sample size, one cannot determine the<br />
affect of multiPlYing bY n.<br />
Answer<br />
copying or reuslng any<br />
part of this page is illegal
Sanaple <strong>Examination</strong> <strong>One</strong> Section I<br />
I 5. A candidate for mayor hires a statistician to determine the amount of supporl he has for<br />
the upcoming election. The statistician tests ihe nuli hypothesis that the population<br />
proportion equals 500/o against the alternative hypothesis that the population proporlion<br />
is greater than 50o/o. The results of a simple random sample of 91 registered.voters can<br />
be found in the printout beloll,.<br />
Success<br />
Var.iable X N <strong>Sample</strong> P<br />
for Candidate 58 9L 0.637363<br />
The conclusion u'hich can be reached is:<br />
I. The candidate can be quite confident that he has more than 50% of ihe vote.<br />
il. Thep-value of 0.0044 tells us that we cannot rejectthe null hl,pothesis and<br />
that the candidate has 50% or less ofthe vote.<br />
III. Thep-value of 0.0044 indicates that it is not very likely to get an observed<br />
value of 0.637 if the null hypothesis is true.<br />
(A) I only<br />
(B) II only<br />
(C) III only<br />
(D) I and II<br />
(E) I and III<br />
16. Which of the following are true?<br />
I. The larger the sample, the smaller the spread in the sampling distribution.<br />
il. Provided that the population size is significantly greater than the sample size,<br />
the spread of a sampling distribution is about the same no matter what the<br />
samnle size.<br />
III. Sampling distributions from<br />
provided n is large.<br />
(A) II only<br />
(B) III only<br />
(C) I and ll only<br />
(D) I and III only<br />
(E) I, II, and III<br />
Unauthorized copying or reusing any<br />
parl of this page is illegal.<br />
= 0.5 vs p > 0.5<br />
for Candidat.e<br />
Exact P value<br />
0. c044<br />
Answer<br />
non-normal populations are approximately norrnal<br />
[-l<br />
Answer<br />
tl
Section I <strong>Sample</strong> Exarnination 0ne<br />
i7. An inspection procedure at a manufacturing plant involves picking three iterns at<br />
random and then accepting the whole lot if at least trvo of the three items are in perfect<br />
condition. If in reality 80% of the whole lot is perfect, what is the probability that the<br />
lot will be accepted?<br />
(A) 0.51 2<br />
(B) 0.560<br />
(c) 0.640<br />
(D) 0.896<br />
(E) 0.992<br />
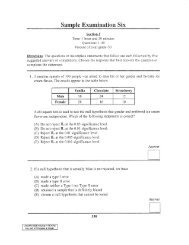
18. Given the data below, in conducting a test of association betr.l'een gender and grade,<br />
what is the expected count for the number of males rnho earned a grade of B?<br />
(A) 32.3<br />
(B) 3s.s<br />
(c) 36.8<br />
(D) 41.0<br />
(E) It cannot be determined<br />
A B C D<br />
Male 10 32 25 6<br />
Fernale 5 4l l4 12<br />
nAnswer<br />
Answer<br />
unauthonzed copyrng or reusrn9 any<br />
part of this page is illegal.
10 Sarnple <strong>Examination</strong> <strong>One</strong> Section E<br />
t9. Which of the folloning is true?<br />
I. A simple random sample is any sampling technique where each element of the<br />
population has the same chance of being selected.<br />
Il. A sirnple random sample is a sample where every set of n elements in the<br />
population has the same chance of being selected.<br />
III. From a population of ,\':1 0 there are 90 equally likely possible samples of size<br />
2 if we are sampling *,ithout replaceinent.<br />
(A) I only<br />
(B) lI only<br />
(C) III only<br />
(D) I and II only<br />
(E) I, II, and III<br />
20. Which statement is true about the boxplot below?<br />
I. It is a left skewed distribution u'hich has outliers.<br />
II. It is a symmetrical distribution u'hich has outliers.<br />
III. The interquartile range is less than 1.<br />
IV. Approximately 75o/o of the observations have a GPA less than 3,<br />
(A) I only<br />
(B) ll only<br />
(C) II and III<br />
(D) III and IV only<br />
(E) I, III, and IV<br />
Unauthorized copying or reuslng any<br />
part of this page is illegal<br />
Answer<br />
Answer
Section I <strong>Sample</strong> Exarnination <strong>One</strong> It<br />
2l . The level of significance is always<br />
(A) the maximum allowable probability<br />
(B) the maximum allowable probability<br />
(C) the same as the confidence<br />
(D) the same as the P-value<br />
(E) 1- P (type II error)<br />
ofType II error<br />
ofType I error<br />
Answer<br />
22. A statistics student wishes to test the strength of various brands of paper towel' He<br />
chooses 5 brands and selects 6 towels from each brand. He numbers them 1-30. He<br />
randomly selects atowel and places it in an embroidery hoop. Exactly 10 ml of water<br />
and a large weight are placed in the center of the towel. The time it takes for the towel<br />
to break is recorded. In this case, the explanatory variable is the<br />
(A) amount of time it takes for the towel to break<br />
(B) 1Oml of water and the large weight<br />
(C) brand of PaPer towel<br />
(D) large weight<br />
(E) number of paper towels used in the experiment<br />
tl<br />
ll<br />
Answer<br />
copying or reuslng any<br />
part of this page is illegal
ta <strong>Sample</strong> Exarnination <strong>One</strong> Section I<br />
23. A study rvas done to deterntine if the method of instruction (either lecture or discr"lssion)<br />
depended on the type of class r.r&ich was being taught. Twenff aft classes, seventeen<br />
math classes and tr,venty-five science classes r.vere observed. The method of instruction,<br />
discussion or lecture, was recorded. Which of the follorving best describes the<br />
reiationship betrveen method of teaching and type of class?<br />
rA)<br />
(B)<br />
(c)<br />
(D)<br />
art. s 5<br />
math 1-2<br />
science 15<br />
A: -^<br />
u*ouUSS<br />
lec t-ure<br />
l_5<br />
5<br />
10<br />
There appears to be no relationship since the number of discussion class and the<br />
number of lecture classes rvas exactly the same.<br />
No association can be detennined since the number of art. math and science<br />
classes rvere not exactly the same.<br />
There appears to be an association since the art class was less likely to use<br />
discussion then either math or science.<br />
There appears to be an association since the number of math and science classes<br />
is greater thar-r the number of arts classes.<br />
(E) A measure of association cannot be determined from these data.<br />
21. A researcher interested in the age at which women are having their first child surveyed<br />
a simple random sample af 250 women having at least one child and found a<br />
approximately normal distribution with a mean age of 27 .3 and a standard deviation of<br />
5.4. According to the empirical rule, also known as the 68-95-99"7 rule, approximately<br />
95% of the women had their first child between the ases of<br />
(A) 11.1 years and 43.5 years<br />
(B) 16.5 years and 38.1 years<br />
(C) 21.9 years and32,7 years<br />
(D) 21.9 years and 38.1 years<br />
(E) 25.0 years and 29.6 years<br />
Unauthorized copying or leusing any<br />
part of lhis page is illegal.<br />
Answer<br />
Answer
Section I <strong>Sample</strong> <strong>Examination</strong> <strong>One</strong> t3<br />
25. You want to estirnate the mean SAT score for a population of students with a 90%<br />
confidence interval. Assume that the population standard deviation is O= 100. If you<br />
want the margin of error to be approximately 10. which of the follorving would be the<br />
desired minimal samPle size?<br />
(A) 16<br />
(B) 38<br />
(c) 100<br />
D\ 271<br />
(E) 1476<br />
26. Ata certain high school, all students who take AP Psychology also take AP Statistics"<br />
Frorn past records, the probability that a student gets a 5 in AP Psychology is onefourth.<br />
The probability a student gets a 5 on the AP Statistics exam is one-seventh.<br />
What is the probability that a student will get at least one 5 when taking both exams<br />
(A)<br />
I. if the two events are independent?<br />
II. if the students getting a 5 on the AP Statistics exam are a subset of those<br />
students getting a 5 on the AP Psychology exam?<br />
(B)<br />
(c)<br />
(D)<br />
(E)<br />
11 1<br />
x,4<br />
11 I<br />
x,7<br />
91<br />
n,4<br />
91<br />
n,7<br />
51<br />
T4,4<br />
nAnswer<br />
EAnswer<br />
or reusing any<br />
pad of this Page is illegal
l4 <strong>Sample</strong> <strong>Examination</strong> <strong>One</strong> Section I<br />
27. The scores of a standardized test designed to measure math anxiety are normally<br />
distributed with a mean of I 00 and a standard deviation of 1 0 for a population of first<br />
year college students. Which of tlie following observations would you suspect is an<br />
outlier?<br />
(A) e0<br />
(B) 100<br />
(c) 1s0<br />
(D) 90, 100, and i50 are all outiiers<br />
(E) None of 90, i00, and 150 are outiiers<br />
28. Early studies of probability were conducted by the Italian mathematician Girolamo<br />
Cardano (1501-1576). <strong>One</strong> of the many dice games that Cardano studied r.r,as played<br />
with six 6-sided dice. Each of these six dice had five blank faces and one faee with a<br />
number. The numbers 1 through 6 each appeared on one of the six dice. All 6 dice were<br />
rolled at once, and the payoff to the gambler was based on the sum of the numbers<br />
showing on the up faces. What is the expected value of the sum obtained by rolling all<br />
6 dice?<br />
(A) 3<br />
(B) 3.5<br />
(c) 6<br />
(D) 36<br />
(E) It cannot be determined from the given information<br />
Unauthorized copying or reusing any<br />
part of this page is illegal.<br />
Answer<br />
Answer
Section I <strong>Sample</strong> <strong>Examination</strong> <strong>One</strong> t5<br />
29. Which of the following is true?<br />
I. If the sarnple size is constant, then reducing the probability of type I error will<br />
reduce the probability of type [I error.<br />
Ii. Increased power can be achieved by reducing the type II error.<br />
IIL If the p-value of a test is 0.0 I 5, the probability that the null hypothesis is true<br />
is 0.01 5.<br />
(A) I only<br />
(B) II oniy<br />
(C) I and III only<br />
(D) II and III only<br />
(E) I, Il. and III<br />
30. When two fair dice are<br />
the first die rolled is an<br />
@+<br />
G)+<br />
(q*<br />
(o)+<br />
(u)+<br />
rolled, what is the<br />
odd number?<br />
TAnswer<br />
probability of getting a sum of 7 given that<br />
Answer<br />
Unauthorized copying or reusing any<br />
part of this page is illegal.
t6 <strong>Sample</strong> <strong>Examination</strong> <strong>One</strong> Section tr<br />
31 . The residual plot belorv came from data which plotted grade at midterm against grade<br />
on final exam. A lir-rear regression line was calculated. Which conclusion could be<br />
reached by analyzing the residuai plot?<br />
Residual Plot<br />
60 70<br />
Midterm<br />
(A) An exponential curve could be used to predict final grade given midterm grade.<br />
(B) Students did better on the final exam then they did on the midterm.<br />
(C) There is evidence that a linear model is appropriate.<br />
(D) There exists unequal variance throughout the model.<br />
(E) There is no pattern evident in the residual plot.<br />
32. The heights of American men aged 18 to 24 are approximately normal with a mean of<br />
68 inches and a standard deviation of 2.5 inches. About 20% of these men are taller than<br />
(A) 66 inches<br />
(B) 68 inches<br />
(C) 70 inches<br />
(D) 72 inches<br />
(E) 74 inches<br />
copyrng or reusrng any<br />
parl of this page is illegal.<br />
Answer<br />
nAnswer
Section tr <strong>Sample</strong> <strong>Examination</strong> <strong>One</strong> l7<br />
33. Which of the following will most likely approximate a uniform distribution?<br />
(A) heights of students at a parlicular high school<br />
(B) weights of students at a particular high school<br />
(C) SAT scores of seniors at a particular high schooi<br />
(D) IQ scores of students at a particular high school<br />
(E) ages of students at a particular high school<br />
34. Polly takes three standardized tests. She scores 600 on all three. Using standard<br />
scores, or z-scores, rank her performance on the three tests from best to worst if the<br />
means and standard deviations for the tests are as follows:<br />
(A) I, II, and III<br />
(B) III, II, and I<br />
(C) I, III, and II<br />
(D) III, I, and II<br />
(E) II, I, and III<br />
Mean Standard Deviation<br />
Test I 500 80<br />
Test II 470 r20<br />
Test III 560 30<br />
nAnswer<br />
Answer<br />
[]<br />
Unauthorized copying or reusing any<br />
part of this page is
18 <strong>Sample</strong> <strong>Examination</strong> <strong>One</strong> Section I<br />
35. At a cedain high school a simple random sample u,as taken asking fifty-two 11th and<br />
l2th graders their political afflliation. The follou,ing two-way table rvas established, If<br />
a y2 test of independence were perfomed on these data, what would be the<br />
corresponding degrees of freedom?<br />
rA.I<br />
(B)<br />
(c)<br />
(D)<br />
(E)<br />
i<br />
a<br />
a<br />
J<br />
o<br />
1<<br />
11th Grade 12th Grade<br />
Republican t1 5<br />
Democrat 10 t5<br />
lndependent 5 6<br />
36. A student is interested in the effects of different walking styles on heart rate. He decides<br />
to use 30 volunteers from his school for his experiment. All 30 parlicipants find their<br />
at-rest pulse rates. Each parlicipant will walk twice for l0 minutes, once using a fast<br />
pace but with no arm movement and again using a fast pace, but u,ith an exaggerated<br />
affn movement style. The experimenter throws a coin to determine which style each<br />
participant r.l'ill r.valk first. All participants get sufficient rest betrveen rvalks to let their<br />
pulse rates return to normal. The student then compares increased pulse rate based on<br />
the walk with no arm movement to increased pulse rate based on the r,r,alk u,ith<br />
exaggerated arrn movement for each student.<br />
Which of the following statements is true?<br />
Ansrver<br />
(A) This is an observational study, and not an experiment, therefore no conclusion<br />
can be reached regarding u'alking style and pulse rate.<br />
(B) Observations in this study are independent.<br />
(C) Blocking is used in this study to reduce difference in increased pulse rates among<br />
individual students.<br />
(D) Because subjects rvere not assigned randomly to a control or an experimental<br />
group, the design of the experiment was flawed.<br />
(E) This is an example of a completely randomized comparative experiment without<br />
blocking.<br />
Unauthorized copying or reusing any<br />
part of this page is illegal.<br />
Answer
Section I<br />
<strong>Sample</strong> <strong>Examination</strong> <strong>One</strong><br />
37. AcupofcoffeeataMiniMarlisusually50cents.Themanagerofthestoredecidesto<br />
let the customer roll a die. If the die is a 6, the customer gets the cup of coffee for free'<br />
If the die is a 1, 2,3,4 or 5 the coffee is $1. A customer buys a cup of cofree at the mafi<br />
once a day, five clays a week. A statistics class wishes to know the number of cups of<br />
coffee which were free to the customer using a simulation. There r'vere 25 students in<br />
the class. Each student did 4 simulations. Which frequency table below is most likely<br />
to contain the results from these 100 trials?<br />
(A)<br />
Number of free<br />
cups ofcoffee<br />
0<br />
I<br />
2<br />
J<br />
A<br />
5<br />
Frequency<br />
1A<br />
t-<br />
18<br />
T]<br />
21<br />
IA<br />
IA<br />
16<br />
(D)<br />
Number of free<br />
cups ofcoffee Frequency<br />
0<br />
2<br />
J<br />
A<br />
T<br />
Number of free<br />
cups ofcoffee Frequency<br />
0<br />
2<br />
3<br />
39<br />
A'J<br />
4<br />
A I<br />
f<br />
0<br />
5<br />
0<br />
J<br />
5<br />
1A<br />
la<br />
4l<br />
(E)<br />
Number of free<br />
cups ofcoffee<br />
(c)<br />
Number of free<br />
cups of coffee<br />
0<br />
I<br />
Frequency<br />
0<br />
0<br />
2<br />
J<br />
J t7<br />
4 39<br />
5<br />
Frequency<br />
0<br />
J<br />
t1<br />
2 36<br />
J 30<br />
A IJ<br />
) I<br />
4l<br />
l9<br />
nAnswer<br />
copyrng or reusrng any<br />
part of this Page is illegal
20 Sarnple Exarnination <strong>One</strong> Section I<br />
38. Forthe owner of the Mini Marl in question 37, assume it costs 35 cents to<br />
cup of cofiee. Using the process of charging customers $1.00 if they get a 1,<br />
5 on a die and no charge if the die is a 6, what is the approxirnate expected<br />
cup to the owner?<br />
(A) 0.33<br />
(B) 0.48<br />
(c) 0.50<br />
(D) 0.6s<br />
(E) 0.83<br />
make one<br />
2,3, 4 or<br />
profit per<br />
39. An airline claims that its planes are, on average, less than 8 minutes late in landing. The<br />
appropriate hypotheses for examining the claim are<br />
(A) Ho: p
Section I <strong>Sample</strong> <strong>Examination</strong> <strong>One</strong> 2l<br />
40. A student was interested in the relationship between weight of a car and gas<br />
consumption measured in mpg. He selected sixteen different automobiles and recorded<br />
their weights along with their advertised mpg. The regression equation and regression<br />
plot are sholvn below<br />
40<br />
r<br />
''1<br />
Hro a<br />
Regression Plot<br />
Y = 62.5416 - 1.098-02X<br />
R-Sq = 92'1o7<br />
20<br />
2000 3000 4000<br />
Weight<br />
What affect would the addition of the point (4,300 lbs., l5.63mpg) have on the value<br />
of r2?<br />
(A) It will have no effect on r2 because it lies on the line.<br />
(B) It will have no effect on r2 because its value is the same as (T, y).<br />
(C) It will decrease r' because it is an outlier.<br />
(D) It will increase r2 becuuse it is an influential point which lies on the least squares<br />
line.<br />
(E) It will increase 12 because every additional point will increase the percent<br />
variation in y due to the relationship with the least squares line.<br />
[-l<br />
Answer<br />
tl<br />
copying or reusing any<br />
parl of this page is illegal
Section II<br />
Fart A<br />
Time-65 minutes<br />
Questions 1-5<br />
Percent of Section II erade-75<br />
Directions: Show all your work. indicate clearly the methods vou use, because you will<br />
be graded on the correctness of your method as well as on the accuracy of your results<br />
and explanations.<br />
1. Johannes Kepler spent years trying to discover a relationship between the time (in days)<br />
for a planet to revolve around the sun and the distance (in miilions of kilometers) of the<br />
planet from the sun. A computer printout of a regression analysis is sho*'n belorv for<br />
all nine planets in our universe.<br />
Predictor- Coef StDev T p<br />
Constant -5826 3303 -L.16 0.L2L<br />
Di-stance L5.021 l.2LB L2 .34 0.000<br />
S ='741L R-Sq = 95.58 R-Sq(adj) = 95.0%<br />
(a) What is the least squares line which could be used to predict,the time it takes for<br />
a planet to revolve around the sun given the distance a planet is from the sun?<br />
(b) Interpret the slope in the context of the problem.<br />
Unauthorized copying or reusing any<br />
part of this page is illegal.<br />
1)
Section trI <strong>Sample</strong> <strong>Examination</strong> <strong>One</strong> 23<br />
(c) For a distance of 15000 million kilometers, what is the predicted time for one<br />
revolution around the sun?<br />
(d) Explain clearly what the p-value in the "DISTANCE" row of the computer<br />
printout means.<br />
(e) The residual plot is given below. Does the plot indicate that a line is an<br />
appropriate model to use for these data? Explain why or why not.<br />
v)<br />
rYl<br />
10,000<br />
500<br />
-0<br />
-500<br />
-10,000<br />
-15,000<br />
Residual Plot<br />
0 1000 2000 3000 4000 5000 6000<br />
Distance in millions of kilometers<br />
copying or reusrng anY<br />
part of this page is illegal
'la Sarnple <strong>Examination</strong> <strong>One</strong> Seetion II<br />
2. A study was conducted to investigate effecis of regular exercise on rveight loss cf<br />
adults. Nine subjects selected randomly lrom a population rvere weighed before a<br />
program of regular exercise and then again three weeks after. Data are listed below as<br />
w,eights of subjects in kilograrns before and after the exercise program. The ciaim is<br />
that the r'i'eights after the program are less than the iveigl^rts before iire program<br />
Before<br />
Exercise Prograrn<br />
Do these data support the claim that<br />
weight? Use statistical evidence to<br />
assumotions.<br />
or reusrng any<br />
part of this page is illegal<br />
After'<br />
Exercise Program<br />
99 )i<br />
5l 55<br />
62 58<br />
69 66<br />
74 75<br />
77<br />
'16<br />
59 56<br />
92 88<br />
70 65<br />
tne exerclse program rs effective in reducing<br />
justify your response, State clearly your
Section [l <strong>Sample</strong> <strong>Examination</strong> <strong>One</strong> 25<br />
3. A student wishes to study the effects of sugar on pulse rate. He knows that males and<br />
females pulse rates react differently to the ingestion of sugar. There are 36 volunteers,<br />
18 males and 18 females who r.l,ill participate in the study.<br />
(a) Design an experiment which would study the effects of sugar on pulse rate.<br />
Carefully describe all steps and procedures.<br />
(b) What are the explanatory and response variables?<br />
(c) What is done to control differences between males and fernale?<br />
(d) What is your control group?<br />
(e) Draw a diagram to illustrate your design'<br />
c0pyrn9 or feuslng any<br />
part of this page is illegal
26 Sarnple <strong>Examination</strong> ()ne Section Il<br />
4. A real estate agent in Texas rvished to determine if there was a relationship betn'een<br />
where a house rvas located and the number of bedrooms the house has. The agent<br />
selected the past 518 home sales during the months of June through September. The<br />
data collected is shornn belorv:<br />
2 bedrooms 40<br />
CITIES<br />
Dallas Fort Worth Other<br />
al<br />
JI l1<br />
3 bedrooms 157 91 bl<br />
4 bedrooms 46 44 37<br />
(a) Calculate the relative percentages of 2,3, arid 4 bedroom homes for each of the 3<br />
cities.<br />
(b) Do these data provide convincing evidence of an association between the<br />
location of a house and number of bedrooms a house has? Give appropriate<br />
statistical evidence to support your conclusion.<br />
Unauthorized copying or reusing any<br />
part of this page is illegal.
Section II Sarnple Exarnination <strong>One</strong> 27<br />
5. An experimenter wanted to determine if weights differed between smokers and nonsmokers.<br />
She randomly selected 92 people, all from the same age group and records if<br />
they smoke or they do not smoke. She then records their current weight, Shown below<br />
is a comouter analvsis of the variable weisht for smokers and non-smokers.<br />
\r--l -Ll ^<br />
v d! fdufc<br />
Variable<br />
Smokes<br />
No<br />
Yes<br />
Smokes<br />
No<br />
Yes<br />
N<br />
64<br />
2B<br />
SE Mean<br />
2 .95<br />
(a) Is this an experiment? Explain<br />
conclusions we can draw from<br />
(b) Are there any outliers in either<br />
work to verifu your answer.<br />
racart<br />
1 Aa i-)<br />
Median<br />
1-41.00<br />
1-51.50<br />
Minimum Maximum<br />
95.00 215.00<br />
108.00 190 .00<br />
rvhy or why not.<br />
the study?<br />
a ! r'IE all<br />
I4I . 12<br />
1 q,) \A<br />
.}'l<br />
123. s0<br />
132.00<br />
How does this affect the<br />
SLDev<br />
23.6A<br />
22.89<br />
a)?<br />
l-55.00<br />
170.00<br />
the smokers or nonsmokers group l Show the<br />
Unauthorized copyang 0r reusrng any<br />
part of this page is rllegal.
Section {{<br />
Part B<br />
Time-25 minutes<br />
Question 5<br />
Percent of Section lI srade-25<br />
Dinections: Shorv all your work. Indicate clearly the methoels vou use, because 5,ou *,ill<br />
be graded on the correctness of vour method as rvell as on the accuracy clf ycur results<br />
and explanations.<br />
6" Two srvimmers have been training for a big race in the 100 meter backstroke. Their<br />
times are knorvn to be normally distributed with the follorving distributions (in<br />
seconds). We can also assuine thatthe times of the two swimmers are independent.<br />
swimmer 1: mean = 76.76 standard deviation : 3.08<br />
swimmer 2: mean = 77.9 standard deviation :2.49<br />
(a) The srvimmers keep track of their progress over the season. What is the mean<br />
and standard deviatior-r of the first sn,irnmer's time (x) minus the second<br />
srl'immer's [v) time?<br />
H'- r=<br />
6*-)'=<br />
(b) Using your results in part (a), what is the probability the second swimmer rvill<br />
beat the first s*'immer on any given race? Round your answer to the nearest<br />
hundredth. Please note that the lowest time q,ins a race.<br />
or feusrn9 any<br />
part of this page is illegal<br />
28
Section II Sawrple <strong>Examination</strong> <strong>One</strong> ?q<br />
(c) Using your results in part (b). rvhat is the probability that the second srvimmer<br />
will beat the first swimmer in 6 or more of l0 independent races?<br />
(d) If a sample of 10 races were taken from each swimmer, rvhat is the probability<br />
that the average tirne of the ten races for the first swimmer would be better than<br />
the average time for the ten races of the second swimmer?<br />
copyrng or reusing any<br />
part ot this page is illegai