Evolution of Antibiotic Resistance-Printable Format - Teach ...
Evolution of Antibiotic Resistance-Printable Format - Teach ...
Evolution of Antibiotic Resistance-Printable Format - Teach ...

You also want an ePaper? Increase the reach of your titles
YUMPU automatically turns print PDFs into web optimized ePapers that Google loves.
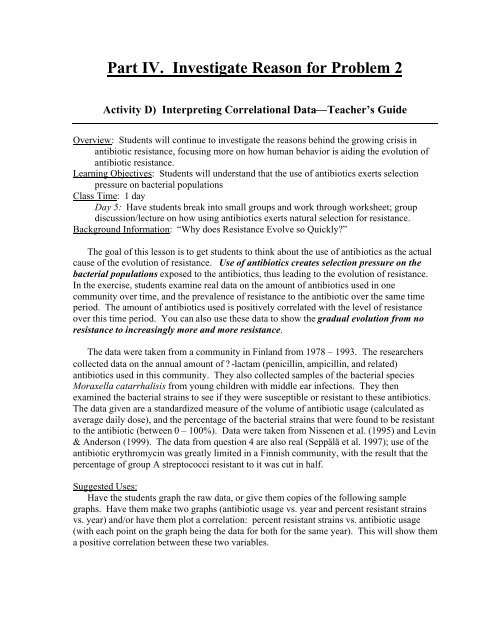
Part IV. Investigate Reason for Problem 2<br />
Activity D) Interpreting Correlational Data—<strong>Teach</strong>er’s Guide<br />
Overview: Students will continue to investigate the reasons behind the growing crisis in<br />
antibiotic resistance, focusing more on how human behavior is aiding the evolution <strong>of</strong><br />
antibiotic resistance.<br />
Learning Objectives: Students will understand that the use <strong>of</strong> antibiotics exerts selection<br />
pressure on bacterial populations<br />
Class Time: 1 day<br />
Day 5: Have students break into small groups and work through worksheet; group<br />
discussion/lecture on how using antibiotics exerts natural selection for resistance.<br />
Background Information: “Why does <strong>Resistance</strong> Evolve so Quickly?”<br />
The goal <strong>of</strong> this lesson is to get students to think about the use <strong>of</strong> antibiotics as the actual<br />
cause <strong>of</strong> the evolution <strong>of</strong> resistance. Use <strong>of</strong> antibiotics creates selection pressure on the<br />
bacterial populations exposed to the antibiotics, thus leading to the evolution <strong>of</strong> resistance.<br />
In the exercise, students examine real data on the amount <strong>of</strong> antibiotics used in one<br />
community over time, and the prevalence <strong>of</strong> resistance to the antibiotic over the same time<br />
period. The amount <strong>of</strong> antibiotics used is positively correlated with the level <strong>of</strong> resistance<br />
over this time period. You can also use these data to show the gradual evolution from no<br />
resistance to increasingly more and more resistance.<br />
The data were taken from a community in Finland from 1978 – 1993. The researchers<br />
collected data on the annual amount <strong>of</strong> ? -lactam (penicillin, ampicillin, and related)<br />
antibiotics used in this community. They also collected samples <strong>of</strong> the bacterial species<br />
Moraxella catarrhalisis from young children with middle ear infections. They then<br />
examined the bacterial strains to see if they were susceptible or resistant to these antibiotics.<br />
The data given are a standardized measure <strong>of</strong> the volume <strong>of</strong> antibiotic usage (calculated as<br />
average daily dose), and the percentage <strong>of</strong> the bacterial strains that were found to be resistant<br />
to the antibiotic (between 0 – 100%). Data were taken from Nissenen et al. (1995) and Levin<br />
& Anderson (1999). The data from question 4 are also real (Seppälä et al. 1997); use <strong>of</strong> the<br />
antibiotic erythromycin was greatly limited in a Finnish community, with the result that the<br />
percentage <strong>of</strong> group A streptococci resistant to it was cut in half.<br />
Suggested Uses:<br />
Have the students graph the raw data, or give them copies <strong>of</strong> the following sample<br />
graphs. Have them make two graphs (antibiotic usage vs. year and percent resistant strains<br />
vs. year) and/or have them plot a correlation: percent resistant strains vs. antibiotic usage<br />
(with each point on the graph being the data for both for the same year). This will show them<br />
a positive correlation between these two variables.