- Page 1 and 2:
arXiv:astro-ph/0112551v1 27 Dec 200
- Page 3 and 4:
4.1.1 Emergence of Non-Gaussianity
- Page 5 and 6:
6.11.1 Maximum Likelihood Estimates
- Page 7 and 8:
1 Introduction and Notation Underst
- Page 9 and 10:
with N-point functions, whereas Cha
- Page 11 and 12:
Table 3 Notation for the Cosmic Fie
- Page 13 and 14:
2 Dynamics of Gravitational Instabi
- Page 15 and 16:
In the following we will only use c
- Page 17 and 18:
∂u(x, τ) + H(τ) u(x, τ) = −
- Page 19 and 20:
Eq. (17) we can write the vorticity
- Page 21 and 22:
θn(k) = d 3 q1 . . . d 3 qn δD(k
- Page 23 and 24:
2.4.3 Cosmology Dependence of Non-L
- Page 25 and 26:
approximation f(Ωm, ΩΛ) = Ω3
- Page 27 and 28:
The somewhat complicated expression
- Page 29 and 30:
where Φ denotes the gravitational
- Page 31 and 32:
or more precisely D2(τ) ≈ − 3
- Page 33 and 34:
ever turning around, washing out st
- Page 35 and 36:
2.9.2 Direct Summation Also known a
- Page 37 and 38:
(e.g., [314,532]). Finally, it is w
- Page 39 and 40:
such initial conditions are likely
- Page 41 and 42:
3.2.1 Statistical Homogeneity and I
- Page 43 and 44:
δ 1 δ δ 2 3 c = δ1 c = 00000 11
- Page 45 and 46:
3.2.5 Probabilities and Correlation
- Page 47 and 48:
3.3.3 Generating Functions It is co
- Page 49 and 50:
values of y are then also of the or
- Page 51 and 52:
4 From Dynamics to Statistics: N-Po
- Page 53 and 54:
Figures 5 and 6 show the tree diagr
- Page 55 and 56:
e approximated by a fitting functio
- Page 57 and 58:
Fig. 10. The tree-level three-point
- Page 59 and 60:
4 2 0 0.2 0.4 0.6 0.8 0.2 0.4 0.6 0
- Page 61 and 62:
n P13/(πA 2 a 4 ) P22/(πA 2 a 4 )
- Page 63 and 64:
Fig. 13. The power spectrum for n =
- Page 65 and 66:
where: B222 ≡ 8 d 3 qPL(q, τ)F
- Page 67 and 68:
Fig. 16. The left panel shows the o
- Page 69 and 70:
them in Sect. 5.6. It is worth emph
- Page 71 and 72:
Fig. 17. The reduced bispectrum ˜
- Page 73 and 74:
(1) There are no characteristic tim
- Page 75 and 76:
velocity exactly cancels the Hubble
- Page 77 and 78:
A simple generalization of this arg
- Page 79 and 80:
growth factor has been written as D
- Page 81 and 82:
function in the stable clustering l
- Page 83 and 84:
S sat 4 (n) = 16 Qsat 4 (n) = 8 54
- Page 85 and 86:
For the reasons discussed in Sect.
- Page 87 and 88:
δ δ Evolution of an initially und
- Page 89 and 90:
obtained by expansion about Ωm =
- Page 91 and 92:
y the orthogonality relation betwee
- Page 93 and 94:
σ = 2 ; ν σ = ; 4 2 ν σ = 6 3
- Page 95 and 96:
(that plays a role similar to the v
- Page 97 and 98:
Fig. 26. The predicted Sp parameter
- Page 99 and 100:
Table 6 Tree-level and one-loop cor
- Page 101 and 102:
expressed in terms of the linear de
- Page 103 and 104:
give to non-Gaussian initial condit
- Page 105 and 106:
+ −4 + 8 3 SG 3 − 1 S 6 G 2 3
- Page 107 and 108:
the initial conditions. In Sect. 2.
- Page 109 and 110:
Fig. 30. The ratio of the tree-leve
- Page 111 and 112:
5.8 The Density PDF Up to now, we h
- Page 113 and 114:
Fig. 32. Comparison between predict
- Page 115 and 116:
9 5 p(δ) = 3/2 4π Ns(1 + δ) 3 σ
- Page 117 and 118:
Table 10 Parameters of the singular
- Page 119 and 120:
5.10.2 The Shape of the PDF The abo
- Page 121 and 122:
Fig. 35. Example of a joint PDF of
- Page 123 and 124:
Table 11 The coefficients a1,... ,a
- Page 125 and 126:
originally in previous work in the
- Page 127 and 128:
Table 12 Parameters used in fit (35
- Page 129 and 130:
6 From Theory to Observations: Esti
- Page 131 and 132:
the size of the catalog and optimiz
- Page 133 and 134:
The cosmic error is most useful whe
- Page 135 and 136:
expectation number ¯ N = ¯ngv, P
- Page 137 and 138:
1 〈δn(k1)δn(k2)δn(k3)〉 = N2
- Page 139 and 140:
catalog, the latter being equivalen
- Page 141 and 142:
size. In this regime, where ξ(r) i
- Page 143 and 144:
The expressions (395) and (400) can
- Page 145 and 146:
The techniques developed to measure
- Page 147 and 148:
At smaller scales, in the regime k
- Page 149 and 150:
Fig. 38. The top panel shows the me
- Page 151 and 152: If ¯ng is determined with arbitrar
- Page 153 and 154: Factorial moments thus verify Fk =
- Page 155 and 156: To second order the cosmic bias [Eq
- Page 157 and 158: The finite-volume error comes from
- Page 159 and 160: 6.7.5 Cosmic Error and Cosmic Bias
- Page 161 and 162: factorial moment correlators [620]
- Page 163 and 164: The generalization of Eq. (422) rea
- Page 165 and 166: in [152]. Similarly to Eq. (472), t
- Page 167 and 168: constrain theories with observation
- Page 169 and 170: From this simple result, we see tha
- Page 171 and 172: Fig. 41. The cosmic distribution fu
- Page 173 and 174: of functions of the data ˆx. The p
- Page 175 and 176: 6.11.2 Quadratic Estimators In real
- Page 177 and 178: is positive and compact in Fourier
- Page 179 and 180: 6.12 Measurements in N-Body Simulat
- Page 181 and 182: 7 Applications to Observations 7.1
- Page 183 and 184: properties of the matter distributi
- Page 185 and 186: deterministic bias results hold for
- Page 187 and 188: effects due to the gravitational dy
- Page 189 and 190: 0000 1111 0000 1111 ϕ (y)= 0000 11
- Page 191 and 192: where the volume V = 4πR3 /3 is re
- Page 193 and 194: in Sect. 7.1.3, Eq. (555), plus Eqs
- Page 195 and 196: In the following we first review th
- Page 197 and 198: if the 3D correlation function is
- Page 199 and 200: Table 13 Projection factors for dif
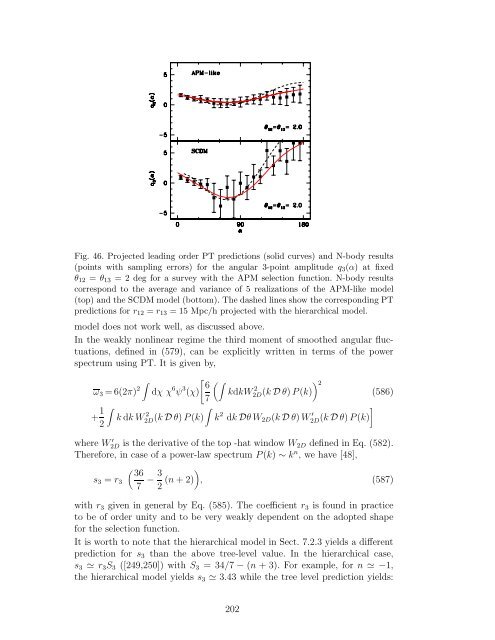
- Page 201: Note that the rp coefficients are v
- Page 205 and 206: 7.3 Weak Gravitational Lensing The
- Page 207 and 208: elation (598) is then entirely dime
- Page 209 and 210: 7.4 Redshift Distortions In order t
- Page 211 and 212: where [δD]n ≡ δD(k − k1 −
- Page 213 and 214: proximation. In fact, Eq. (616) is
- Page 215 and 216: Fig. 48. The left panel shows the b
- Page 217 and 218: They obtained analogous results to
- Page 219 and 220: that for wide surveys such as 2dFGR
- Page 221 and 222: Machine, [374]) and COSMOS [421] mi
- Page 223 and 224: Table 14 Angular Catalogs. The firs
- Page 225 and 226: The DeepRange Catalog ([530] 1998)
- Page 227 and 228: Fig. 50. The two-point angular corr
- Page 229 and 230: Fig. 51. The APM 3D power spectrum
- Page 231 and 232: linearization first done in [289] a
- Page 233 and 234: most of the measurements only probe
- Page 235 and 236: and Rb = 4.3 ± 1.2 [226]. These re
- Page 237 and 238: 3 2 1 3 2 1 0 -1 10 5 0 -5 -10 0 90
- Page 239 and 240: Table 16 The reduced skewness and k
- Page 241 and 242: estimations are split in its 6 × 6
- Page 243 and 244: the near future. An early applicati
- Page 245 and 246: The Stromlo-APM redshift survey ([4
- Page 247 and 248: A recent linear analysis of the LCR
- Page 249 and 250: at the non-linear scale, and no sig
- Page 251 and 252: Fig. 57. The redshift-space reduced
- Page 253 and 254:
Table 19 Some measurements of S3 an
- Page 255 and 256:
Fig. 60. The redshift-space skewnes
- Page 257 and 258:
such as the abundance of massive cl
- Page 259 and 260:
the weakly non-linear regime is qui
- Page 261 and 262:
the mock catalogs. The resulting 3D
- Page 263 and 264:
few technical issues that need more
- Page 265 and 266:
A The Spherical Collapse Dynamics T
- Page 267 and 268:
More specifically we define ϕ(y) a
- Page 269 and 270:
∞ (−τ1) τ2 =ξ y1 νp p=1 p
- Page 271 and 272:
This result writes as a kind of com
- Page 273 and 274:
E PDF Construction from Cumulant Ge
- Page 275 and 276:
E.3 Approximate Forms for P(ρ) whe
- Page 277 and 278:
A simple change of variable, t 1−
- Page 279 and 280:
It is then easy to calculate cross-
- Page 281 and 282:
References [1] S.J. Aarseth, E.L. T
- Page 283 and 284:
[54] F. Bernardeau, R. Van De Weyga
- Page 285 and 286:
[100] A. Buchalter, M. Kamionkowski
- Page 287 and 288:
[150] S. Colombi, F.R. Bouchet, L.
- Page 289 and 290:
[196] G. Efstathiou, in Cosmology a
- Page 291 and 292:
[245] A. Gangui, Phys. Rev. D, 62,
- Page 293 and 294:
[299] A.J.S. Hamilton, M. Tegmark,
- Page 295 and 296:
[352] R. Jeannerot, Phys. Rev. D, 5
- Page 297 and 298:
[399] A.R. Liddle, D.H. Lyth, Phys.
- Page 299 and 300:
[448] P. McDonald, J. Miralda-Escud
- Page 301 and 302:
[497] J.A. Peacock, S. Cole, P. Nor
- Page 303 and 304:
[547] R.F. Sanford, 1917, Lick Obse
- Page 305 and 306:
[597] M. Snethlage, Metrica, 49, (1
- Page 307 and 308:
[644] A.N. Taylor, P.I.R. Watts, MN
- Page 309:
[692] M.B. Wise, in The Early Unive