Large-Scale Structure of the Universe and Cosmological ...
Large-Scale Structure of the Universe and Cosmological ...
Large-Scale Structure of the Universe and Cosmological ...

You also want an ePaper? Increase the reach of your titles
YUMPU automatically turns print PDFs into web optimized ePapers that Google loves.
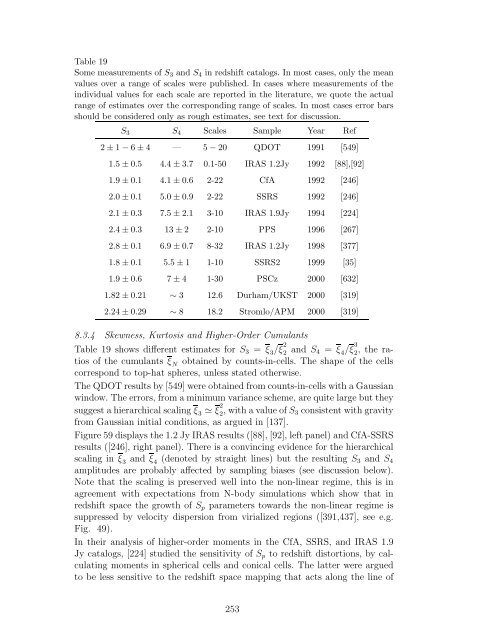
Table 19<br />
Some measurements <strong>of</strong> S3 <strong>and</strong> S4 in redshift catalogs. In most cases, only <strong>the</strong> mean<br />
values over a range <strong>of</strong> scales were published. In cases where measurements <strong>of</strong> <strong>the</strong><br />
individual values for each scale are reported in <strong>the</strong> literature, we quote <strong>the</strong> actual<br />
range <strong>of</strong> estimates over <strong>the</strong> corresponding range <strong>of</strong> scales. In most cases error bars<br />
should be considered only as rough estimates, see text for discussion.<br />
S3 S4 <strong>Scale</strong>s Sample Year Ref<br />
2 ± 1 − 6 ± 4 — 5 − 20 QDOT 1991 [549]<br />
1.5 ± 0.5 4.4 ± 3.7 0.1-50 IRAS 1.2Jy 1992 [88],[92]<br />
1.9 ± 0.1 4.1 ± 0.6 2-22 CfA 1992 [246]<br />
2.0 ± 0.1 5.0 ± 0.9 2-22 SSRS 1992 [246]<br />
2.1 ± 0.3 7.5 ± 2.1 3-10 IRAS 1.9Jy 1994 [224]<br />
2.4 ± 0.3 13 ± 2 2-10 PPS 1996 [267]<br />
2.8 ± 0.1 6.9 ± 0.7 8-32 IRAS 1.2Jy 1998 [377]<br />
1.8 ± 0.1 5.5 ± 1 1-10 SSRS2 1999 [35]<br />
1.9 ± 0.6 7 ± 4 1-30 PSCz 2000 [632]<br />
1.82 ± 0.21 ∼ 3 12.6 Durham/UKST 2000 [319]<br />
2.24 ± 0.29 ∼ 8 18.2 Stromlo/APM 2000 [319]<br />
8.3.4 Skewness, Kurtosis <strong>and</strong> Higher-Order Cumulants<br />
Table 19 shows different estimates for S3 = ξ3/ξ 2<br />
2 <strong>and</strong> S4 = ξ4/ξ 3<br />
2 , <strong>the</strong> ratios<br />
<strong>of</strong> <strong>the</strong> cumulants ξN obtained by counts-in-cells. The shape <strong>of</strong> <strong>the</strong> cells<br />
correspond to top-hat spheres, unless stated o<strong>the</strong>rwise.<br />
The QDOT results by [549] were obtained from counts-in-cells with a Gaussian<br />
window. The errors, from a minimum variance scheme, are quite large but <strong>the</strong>y<br />
suggest a hierarchical scaling ξ3 ≃ ξ 2<br />
2 , with a value <strong>of</strong> S3 consistent with gravity<br />
from Gaussian initial conditions, as argued in [137].<br />
Figure 59 displays <strong>the</strong> 1.2 Jy IRAS results ([88], [92], left panel) <strong>and</strong> CfA-SSRS<br />
results ([246], right panel). There is a convincing evidence for <strong>the</strong> hierarchical<br />
scaling in ξ3 <strong>and</strong> ξ4 (denoted by straight lines) but <strong>the</strong> resulting S3 <strong>and</strong> S4<br />
amplitudes are probably affected by sampling biases (see discussion below).<br />
Note that <strong>the</strong> scaling is preserved well into <strong>the</strong> non-linear regime, this is in<br />
agreement with expectations from N-body simulations which show that in<br />
redshift space <strong>the</strong> growth <strong>of</strong> Sp parameters towards <strong>the</strong> non-linear regime is<br />
suppressed by velocity dispersion from virialized regions ([391,437], see e.g.<br />
Fig. 49).<br />
In <strong>the</strong>ir analysis <strong>of</strong> higher-order moments in <strong>the</strong> CfA, SSRS, <strong>and</strong> IRAS 1.9<br />
Jy catalogs, [224] studied <strong>the</strong> sensitivity <strong>of</strong> Sp to redshift distortions, by calculating<br />
moments in spherical cells <strong>and</strong> conical cells. The latter were argued<br />
to be less sensitive to <strong>the</strong> redshift space mapping that acts along <strong>the</strong> line <strong>of</strong><br />
253