Developing Brand Personality Through Colour Construct – A ...
Developing Brand Personality Through Colour Construct – A ...
Developing Brand Personality Through Colour Construct – A ...

Create successful ePaper yourself
Turn your PDF publications into a flip-book with our unique Google optimized e-Paper software.
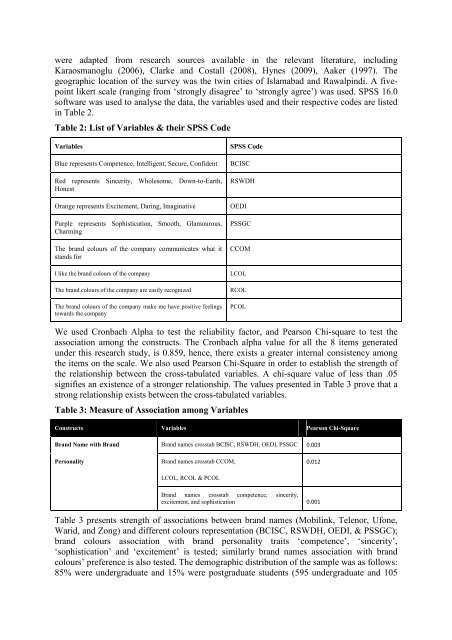
were adapted from research sources available in the relevant literature, including<br />
Karaosmanoglu (2006), Clarke and Costall (2008), Hynes (2009), Aaker (1997). The<br />
geographic location of the survey was the twin cities of Islamabad and Rawalpindi. A fivepoint<br />
likert scale (ranging from ‘strongly disagree’ to ‘strongly agree’) was used. SPSS 16.0<br />
software was used to analyse the data, the variables used and their respective codes are listed<br />
in Table 2.<br />
Table 2: List of Variables & their SPSS Code<br />
Variables SPSS Code<br />
Blue represents Competence, Intelligent, Secure, Confident BCISC<br />
Red represents Sincerity, Wholesome, Down-to-Earth,<br />
Honest<br />
RSWDH<br />
Orange represents Excitement, Daring, Imaginative OEDI<br />
Purple represents Sophistication, Smooth, Glamourous,<br />
Charming<br />
The brand colours of the company communicates what it<br />
stands for<br />
PSSGC<br />
CCOM<br />
I like the brand colours of the company LCOL<br />
The brand colours of the company are easily recognized RCOL<br />
The brand colours of the company make me have positive feelings<br />
towards the company<br />
We used Cronbach Alpha to test the reliability factor, and Pearson Chi-square to test the<br />
association among the constructs. The Cronbach alpha value for all the 8 items generated<br />
under this research study, is 0.859, hence, there exists a greater internal consistency among<br />
the items on the scale. We also used Pearson Chi-Square in order to establish the strength of<br />
the relationship between the cross-tabulated variables. A chi-square value of less than .05<br />
signifies an existence of a stronger relationship. The values presented in Table 3 prove that a<br />
strong relationship exists between the cross-tabulated variables.<br />
PCOL<br />
Table 3: Measure of Association among Variables<br />
<strong>Construct</strong>s Variables Pearson Chi-Square<br />
<strong>Brand</strong> Name with <strong>Brand</strong> <strong>Brand</strong> names crosstab BCISC, RSWDH, OEDI, PSSGC 0.003<br />
<strong>Personality</strong> <strong>Brand</strong> names crosstab CCOM, 0.012<br />
LCOL, RCOL & PCOL<br />
<strong>Brand</strong> names crosstab competence, sincerity,<br />
excitement, and sophistication 0.001<br />
Table 3 presents strength of associations between brand names (Mobilink, Telenor, Ufone,<br />
Warid, and Zong) and different colours representation (BCISC, RSWDH, OEDI, & PSSGC);<br />
brand colours association with brand personality traits ‘competence’, ‘sincerity’,<br />
‘sophistication’ and ‘excitement’ is tested; similarly brand names association with brand<br />
colours’ preference is also tested. The demographic distribution of the sample was as follows:<br />
85% were undergraduate and 15% were postgraduate students (595 undergraduate and 105