Download Sample pages 1 (pdf, 5.5 MB) - Springer
Download Sample pages 1 (pdf, 5.5 MB) - Springer
Download Sample pages 1 (pdf, 5.5 MB) - Springer

You also want an ePaper? Increase the reach of your titles
YUMPU automatically turns print PDFs into web optimized ePapers that Google loves.
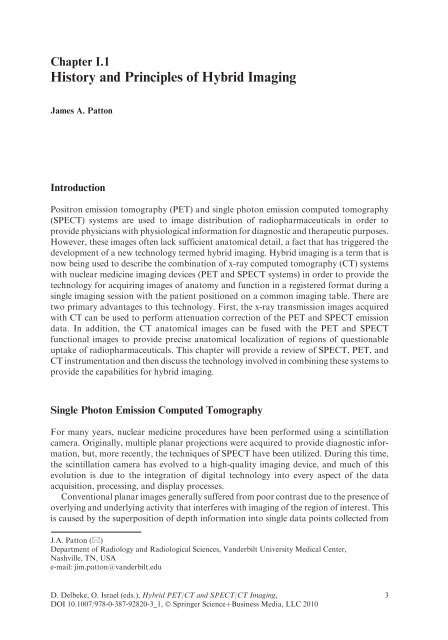
Chapter I.1<br />
History and Principles of Hybrid Imaging<br />
James A. Patton<br />
Introduction<br />
Positron emission tomography (PET) and single photon emission computed tomography<br />
(SPECT) systems are used to image distribution of radiopharmaceuticals in order to<br />
provide physicians with physiological information for diagnostic and therapeutic purposes.<br />
However, these images often lack sufficient anatomical detail, a fact that has triggered the<br />
development of a new technology termed hybrid imaging. Hybrid imaging is a term that is<br />
now being used to describe the combination of x-ray computed tomography (CT) systems<br />
with nuclear medicine imaging devices (PET and SPECT systems) in order to provide the<br />
technology for acquiring images of anatomy and function in a registered format during a<br />
single imaging session with the patient positioned on a common imaging table. There are<br />
two primary advantages to this technology. First, the x-ray transmission images acquired<br />
with CT can be used to perform attenuation correction of the PET and SPECT emission<br />
data. In addition, the CT anatomical images can be fused with the PET and SPECT<br />
functional images to provide precise anatomical localization of regions of questionable<br />
uptake of radiopharmaceuticals. This chapter will provide a review of SPECT, PET, and<br />
CT instrumentation and then discuss the technology involved in combining these systems to<br />
provide the capabilities for hybrid imaging.<br />
Single Photon Emission Computed Tomography<br />
For many years, nuclear medicine procedures have been performed using a scintillation<br />
camera. Originally, multiple planar projections were acquired to provide diagnostic information,<br />
but, more recently, the techniques of SPECT have been utilized. During this time,<br />
the scintillation camera has evolved to a high-quality imaging device, and much of this<br />
evolution is due to the integration of digital technology into every aspect of the data<br />
acquisition, processing, and display processes.<br />
Conventional planar images generally suffered from poor contrast due to the presence of<br />
overlying and underlying activity that interferes with imaging of the region of interest. This<br />
is caused by the superposition of depth information into single data points collected from<br />
J.A. Patton (*)<br />
Department of Radiology and Radiological Sciences, Vanderbilt University Medical Center,<br />
Nashville, TN, USA<br />
e-mail: jim.patton@vanderbilt.edu<br />
D. Delbeke, O. Israel (eds.), Hybrid PET/CT and SPECT/CT Imaging,<br />
DOI 10.1007/978-0-387-92820-3_1, Ó <strong>Springer</strong> ScienceþBusiness Media, LLC 2010<br />
3
4 J.A. Patton<br />
perpendicular or angled lines of travel of photons from the distribution being studied into<br />
the holes of the parallel hole collimator fitted to the scintillation camera. The resulting<br />
planar image is low in contrast due to the effect of the superposition of depth information.<br />
This effect can be reduced by collecting images from multiple positions around the<br />
distribution and producing an image of a transverse slice through the distribution.<br />
The resulting tomographic image is of higher contrast than the planar image due to<br />
the elimination of contributions of activity above and below the region of interest. This is<br />
the goal of SPECT, i.e., to provide images of slices of radionuclide distributions with image<br />
contrast that is higher than that provided by conventional techniques.<br />
Data Acquisition<br />
Instrumentation<br />
The introduction of the scintillation camera by Anger and Rosenthal in 1959 1 and its<br />
ultimate evolution into the imaging system of choice for routine nuclear medicine imaging<br />
applications resulted in a great deal of effort being expended toward the extension of the<br />
scintillation camera as a tomographic imaging device. In the early 1960s, Kuhl<br />
and Edwards established the fundamentals for SPECT using multi-detector scanning<br />
systems to acquire cross-sectional images of radionuclide distributions. 2–4 In the 1970s,<br />
Muehllehner, 5 Keyes and colleagues 6 and Jaszczak and colleagues 7 adapted this technology<br />
to a rotating scintillation camera. The result of these efforts along with the integration of<br />
computer systems was the development of the modern day SPECT system as a scintillation<br />
camera/computer system with one, two, or three heads and tomographic imaging capability.<br />
The scintillation camera collects tomographic data by rotating around the region of<br />
interest and acquiring multiple planar projection images during its rotation. It is imperative<br />
that the region of interest is included in every projection image. If this is not the case, the<br />
resulting truncation of the images will produce artifacts in the final reconstructed images.<br />
The camera may move in a continuous motion during acquisition but typically remains<br />
stationary during the acquisition of each projection image before advancing to the next<br />
position in a ‘‘step and shoot’’ mode of operation. A complete 3608 rotation of a scintillation<br />
camera with a rectangular field of view will completely sample a cylindrical region of<br />
interest. Originally, camera systems were only capable of circular orbits; however, modern<br />
day systems have elliptical orbit capability. This is accomplished by equipping the collimators<br />
with sensors that detect the presence of the patient and maintain the camera head(s) in<br />
close proximity to the patient as the orbit is completed. Since the spatial resolution of<br />
collimators used with the scintillation camera degrades with distance from the collimator<br />
face, the optimum resolution is obtained in each projection image when the camera is as<br />
close to the patient as possible.<br />
Initial SPECT applications were performed with a single-head scintillation camera acquiring<br />
data from a 3608 orbit as shown in Fig. I.1.1A. When interest in imaging the myocardium<br />
became prominent, experimental work demonstrated that acceptable images could be<br />
obtained using a 1808 orbit (right anterior oblique to left posterior oblique). 8,9 Although<br />
this results in an incomplete sampling of the region of interest, this lies in the near field of view<br />
of the camera throughout the partial orbit where the spatial resolution is optimum, and<br />
images of acceptable quality are obtained. Early in the evolution of SPECT imaging, it<br />
became evident that optimum counting statistics for many applications could not be obtained
I.1 History and Principles of Hybrid Imaging 5<br />
Fig. I.1.1 Scintillation cameras for nuclear medicine applications have evolved from single-head (A) to<br />
dual-head, fixed 908 geometry (B), and finally to dual-head, variable-angle multipurpose cameras<br />
(C) (Reprinted with permission of <strong>Springer</strong> Science+Business Media from Vitola J, Delbeke D, eds.<br />
Nuclear Cardiology and Correlative Imaging: A Teaching File. New York: <strong>Springer</strong>-Verlag, 2004.)<br />
in a reasonable time frame that could be tolerated by patients. This situation was remedied by<br />
the development of multi-head scintillation cameras. The first system to evolve was a dualhead<br />
camera in a fixed 1808 geometry permitting a 3608 acquisition with only a 1808 rotation<br />
of the gantry. This development provided a twofold increase in sensitivity for SPECT<br />
applications. However, this increase in sensitivity was not available for cardiac applications<br />
using 1808 acquisitions. To address this problem, special purpose, dual-head cameras were<br />
developed with the camera heads fixed in a 908 geometry as shown in Fig. I.1.1B. This made<br />
the twofold increase in sensitivity also available for cardiac imaging, and the acquisition of<br />
projections through 1808 could be acquired with a 908 rotation of the dual-head gantry. Since<br />
many scintillation cameras must serve multiple purposes in nuclear medicine departments,<br />
the next step was the development of dual-head, variable-angle scintillation cameras as<br />
shown in Fig. I.1.1C. These cameras can acquire images with the heads in a 1808 geometry<br />
for routine 3608 applications, and one head can be moved into a 908 geometry with the other<br />
head for 1808 cardiac applications. The two latter configurations are presently considered the<br />
cameras of choice for cardiac imaging.<br />
Acquisition Parameters<br />
Collimation<br />
SPECT applications typically make use of parallel hole collimators in order to establish an<br />
orthogonal detection geometry with the crystal detectors. Imaging of low-energy radionuclides<br />
is generally limited to the use of general purpose, parallel hole collimators.<br />
The resulting images typically exhibited poor spatial resolution. The emergence of multihead<br />
cameras and the resulting increase in sensitivity have made it possible to improve<br />
spatial resolution by the use of high-resolution collimators, and these collimators are now<br />
the choice for most imaging applications.<br />
Matrix Size<br />
For most SPECT applications, the acquisition matrix size for acquiring planar projection<br />
images is typically a 64 64 data point array. The decision is based on the size of the
6 J.A. Patton<br />
smallest object to be imaged in the distribution being studied. Sampling theory states that in<br />
order to resolve frequencies (objects) up to a maximum frequency (smallest object) at least<br />
two measurements must be made across one cycle (the object). This maximum frequency is<br />
referred to as the Nyquist frequency. For example, using a camera with a 540-mm field of<br />
view, a zoom factor of 1.4 and a 64 64 acquisition matrix size would result in a pixel size of<br />
6 mm, making it possible to image structures of 1.2 cm or larger. This is generally<br />
considered sufficient for most SPECT applications. The one exception is bone SPECT<br />
where a 128 128 matrix may be used to take advantage of the higher counting statistics to<br />
improve spatial resolution.<br />
Arc of Rotation<br />
As previously stated, a 1808 acquisition is acceptable (right anterior oblique position to left<br />
posterior oblique position) for cardiac imaging since the myocardium is always in the near<br />
field of the detector(s). Photons traveling in a posterior direction from the myocardium<br />
must travel significant distances through tissue and, therefore, spatial resolution and<br />
sensitivity (due to attenuation) are degraded in posterior and right posterior oblique<br />
views. Thus, the data from the omitted projections are considered to be of poor quality<br />
and generally not acquired. For most applications, however, a 3608 acquisition is required<br />
in order to obtain a complete set of projections for acceptable image reconstructions.<br />
Projections per Arc of Rotation<br />
The same sampling theory previously described also applies to the determination of the<br />
number of projection views that should be acquired throughout an arc of rotation. With<br />
current instrumentation, 120 views are typically obtained with a 3608 acquisition, and,<br />
therefore, 60 views are generally acquired with a 1808 acquisition.<br />
Time per Projection<br />
In general, SPECT techniques require the acquisition of as many photon events as possible<br />
in order to produce high-quality images. However, the limiting factor is typically the time<br />
that a patient can remain motionless during the acquisition. This is typically a period of<br />
15–30 min and results in imaging times of 15–30 s for each projection when 120 projections<br />
are acquired in a 3608 rotation. For cardiac applications, the imaging time is typically<br />
reduced to 10–15 min.<br />
SPECT Image Formation<br />
SPECT data are acquired in the form of multiple projection images as the scintillation<br />
camera heads rotate about the region of interest. Each acquired image is actually a set of<br />
count profiles measured from different views with the number of count profiles determined<br />
by the number of rows of pixels in the acquisition matrix (e.g., 64 for a 64 64<br />
matrix size). Using parallel hole collimators, each pixel is the sum of measured photon<br />
events traveling along a perpendicular ray and interacting at a point in the detector<br />
crystal represented by the pixel location. For a 3608 acquisition with 120 acquired
I.1 History and Principles of Hybrid Imaging 7<br />
projection arrays, 120 count profiles are acquired at 38 increments around the region of<br />
interest for each transaxial slice through the radionuclide distribution.<br />
Image Reconstruction<br />
An image of a transaxial slice through the distribution can be generated by sequentially<br />
projecting the data in each count profile collected from the selected slice back along the rays<br />
from which the data were collected and adding the data to previously backprojected rays.<br />
The mathematical term for this process is the linear superposition of backprojections. Since<br />
there is no a priori knowledge of the origin of photons along each ray, the value of each<br />
pixel in the count profile is placed in each data cell of the reconstructed image along the ray.<br />
Representations of the images resulting from this process are shown in Fig. I.1.2. It should<br />
be noted that uniform projections are used in Fig. I.1.2 to illustrate the backprojection<br />
principle. In fact, the rays at the periphery of the sphere are of less intensity than at the<br />
middle. The classic ‘‘star effect’’ blur pattern inherent in backprojection images is also<br />
evident in these images with each ray of the star corresponding to one projection view. The<br />
importance of collecting the appropriate number of projections is evident from this diagram.<br />
Increasing the number of projections enhances the image contrast and reduces the<br />
potential for artifacts from the ‘‘star effect.’’ This can be seen in Fig. I.1.2D, where two<br />
additional sets of data at 458 and 1358 are projected back into the image.<br />
Fig. I.1.2 A–D Examples of<br />
two filtered count profiles of<br />
data acquired at 908 from a<br />
spherical source and the<br />
resulting image distribution<br />
after backprojection of the<br />
filtered profiles (Reprinted<br />
with permission of <strong>Springer</strong><br />
Science+Business Media<br />
from Vitola J, Delbeke D,<br />
eds. Nuclear Cardiology and<br />
Correlative Imaging:<br />
A Teaching File. New York:<br />
<strong>Springer</strong>-Verlag, 2004.)
8 J.A. Patton<br />
It is apparent from the data in Fig. I.1.2 that the blur pattern inherent in backprojection<br />
results in a significant background that reduces image contrast. To reduce these effects and also<br />
to reduce the statistical effects of noise in the images, the mathematical technique of filtering is<br />
applied to the count profiles in the projection data before backprojection is performed. A filter is<br />
a mathematical function that is defined to perform specific enhancements to the profile data. In<br />
general, filters enhance edges (sharpen images) and reduce background. The effects of a simple<br />
edge enhancement filter are shown in Fig. I.1.3. In the application of this filter, each data point in<br />
the profile is replaced by a mathematical relationship between its value and those of adjacent<br />
data points. This relationship is designed such that negative values are added to the count<br />
profiles. Figure I.1.3 shows the backprojection of the filtered count profile at 08 added to the<br />
filtered backprojected count profile at 908. It can be observed that the negative data at the edges<br />
of one profile cancel unwanted data from other profiles. This effect is shown diagrammatically<br />
in Fig. I.1.3B, C. As the number of projections is increased, this effect becomes more pronounced<br />
as shown in Fig. I.1.3D, where the filtered backprojections at 458 and 1358 are added to<br />
the image. The final step is to set to zero each pixel in the reconstructed image that has a negative<br />
value as shown in Fig. I.1.3E. The figure shows that the scanned object is now visible in<br />
the image but many non-zero pixels remain. The addition of multiple projections will remove<br />
Fig. I.1.3 Demonstration of the blur pattern from a spherical source (A) resulting from filtered backprojection<br />
of a single view (B), two views at 0 and 908 (C), and 0, 45, 90, and 1358 (D). In the final image<br />
(E) the negative values have been set to zero (Reprinted with permission of <strong>Springer</strong> Science+Business<br />
Media from Vitola J, Delbeke D, eds. Nuclear Cardiology and Correlative Imaging: A Teaching File.<br />
New York: <strong>Springer</strong>-Verlag, 2004.)
I.1 History and Principles of Hybrid Imaging 9<br />
these artifacts and further enhance the image of the actual measured distribution. This technique<br />
of linear superposition of filtered backprojections has been the image reconstruction algorithm<br />
of choice throughout most of the history of SPECT. Figure I.1.3 also demonstrates the need to<br />
select an appropriate filter for each imaging application. If too many negative numbers are<br />
added to the image (over-filtering), valuable image data will be removed. If not enough negative<br />
numbers are added to the image (under-filtering), unwanted data will remain in the image<br />
resulting in artifacts. The selection of the appropriate filter is probably the most significant<br />
factor in producing a high-quality image reconstruction. The effect of over-filtering and underfiltering<br />
is shown in the single reconstructed slice of the myocardium of a patient in Fig. I.1.4.<br />
Fig. I.1.4 Single short axis view of the myocardium with 99m Tc Sestamibi demonstrating over-filtering<br />
(A), under-filtering (C), and optimal filtering (B) (Reprinted with permission of <strong>Springer</strong><br />
Science+Business Media from Vitola J, Delbeke D, eds. Nuclear Cardiology and Correlative Imaging: A<br />
Teaching File. New York: <strong>Springer</strong>-Verlag, 2004.)<br />
The techniques previously discussed were illustrated using data for a single transverse slice.<br />
In practice, it is possible to reconstruct as many transverse slices as there are rows in the<br />
acquisition matrix. For example, a 64 64 matrix provides 64 rows of data that can be used<br />
to reconstruct 64 slices. However, because the slice thickness of a single slice often exceeds the<br />
spatial resolution of the camera and the data in a single slice are often statistically limited, it is<br />
common practice to add two or more adjacent slices in order to reconstruct thicker slices with<br />
improved statistics. The final result of the reconstruction process is a set of transverse slices.<br />
Images of sagittal and coronal slices can easily be generated from this data set by simply<br />
reformatting the data. For the special case of the heart where its orientation is not in the<br />
traditional x, y, z orientation of the human body, it is necessary to re-orient the axes to<br />
correspond to the long and short axes of the left ventricle. This is a straightforward procedure<br />
that can be accomplished automatically or manually under software control.<br />
Filters<br />
Routine methods for characterizing nuclear medicine images and data sets relate to the number<br />
of counts in a pixel. When data are referred to using this terminology, the data are defined as<br />
being in the spatial domain and the simple filter previously used to illustrate the effects of<br />
filtering on image reconstruction was a spatial filter. In practice, filtering of projection data in<br />
the spatial domain is often cumbersome and time consuming. This problem can be overcome<br />
by working in the frequency domain. Here, the projection data may be expressed as a series of<br />
sine waves, and a frequency filter may be used to modify the data. The conversion of the
10 J.A. Patton<br />
projection data into the frequency domain is accomplished by the application of a mathematical<br />
function, the Fourier transform, and the result is that the projection data are represented as<br />
a frequency spectrum plotting the amplitude of each frequency in the data as shown in<br />
Fig. I.1.5A. In SPECT, this frequency spectrum has three distinct components. Background<br />
data (including the data from the star effect previously described) typically have very low<br />
frequencies and therefore are the main components of the low-frequency portion of the<br />
spectrum. Statistical fluctuations in the data (noise) generally have high frequencies and therefore<br />
dominate the high frequencies of the spectrum. True source data lie somewhere in the<br />
Fig. I.1.5 In the frequency domain, image data can be represented as a series of sine waves, and the data can<br />
be plotted as a frequency spectrum showing the amplitude of each frequency. Image data have three major<br />
components: background, source information, and noise. A ramp filter is used to eliminate or reduce the<br />
contribution of background to the reconstructed image (A). A low-pass filter reduces the contribution of<br />
noise to the image (B). Combining the two filters (C) creates a window or band-pass filter that accepts<br />
frequencies primarily from the source distribution (Reprinted with permission of <strong>Springer</strong><br />
Science+Business Media from Vitola J, Delbeke D, eds. Nuclear Cardiology and Correlative Imaging: A<br />
Teaching File. New York: <strong>Springer</strong>-Verlag, 2004.)<br />
middle while overlapping the background and noise components of the spectrum. Thus, the<br />
challenge in filtering SPECT data is clearly demonstrated in Fig. I.1.5A. The goal is to eliminate<br />
background and noise from the data while preserving as much of the source data as possible. It<br />
should also be noted that the frequency data in the figure are plotted as a function of cycles/<br />
pixel. In the discussion of matrix size previously presented, the concept of the Nyquist<br />
frequency was introduced. In the frequency domain, the highest frequency in a data set occurs<br />
when one complete cycle covers two pixels. Frequencies higher than this value cannot be<br />
imaged.Thisfacttranslatesinto a frequency of 0.5 cycles/pixel as the frequency limit and is<br />
defined as the Nyquist frequency. This is why the plot in Fig. I.1.5A terminates at 0.5 cycles/<br />
pixel. The pixel size used in a particular application can be introduced into this definition so that<br />
the Nyquist frequency for the application can be determined. For example, a pixel size of 0.5 cm<br />
would define a Nyquist frequency of 1.0 cycles/cm. And the smallest object size that could<br />
possibly be resolved in an image would be 1 cm.<br />
The first step in filtering is to design a filter to remove or reduce the background. This<br />
typically is a ramp filter as shown in Fig. I.1.5A, a high-pass filter that reduces only the<br />
amplitudes of low-frequency data while having no effect on the mid-range and<br />
high-frequency data which contain the detail in the source (and also the noise). The second<br />
step is to define a filter to remove or reduce the noise while preserving the detail in the source
I.1 History and Principles of Hybrid Imaging 11<br />
data. This is accomplished using a low-pass filter as shown in Fig. I.1.5B, which accepts selected<br />
frequencies up to a certain value. There are a number of low-pass filters that are available for<br />
processing SPECT data. Some have fixed characteristics, and others have flexibility in choosing<br />
the cutoff frequency and/or the slope of the filter. Some filters are optimized for image data with<br />
excellent counting statistics, and others provide the capability for filtering data with poor<br />
statistics. Also, the amount of detail in an image and the object sizes to be resolved (spatial<br />
resolution) are important factors to be considered in the selection of a filter. In practice, the lowpass<br />
filter may be applied first to reduce the effects of noise, and then the ramp filter is applied to<br />
reduce background. The two filters may be combined as shown in Fig. I.1.5C to function as a<br />
band-pass filter. It can be seen in the latter figure that appropriate selection of the cutoff<br />
frequency will eliminate much of the noise, and selecting an appropriate filter shape will<br />
preserve most of the source data. The terms under-filtering and over-filtering were previously<br />
referenced, and examples were shown in Fig. I.1.4. From Fig. I.1.5C, it can be observed that,<br />
when a cutoff frequency is chosen that is too low, someofthesourcedatawillbeexcludedfrom<br />
the final image, and this situation is referred to as over-filtering. Similarly, when too high a<br />
cutoff frequency is chosen, excessive noise will be included in the final image, and this is referred<br />
to as under-filtering. In clinical applications, most imaging systems provide the capability for<br />
trying different filters and filter parameters on a single slice of image data in order to select the<br />
appropriate processing algorithm for a specific patient study. Technologists and physicians in<br />
the clinical setting often prefer this method of trial and error.<br />
Iterative Reconstruction<br />
Filtered backprojection amplifies statistical noise, which adversely affects image quality. To<br />
address this problem, Shepp and Vardi introduced an iterative reconstruction technique in<br />
1982 10 based on the theory of expectation maximization (EM), which has a proven theoretical<br />
convergence to an estimate of the actual image distribution that has a maximum likelihood of<br />
having projections most similar to the acquired projections. The initial implementation of these<br />
algorithms was very time consuming, with several iterations being required to reach a solution,<br />
and extensive computer power was required. Since that time, much effort has been expended in<br />
improving and testing algorithms based on this concept. Significant improvements in speed<br />
and signal-to-noise and reconstruction accuracy have resulted from these efforts. In 1994,<br />
Hudson and Larkin 11 developed the technique of ordered sets EM (OS-EM) for image<br />
reconstruction from 2D projection data. This algorithm was based on the concept of dividing<br />
the projection data into small subsets (e.g., paired opposite projections in SPECT data) and<br />
performing the EM algorithm on each subset. The solution of each subset was used as the<br />
starting point for the next subset, with subsequent subsets being selected to provide the<br />
maximum information (e.g., chose the second subset of data to be orthogonal to the first<br />
subset). The advantage of this technique is that, at the end of the first pass, the entire data set<br />
has been processed one time, but n successive approximations to the final solution have<br />
been made where n is the number of subsets. Thus, OS-EM is n times faster than the original<br />
EM algorithm. Typically, only two to three passes through the data set (iterations) are required<br />
for the reconstructed image to converge to a final value that is essentially unchanged by<br />
further iterations. Correction for scatter and attenuation effects (topics that will be discussed<br />
later) can be performed on the acquired projection data during the reconstruction process. The<br />
advantage of this technique is that the star effect inherent in filtered backprojection is virtually<br />
eliminated since the acquired data are distributed within the body contour. Because of this
12 J.A. Patton<br />
result, signal-to-noise is generally improved. Filtering of the data can also be performed to<br />
further enhance the reconstructed images.<br />
Attenuation Correction<br />
One of the primary factors affecting image quality in SPECT is photon attenuation. Photons<br />
are attenuated in the body due to photoelectric absorption and Compton scatter, with Compton<br />
scattering being the most predominant interaction in the diagnostic energy range. The<br />
probability of Compton scattering decreases with increasing energy. The effects of attenuation<br />
are significant, with approximately 62% of 70 keV photons and 54% of 140 keV photons being<br />
attenuated in 5 cm of tissue. Photoelectric absorption results in a complete removal of the<br />
photon from the radiation field, while Compton scattering results in a change in direction with<br />
loss of photon energy, the magnitude of the loss being determined by the angle of scatter. Thus,<br />
Compton scattered photons enter the camera crystal with minimal or no information on their<br />
origins due to their change in direction within the patient. Pulse height analysis is used to<br />
prevent the counting of photons that have scattered through large angles (greater loss of<br />
energy), but small angle scattered photons are counted. The use of a 20% window at 70 keV<br />
permits the acceptance of photons that have scattered through 0–798. At140keV,a20%<br />
window permits the acceptance of photons that have scattered through 0–538 and a 15%<br />
window accepts photons scattered through 0–458.<br />
Correction of images for attenuation effects are complicated bythebroadrangeoftissue<br />
types (lung, soft tissue, muscle, and bone) that may reside in the region of interest resulting in a<br />
non-uniform attenuation medium. A commercial approach to attenuation correction that has<br />
been used in the past used line sources of 153 Gd as shown in Fig. I.1.6. These sources provide<br />
beams of 100 keV photons and are scanned in the longitudinal direction at each step of the<br />
SPECT acquisition to provide transmission maps of the region under study. Emission and<br />
transmission scans at each step can be acquired sequentially or simultaneously using<br />
Fig. I.1.6 Scanning line<br />
sources mounted on a<br />
dual-head, 908 geometry<br />
scintillation camera for<br />
attenuation correction<br />
measurements (Reprinted<br />
with permission of <strong>Springer</strong><br />
Science+Business Media<br />
from Vitola J, Delbeke D,<br />
eds. Nuclear Cardiology and<br />
Correlative Imaging: A<br />
Teaching File. New York:<br />
<strong>Springer</strong>-Verlag, 2004.)
I.1 History and Principles of Hybrid Imaging 13<br />
synchronized energy windows that move with the sources to acquire the transmission data.<br />
These are then used to correct the projection data prior to SPECT image reconstruction.<br />
Correction methods tend to overcorrect for attenuation, and it is generally accepted that<br />
a scatter correction must also be performed. One solution to this problem is the simultaneous<br />
acquisition of a second set of planar projections using a scatter window positioned<br />
just below the photopeak energy being measured. This window is used to determine<br />
correction factors for the acquired planar projections prior to image reconstruction.<br />
Positron Emission Tomography<br />
Previous discussions have been related to the imaging of single photon emitting radionuclides<br />
using conventional scintillation camera systems. Another classification of radionuclides that<br />
have applications in nuclear medicine is positron emitters that can be imaged using specially<br />
designed PET systems optimized for the unique decay properties of these radionuclides. Anger<br />
and Rosenthal 1 originally proposed the use of the scintillation camera for this application, and<br />
throughout the years numerous attempts have been made to use this instrument for this<br />
application. 12,13 However, these approaches suffered from deficiencies in the efficiency of<br />
NaI(Tl). Robertson and coworkers 14 and Brownell and Burnham 15,16 developed special purpose<br />
positron imaging systems in the early 1970s, but the modern day PET scanner began to<br />
evolve in 1975 17 with the work of Phelps and his associates producing a system of detectors<br />
operating in coincidence mode and surrounding the patient to provide transverse section<br />
imaging capabilities. 18–22 Positron emitting radionuclides are distinguished by the unique<br />
method by which they are detected. The positron is a positively charged electron. When emitted<br />
from a radioactive nucleus, it travels only a very short distance before losing all of its energy and<br />
coming to rest. At that instant, it combines with a negatively charged electron, and the masses of<br />
the two particles are completely converted into energy in the form of two 511 keV photons. This<br />
process is termed annihilation. The two annihilation photons leave the site of their production at<br />
1808 from each other. This process can be detected as shown in Fig. I.1.7 by using small, dualopposed<br />
detectors connected by a timing circuit, termed a coincidence circuit, to simultaneously<br />
detect the presence of the two annihilation photons, a signature of the positron decay process.<br />
Fig. I.1.7 Block diagram of a two-detector grouping with a coincidence timing window used to simultaneously<br />
detect the two photons resulting from the annihilation of a positron–electron pair using the technique of<br />
coincidence counting (Reprinted with permission of <strong>Springer</strong> Science+Business Media from Vitola J, Delbeke<br />
D, eds. Nuclear Cardiology and Correlative Imaging: A Teaching File. New York: <strong>Springer</strong>-Verlag, 2004.)
14 J.A. Patton<br />
The timing window must be small, 7–15 ns, in order to reduce the possibility of detecting<br />
photons from two separate decay processes, i.e., random events. The spatial resolution of the<br />
imaging system is primarily determined by the size of the detectors, combined with the<br />
uncertainty due to the travel of the positron before annihilation which is typically less than<br />
0.5 mm in tissue. In clinical imaging systems, many small detectors are used in multiple rings to<br />
provide high sensitivity for detection in the region being examined as shown in Fig. I.1.8.<br />
Fig. I.1.8 One ring of detectors from a multi-ring PET system. Many potential lines of coincidence are<br />
possible for each detector in the ring (A). Multiple rings of detectors are used to extend the axial field of view<br />
(B) (Reprinted with permission of <strong>Springer</strong> Science+Business Media from Vitola J, Delbeke D, eds.<br />
Nuclear Cardiology and Correlative Imaging: A Teaching File. New York: <strong>Springer</strong>-Verlag, 2004.)<br />
PET Detectors<br />
For many years, the scintillation detector of choice for PET imaging has been bismuth<br />
germanate (BGO) instead of NaI(Tl), which is used in other nuclear medicine imaging<br />
devices. BGO is used because of its high-density and high effective atomic number, which<br />
results in a high intrinsic detection efficiency for 511 keV photons. A 30-mm thick crystal of<br />
BGO has an intrinsic detection efficiency of approximately 90% at 511 keV. When two<br />
detectors are used in coincidence to simultaneously detect two 511 keV photons, the<br />
coincidence detection efficiency is the product of the efficiencies of the two detectors or<br />
approximately 81%. Recently, a new scintillation material, lutetium oxyorthosilicate<br />
(LSO), has been introduced as a possible replacement for BGO. Although currently more<br />
expensive than BGO, LSO has the advantage of greater light output (factor of 6) and faster<br />
decay time (factor of 7.5), and these improvements can be used to advantage in increasing<br />
the count rate capabilities of modern day systems. PET systems using LSO are now<br />
available from one manufacturer (Siemens-CTI). More recently, another new scintillation<br />
detector material, gadolinium oxyorthosilicate (GSO) has been introduced with similar<br />
characteristics to those of LSO, but with improved energy resolution. PET systems using<br />
GSO detectors are now available from another manufacturer (Philips Medical Systems).<br />
The high spatial resolution of these systems is accomplished by using a unique combination<br />
of small crystals and photomultiplier tubes. An example of this technology is shown in Fig. I.1.9.<br />
A rectangular solid crystal of detector material is modified by the addition of vertical and
I.1 History and Principles of Hybrid Imaging 15<br />
Fig. I.1.9 For high-resolution imaging, a block of crystal (BGO in this example) is segmented into many<br />
small discrete detectors (32 in this example). Two position-sensitive photomultiplier tubes positioned at the<br />
back of the crystal block determine the detector in which an interaction occurs (Reprinted with permission<br />
of <strong>Springer</strong> Science+Business Media from Vitola J, Delbeke D, eds. Nuclear Cardiology and Correlative<br />
Imaging: A Teaching File. New York: <strong>Springer</strong>-Verlag, 2004.)<br />
horizontal grooves partially through the volume to effectively create a block of many small<br />
discrete detectors (36 in the figure). Some manufactures actually separate the discrete crystals<br />
entirely, creating pixilated detectors as in the figure. A photon interaction in one of the<br />
discrete crystals will result in scintillations localized primarily in that crystal. The crystal in<br />
which the interaction occurred is then identified by photomultiplier tubes using conventional<br />
Anger logic and mounted on the base of the crystal block or by using position-sensitive<br />
photomultiplier tubes. In the detector block shown in Fig. I.1.10, the discrete crystals are<br />
Fig. I.1.10 The use of septa collimators permit 2D acquisition by limiting the detection of coincidence<br />
events to detectors within a single ring (direct planes) and detectors in adjacent rings (cross planes) (A).<br />
When the septa are withdrawn, 3D acquisition is established by permitting the measurement of a coincidence<br />
event in two detectors in any two rings of the system (B) (Reprinted with permission of <strong>Springer</strong><br />
Science+Business Media from Vitola J, Delbeke D, eds. Nuclear Cardiology and Correlative Imaging:<br />
A Teaching File. New York: <strong>Springer</strong>-Verlag, 2004.)
16 J.A. Patton<br />
4mm 8mm 30 mm deep, resulting in a transaxial spatial resolution of 4.6 mm. Current<br />
systems have 18–32 rings of detectors providing axial fields of view of 15–18 cm (Fig. I.1.8).<br />
Thus, the imaging of sections of the body greater than 15 cm in the axial direction requires<br />
multiple acquisitions obtained by indexing the patient through the system using a movable<br />
imaging table under precise computer control.<br />
2D Versus 3D Imaging<br />
It is possible to reduce the effects of scatter and the possibility of random events by adding<br />
thin 1D collimators, termed septa, between adjacent rings of detectors to shield the detection<br />
of events in the axial direction as shown in Fig. I.1.10A. These septa are typically<br />
constructed from tungsten with a thickness of 1 mm and spacing to match the axial width of<br />
each discrete crystal. They have the effect of creating 2D slices from which events can be<br />
accepted in any transaxial direction. Thus, for a system with 18 rings of detectors, 18 direct<br />
imaging planes are established. To increase sensitivity, coincidence circuitry can also be<br />
used to record interactions occurring in two detectors in adjacent rings, resulting in the<br />
addition of a new acquisition plane positioned midway between the adjacent detector rings.<br />
Thus, in an 18-ring system, 17 new cross imaging planes can be added for a total of 35<br />
imaging planes in this example. Additional sensitivity is obtainable by adding adjacent<br />
planes to this process. For example, three or five planes of detectors may be electronically<br />
grouped so that coincidence events may be measured in any two detectors within these<br />
groupings. The localization of the coincidence event in a transaxial imaging plane is<br />
typically determined by averaging the axial positions of the two detectors. The length of<br />
the septa limits the axial separation of any two rings that can actually be used in the<br />
measurement of the activity in a 2D plane.<br />
With the septa retracted or in systems using only 3D technology, detector rings are<br />
opened to photons traveling in all directions, and a 3D imaging geometry is established as<br />
shown in Fig. I.1.10B. This increases the system sensitivity by a factor of 3–5 over that of 2D<br />
imaging. However, the randoms rate and scatter fraction are increased with this geometry,<br />
which may reduce contrast. It is possible to limit the acceptance angle in the axial direction<br />
to reduce the effects of randoms and scatter, but this process results in a reduction in<br />
sensitivity.<br />
Data Acquisition and Image Reconstruction<br />
As previously described, a coincidence event is recorded when two photons are simultaneously<br />
measured in two separate detectors. Thus, the coordinates of the two detectors<br />
determine the line of response (LOR) defined by the coincidence detection of the two<br />
photons as shown in Fig. I.1.11A. These coordinates are captured by calculating the<br />
perpendicular distance from the center of the scan field to the LOR (r) and measuring the<br />
angle between this line and the vertical axis (f). These coordinates are then recorded as a<br />
data point in an (r,f) plot or sinogram as shown in Fig. I.1.11B. Each unit in the final<br />
sinogram will consist of the total number of coincidence events recorded by a twodetector<br />
pair. The sinogram method of storage is used because it is more efficient than<br />
the storing of list mode data that record individual coordinates of detector pairs. In 2D<br />
image acquisition, there will be (2n – 1) sinograms recorded, one for each direct plane
I.1 History and Principles of Hybrid Imaging 17<br />
Fig. I.1.11. The coordinates of the two detectors involved in a coincidence measurement are captured by<br />
calculating the perpendicular distance from the center of the scan field to a line connecting the two detectors<br />
(r) and measuring the angle between this line and the vertical axis (f) (A). These coordinates are then<br />
recorded as a data point in an (r,f) plot or sinogram (B). Each unit in the final sinogram will consist of the<br />
total number of coincidence events recorded by a two-detector pair (Reprinted with permission of <strong>Springer</strong><br />
Science+Business Media from Vitola J, Delbeke D, eds. Nuclear Cardiology and Correlative Imaging:<br />
A Teaching File. New York: <strong>Springer</strong>-Verlag, 2004.)<br />
and one for each cross plane, where n is the number of detector rings in the PET system.<br />
When the two detectors are in different detector rings, the event is recorded in<br />
the sinogram corresponding to the average axial position of the two rings as<br />
previously stated.<br />
Image reconstruction of the 2D data is accomplished by first converting each<br />
sinogram of data into a set of planar projections. This can be accomplished in a<br />
straightforward manner from the sinograms since each horizontal row of data in a<br />
sinogram represents events recorded at one angular position. It should also be noted<br />
that the events from each two-detector pair are uniformly spread across the sinogram.<br />
As described in the section on SPECT reconstruction, a filtering algorithm is applied<br />
to each projection, after which the data are projected back along the lines from which<br />
they were acquired to generate the final image (i.e., filtered backprojection). Each<br />
sinogram of data is used in this fashion to generate an image corresponding to the<br />
activity distribution represented by the sinogram. Iterative algorithms that make use<br />
of ordered sets (OS-EM) can also be used in the 2D reconstruction process to reduce<br />
noise and provide high-quality images. 4 The use of iterative algorithms also simplifies<br />
the process of adding corrections for effects such as attenuation and scatter.<br />
The acquisition and reconstruction of 3D data sets are more complicated than that for 2D<br />
applications. First, it is not possible to perform the axial averaging of events recorded from two<br />
detectors in different detector rings. The origins of these data must be preserved in the<br />
acquisition process, and this results in a significant increase in the size of the acquired data<br />
set since n 2 sinograms are now required to accurately acquire the data. In addition, the<br />
reconstruction process is complicated by the factthatitisnecessarytouseatrue3Dvolume
18 J.A. Patton<br />
algorithm to accurately locate detected events in axial as well as transverse directions. Iterative<br />
reconstruction algorithms, although very time consuming and labor intensive, are well designed<br />
for this application. Currently, available systems offer this technique as an option, and it has<br />
proven useful in brain imaging because the imaging volume is relatively small and count rates<br />
are relatively low. Because of the added sensitivity provided by 3D imaging, a great deal of<br />
effort has been applied to develop accurate and efficient 3D algorithms and techniques to<br />
correct for scatter in order to improve contrast. These improvements have resulted in the 3D<br />
technique becoming the most prevalent choice for clinical PET imaging.<br />
Time-of-Flight PET<br />
In conventional PET, the localization of a positron decay and the resultant production of<br />
annihilation radiation are represented by a LOR between the two detectors that detect the<br />
two annihilation photons. There is no way of identifying the precise position along the LOR<br />
where the decay process occurred. For many years, investigators have worked to solve this<br />
problem by using time-of-flight (TOF) techniques, but they have been limited by the response<br />
time of the detectors and the technology of timing measurements that have been available.<br />
The availability of fast LSO crystals and improvements in timing measurement capability<br />
now make the application a reality. Instead of using conventional timing circuitry to identify<br />
coincidence events within a timing window, TOF PET uses more sophisticated timing<br />
circuitry to measure the time difference between the detection of the two photons from an<br />
annihilation event. Since the photons travel at a known velocity, the speed of light (c), this<br />
time difference can be used to calculate the difference in distance of travel of the two photons<br />
between the two detectors involved in the measurement. Using this measurement and the<br />
known distance between the two detectors, the actual distance of travel of the two photons<br />
can be calculated (and therefore the location of the annihilation event). Current timing<br />
resolutions on the order of 0.6 ns yield an uncertainty on the order of 9 cm in the measurement<br />
of the location of the annihilation event. Thus, the conventional LOR between the two<br />
detectors is replaced with a LOR of approximately 9 cm whose center is the estimate of the<br />
location of the annihilation event.<br />
The use of TOF PET technology results in improved contrast and spatial resolution by<br />
significantly reducing the uncertainty in the actual location of the annihilation event.<br />
Although signal processing is more intensive with this technology, improvements in lesion<br />
detection and image quality have been demonstrated in a commercial system using TOF<br />
technology, especially in large patients where random and scatter events are more prevalent.<br />
Quantitative Techniques<br />
Because of the block detector technology used with PET systems, there is a dead time<br />
associated with measurements of activity distributions, and corrections for this effect<br />
must be implemented in order that the measurements are quantitatively accurate. When<br />
an interaction occurs in a crystal, a finite length of time is required to collect the light<br />
produced and process the resulting signal. If another event occurs in the same block<br />
while the first interaction is being processed, the light from the two events will be<br />
summed together by the photomultiplier tubes in that block, and the resulting signal<br />
will probably fall outside of the pulse height window. This effect will result in an
I.1 History and Principles of Hybrid Imaging 19<br />
erroneous measurement of count rate. Modern systems have dead time correction<br />
capability utilizing correction factors determined for the system as a function of<br />
count rate. These correction factors adjust for errors in count rate but cannot add<br />
the lost events back into the acquired image.<br />
A state-of-the-art PET scanner may have several thousand discrete crystals coupled<br />
to hundreds of photomultiplier tubes. Thus, there are inherent differences in sensitivity<br />
between detector pairs in the measurement process, and it is necessary to correct<br />
for these differences in order for measurements of coincidence events to correspond to<br />
the activity distribution being imaged. This correction is generally accomplished by<br />
exposing each detector pair to a uniform source distribution, typically created by a<br />
rotating rod source of 68 Ge and measuring the response of each detector pair. This<br />
data set is called a blank scan. The blank scan can be used to create normalization<br />
factors that are stored away and used to correct data subsequently acquired in image<br />
acquisition. Blank scans must be acquired frequently (at least weekly) in order to<br />
monitor system parameters and adequately correct for small changes in detector<br />
responses.<br />
A second factor to be considered is the exponential attenuation of photons within<br />
the body. Photons are either absorbed or scattered by tissues based on the attenuation<br />
coefficients of these tissues and the distance of travel through the body. The attenuation<br />
effects are much more significant in coincidence imaging than in single photon<br />
imaging since both photons from a single annihilation process must pass through the<br />
body without interaction in order to be detected and counted as a coincidence event.<br />
The probability of this occurrence is much less than that for a single photon emitted<br />
from the same location to escape the body without interaction. These effects result in<br />
non-uniformities, distortions of intense structures, and edge effects. Therefore, it is<br />
necessary to correct for attenuation to eliminate these effects, especially in the thorax<br />
and abdomen where attenuation is non-uniform due to the presence of different tissue<br />
types. Since the brain is relatively uniform, it is possible to perform a calculated<br />
attenuation correction. This is accomplished by outlining the outer contour of the<br />
head, assuming uniform attenuation within this volume, and calculating correction<br />
factors to be applied to the raw projection data.<br />
In the thorax and abdomen, because of the non-uniform attenuation, it is necessary to<br />
perform a measured attenuation correction. This approach is very accurate because<br />
attenuation of two annihilation photons from an annihilation event is independent of the<br />
location of the event. The total distance traveled through the patient is constant as shown in<br />
Fig. I.1.12A–C. It is therefore possible to measure the attenuation using an external source<br />
as shown in Fig. I.1.12D. In the past, this was typically accomplished by transmission<br />
scanning using a rotating rod source of 68 Ge as in the acquisition of a blank scan for<br />
detector normalization, but with the patient present in the scan field. The transmission data<br />
can then be used to correct the raw projection data during the reconstruction process.<br />
Iterative reconstruction algorithms can be easily adapted to handle the attenuation correction<br />
process. Transmission scans with high counting statistics are required in order to<br />
prevent the addition of statistical noise in the corrected images. In the past, it was necessary<br />
to perform the transmission scan prior to administration of the radiopharmaceutical into<br />
the patient. This resulted in lengthened studies and the need for careful repositioning of the<br />
patient before acquiring the emission scan. More recent improvements in count rate<br />
capabilities have made it possible to acquire transmission scans after the patient has been<br />
injected with a radiopharmaceutical by increasing the activity in the transmission source. It
20 J.A. Patton<br />
Fig. I.1.12 The attenuation of two annihilation photons is independent of the location at which the two<br />
photons were produced, since the photon pair must always travel the same distance within the patient and<br />
escape without interaction in order to be detected as a true event (A–C). Thus, attenuation can be measured<br />
using a rotating rod source of a positron emitter such as 68 Ge (D) (Reprinted with permission of <strong>Springer</strong><br />
Science+Business Media from Vitola J, Delbeke D, eds. Nuclear Cardiology and Correlative Imaging:<br />
A Teaching File. New York: <strong>Springer</strong>-Verlag, 2004.)<br />
has also been shown that it is possible to shorten the length of the transmission scan by<br />
using a process called segmented attenuation correction. In this process, attenuation<br />
coefficients are predetermined (based on certain tissue types) and limited in number. The<br />
measured attenuation coefficients from the transmission scan are then modified to match<br />
the closest allowed coefficients from the predetermined options. Figure I.1.13 shows a<br />
single coronal view reconstructed from a set of transmission scans, the corresponding<br />
view reconstructed from emission data using filtered backprojection, and the same view<br />
reconstructed using an OS-EM algorithm with attenuation correction.<br />
The addition of transmission scanning permits accurate delineation of body contours.<br />
This fact makes it possible to limit image reconstruction to the areas defined by the<br />
contours. In addition, accurately knowing these contours permits the development of<br />
mathematical models for determining the contribution to the images of random and scatter<br />
events, and subsequently the implementation of correction methods to eliminate their<br />
effect. Work is currently ongoing in this area.<br />
In order to make absolute measurements of activity in a region of the body, one<br />
additional calibration is necessary. A cylindrical phantom containing a very accurately
I.1 History and Principles of Hybrid Imaging 21<br />
Fig. I.1.13 (A) A coronal view of a transmission data set acquired from a multi-ring PET scanner. (B) A<br />
coronal view of a patient with gastric cancer imaged with 18 F-FDG. The image was reconstructed without<br />
attenuation correction using filtered back projection. (C) The same coronal view of the 18 F-FDG distribution<br />
reconstructed with attenuation correction from the transmission data set shown in (A) using an<br />
iterative reconstruction algorithm (OS-EM) (Reprinted with permission of <strong>Springer</strong> Science+Business<br />
Media from Vitola J, Delbeke D, eds. Nuclear Cardiology and Correlative Imaging: A Teaching File. New<br />
York: <strong>Springer</strong>-Verlag, 2004.)<br />
known distribution of activity is scanned and total counts (after attenuation correction) are<br />
determined. A quantitative calibration factor is then determined by dividing the measured<br />
counts per unit time by the concentration of activity in the phantom. This results in a<br />
calibration factor of counts/s per mCi/cc. To determine activity in a specific area, a region of<br />
interest is identified and the counts in the region are determined and converted to a count<br />
rate using the scan time, and the calibration factor is then used to calculate mCi/cc in the<br />
region. Current systems have the capability of measuring absolute activity to within 5%. In<br />
practice, it should be noted that the same acquisition and reconstruction algorithms (and<br />
filters) should be used in acquiring and processing the phantom data and the patient data in<br />
order to obtain accurate quantitative data. A quantitative measurement that has proven to<br />
be of use in some clinical applications is the standard uptake value (SUV). This factor is<br />
determined by normalizing the measured activity in a region to the administered activity per<br />
unit of patient weight. Using the SUV, regions of abnormal uptake can be compared to that<br />
of normal regions, and lesion uptake in serial scans can be compared.<br />
X-Ray Computed Tomography<br />
As described in the Introduction, SPECT and PET imaging technologies often suffer from<br />
insufficient anatomical detail. These deficiencies can be resolved by incorporating the techniques<br />
of x-ray CT into the image acquisition and reconstruction process. This technology was<br />
introduced to the medical community in the early 1970s when Hounsfield and Ambrose 23<br />
introduced a computerized x-ray tube-based tomographic scanner using reconstruction algorithms<br />
developed by McCormack 24 to provide images of tissue densities from acquired
22 J.A. Patton<br />
projections. CT scanning provides high quality and high spatial resolution ( 1 mm) images of<br />
cross-sectional anatomy and therefore provides a significant portion of the anatomical images<br />
acquired in oncological applications, not only for diagnosis and staging of disease but also for<br />
simulations used for radiation treatment planning. CT images generally have a high sensitivity<br />
for lesion detection, but may have limited specificity in some applications. CT images are<br />
acquired as transmission maps with a high photon flux and are actually high-quality representations<br />
of tissue attenuation and thus can provide the basis for attenuation correction.<br />
CT images are acquired by using a high-output x-ray tube and an arc of detectors in a<br />
fixed geometry to acquire cross-sectional transmission images of the patient as the x-ray<br />
tube and detectors configuration rapidly rotates around the patient as shown in<br />
Fig. I.1.14A, B. Current technology using multi-detector arrays and helical (spiral) scanning<br />
permits the simultaneous acquisition of as many as 64 thin slices (0.625 mm) in as little<br />
as 0.35 s. [If the rotation is 0.35 s, only a little more than half of the rotation is actually<br />
required to produce images.] The geometry of these third generation CT scanners results in<br />
the acquisition of transmission data in a fan beam geometry. However, each ray in a fan<br />
beam geometry can be represented by an equivalent ray in a parallel beam geometry.<br />
Fig. I.1.14 CT data are acquired in a fan beam geometry where individual rays represent transmitted<br />
photon intensities from multiple projections around the patient (A, B). These data can be reformatted into<br />
an orthogonal geometry similar to that used for SPECT (C, D) (Reprinted by permission of the Society of<br />
Nuclear Medicine from: James A. Patton and Timothy G. Turkington. SPECT/CT Physical Principles and<br />
Attenuation Correction. J Nucl Med Technol 2008 36(1):1–10. Fig. 4.)
I.1 History and Principles of Hybrid Imaging 23<br />
Therefore, a common approach is to convert the fan beam data to parallel beam<br />
geometry as illustrated diagrammatically in Fig. I.1.14C, D, in order to simplify the<br />
reconstruction process. This redistribution of data results in orthogonal data sets<br />
similar to that obtained from PET and SPECT. As many as 600 projection arrays<br />
are acquired in this manner in order to produce a high-quality transmission measurement<br />
of each slice of tissue.<br />
Each measured ray (I) is the initial ray intensity (I0) attenuated by a factor<br />
I ¼ I0e<br />
P xi m i<br />
where the index i represents all the different tissue type regions along the trajectory, mi<br />
are the effective attenuation coefficients for the different tissue regions, and xi are the<br />
corresponding thicknesses of the tissue regions, so that the sum represents the total<br />
attenuation through all regions. With filtered backprojection (or another tomographic<br />
reconstruction technique), these attenuation measurements obtained, along all rays at<br />
all angles, are used to produce cross-sectional arrays of tissue attenuation coefficients<br />
as shown in Fig. I.1.15A. The resulting arrays are high-quality images of body<br />
attenuation and therefore representative of body anatomy. In order to standardize<br />
the data and provide sufficient gray scale for display, the data are typically converted<br />
to CT numbers (Hounsfield units) as shown in Fig. I.1.15B by normalizing to the<br />
attenuation coefficient of water using the following equation:<br />
CT number ¼½ðm tissue m waterÞ=m waterŠ 1000:<br />
Fig. I.1.15 The transmitted intensities can be used to solve for attenuation coefficients (m) by using the unattenuated<br />
intensity (I o) by the attenuation equation (I = I o e –mx ). Using filtered backprojection, an array of<br />
attenuation coefficients for each anatomical slice can be determined (A) and converted to an array of CT<br />
numbers for display purposes (B) (Reprinted by permission of the Society of Nuclear Medicine from: James<br />
A. Patton and Timothy G. Turkington. SPECT/CT Physical Principles and Attenuation Correction. J Nucl<br />
Med Technol 2008 36(1):1–10. Fig. 5.)<br />
Based on this convention, the CT numbers of air and water are –1000 and 0, respectively.<br />
These images are typically displayed as 256 256 or 512 512 arrays, with pixels<br />
representing 0.5–2 mm of tissue, because of the high spatial resolution inherent in the<br />
measurements. 25,26<br />
i
24 J.A. Patton<br />
SPECT/CT and PET/CT<br />
The integration of an emission tomography system (SPECT or PET) with a transmission<br />
tomography system (CT) into a single imaging unit sharing a common imaging table<br />
provides a significant advance in technology. Lang, Hasegawa, and colleagues 27 developed<br />
a prototype SPECT/CT imaging system using an array of solid-state detectors to<br />
acquire both the emission and transmission data. They subsequently integrated a<br />
commercial CT scanner and single-head SPECT camera to acquire sequential SPECT<br />
and CT scans using a common imaging table. 28 This work led to the introduction of the<br />
first commercially available SPECT/CT system. 29 Atthesametime,Townsendand<br />
colleagues integrated a commercially available PET scanner and CT scanner to provide<br />
sequential PET and CT scans using a common imaging table. 30,31 These works introduced<br />
a new era in nuclear medicine imaging. These combinations permit the acquisition<br />
of emission and transmission data sequentially in a single study with the patient in an<br />
ideally fixed position. Thus, the two data sets can be acquired in a registered format by<br />
appropriate calibrations, permitting the acquisition of corresponding slices from the two<br />
modalities. The CT data can then be used to correct for tissue attenuation in the<br />
emission scans on a slice-by-slice basis. Since the CT data are acquired in a higher<br />
resolution matrix than the emission data, it is necessary to decrease the resolution of<br />
the CT data to match that of the emission data. In other words, the CT data are blurred<br />
to match the emission data for attenuation correction.<br />
One additional topic must be addressed in order to ensure the accuracy of the<br />
attenuation correction. The output of the x-ray tube used in CT provides a spectrum<br />
of photon energies from 0 keV up to the maximum photon energy (kVp = peak energy<br />
in keV) setting used for the acquisition as shown in Fig. I.1.16. Because low-energy<br />
photons are preferentially absorbed in tissue, the beam spectrum shifts toward the higher<br />
energy end as it passes through more tissue, thereby changing its effective m and producing<br />
a variety of artifacts (beam-hardening effects) in images, and filtering of the beam to<br />
remove low-energy photons is required. The spectrum after filtering shown in Fig. I.1.16<br />
has been ‘‘hardened’’ to reduce these effects. The resulting spectrum has an effective<br />
energy (mean) of approximately 70 keV in the example in Fig. I.1.16. Since attenuation<br />
effects vary with energy, it is necessary to convert the attenuation data acquired with CT<br />
to match the energy of the radionuclide used in the SPECT or PET acquisitions. For<br />
example in Fig. I.1.16, it is necessary to convert the attenuation data measured at an<br />
effective energy of 70–140 keV for 99m Tc. This is typically accomplished by using a<br />
bilinear model 32–34 relating attenuation coefficients at the desired energy to CT numbers<br />
measured at the effective energy of the CT beam of x-rays as shown in Fig. I.1.17. For<br />
CT numbers < 0,themeasuredtissueisassumedtobeacombinationofairandwater,<br />
and the attenuation coefficient at the desired energy (140 keV) can be calculated from the<br />
CT number by the equation.<br />
m tissue;140 keV ¼ CT# m water;140 keV m air;140 keV<br />
1000<br />
This equation describes the first component of the bilinear curve in Fig. I.1.17. For CT<br />
numbers >0, the conversion is more complicated due to the measured tissue being a
I.1 History and Principles of Hybrid Imaging 25<br />
Fig. I.1.16 Typical energy spectrum of x-rays from an x-ray tube. The shaded area shows the effects of<br />
filtration (beam hardening), which is used for CT scanning. These data can be used for attenuation<br />
correction of single photon emitters such as 99m Tc using the bilinear model shown in Fig. I.1.17<br />
(Reprinted by permission of the Society of Nuclear Medicine from: James A. Patton and Timothy G.<br />
Turkington. SPECT/CT Physical Principles and Attenuation Correction. J Nucl Med Technol 2008<br />
36(1):1–10. Fig. 7.)<br />
Fig. I.1.17 Bilinear model<br />
commonly used for<br />
converting measured CT<br />
numbers to attenuation<br />
coefficients for a specific<br />
radionuclide such as 99m Tc<br />
(Reprinted by permission of<br />
the Society of Nuclear<br />
Medicine from: James A.<br />
Patton and Timothy G.<br />
Turkington. SPECT/CT<br />
Physical Principles and<br />
Attenuation Correction.<br />
J Nucl Med Technol 2008<br />
36(1):1–10. Fig. 8.)<br />
combination of water and bone. In this case, the attenuation coefficient at the desired<br />
energy (140 keV) can be calculated from the CT number by the equation<br />
m tissue; 140 keV ¼ m water; 140 keV þ CT# m water; keVeff m bone; 140 keV m water; 140 keV<br />
1000 m bone; keVeff m water; keVeff<br />
This equation describes the second component of the bilinear curve in Fig. I.1.17. In<br />
practice, the various attenuation coefficients for specific photon energy used in the<br />
SPECT or PET acquisition and the effective photon energy used in the CT acquisition<br />
can be found in a stored look-up table in the reconstruction algorithm. The conversion<br />
can then be performed using two simple linear relationships relating the attenuation
26 J.A. Patton<br />
coefficient at the desired energy and the measured CT numbers for specific measured<br />
tissues. From the attenuation coefficient data acquired with CT, correction factors can<br />
then be determined as shown in Fig. I.1.16, which can then be used to correct the<br />
SPECT or PET data (Fig. I.1.18) for attenuation, yielding the attenuation-corrected<br />
SPECT or PET images. 35,36<br />
Fig. I.1.18 Conversion equations from the bilinear model are used to convert attenuation coefficient values<br />
(ms) measured with CT to values corresponding to the energy of the radionuclide being imaged in order to<br />
determine factors for attenuation correction of SPECT or PET data<br />
There are numerous advantages in the use of CT data for attenuation correction of<br />
emission data. First, the CT scan provides a very high photon flux which significantly<br />
reduces the statistical noise associated with the correction in comparison to other techniques<br />
(i.e., radionuclides used as transmission sources). Also, due to the fast acquisition<br />
speed of CT scanners, the total imaging time is significantly reduced by using this<br />
technology. Another advantage related to the high photon flux of CT scanners is that<br />
attenuation measurements can be made in the presence of radionuclide distributions with<br />
negligible contributions from photons emitted by the radionuclides (i.e., post-injection<br />
CT measurements can be performed). The use of CT also eliminates the need for<br />
additional hardware and transmission sources that often must be replaced on a routine<br />
basis. And, of course, the anatomical images acquired with CT can be fused with the<br />
emission images to provide functional anatomical maps for accurate localization of<br />
radiopharmaceutical uptake.<br />
Clinical SPECT/CT Systems<br />
Clinical SPECT/CT systems currently available from manufacturers typically have dualhead<br />
scintillation cameras positioned in front of the CT scanner and sharing a common<br />
imaging table. There are two approaches to clinical SPECT/CT applications. The first<br />
approach is the use of a low-output, slow-acquisition CT scanner, the Hawkeye 1 with
I.1 History and Principles of Hybrid Imaging 27<br />
dual-head Infinia TM manufactured by General Electric Healthcare Systems. The CT<br />
scanner consists of a low-output x-ray tube (2.5 mA) and four linear arrays of detectors<br />
and can acquire four 5-mm anatomical slices in 13.6 s with a high contrast spatial resolution<br />
> 3 lp/cm. The images acquired with this system are not of sufficient quality to be used for<br />
billable procedures, but are sufficient to be used for attenuation correction and anatomical<br />
correlation with emission scans. The slow scan speed is actually an advantage in regions<br />
where there is physiological motion since the CT image blurring from the motion is<br />
comparable to that of the emission scans resulting in a good match in fused images.<br />
Radiation dose from this system is typically < 5 mGy (500 mrads) compared to values of<br />
10–100 mGy (1–10 mrads) for applications using radioisotope transmission sources.<br />
The second approach is to integrate commercially available CT scanners with dual-head<br />
scintillation cameras. The Symbia 1 with dual-head E-Cam manufactured by Siemens<br />
Medical Systems is available at present in one, two, and six slice versions with variable<br />
tube currents (20–345 mA), slice thicknesses of 0.6–10 mm, and rotational speeds of 0.6–1.5 s.<br />
The Precedence with dual-head Skylight manufactured by Philips Medical Systems is<br />
available in 16 and 64 slice versions with variable tube currents (20–500 mA), slice thicknesses<br />
of 0.6–12 mm, and rotational speeds as fast as 0.5 s. These systems exhibit high<br />
contrast spatial resolutions of 13–15 lp/cm with approximately 4–5 times the patient<br />
radiation dose of that from the Hawkeye 1 system. Since the CT scanners in the systems<br />
are commercially available diagnostic systems, the images produced are of sufficient quality<br />
to be used for billable procedures, in addition to the obvious attenuation correction and<br />
anatomical correlation applications. Radiation doses from these systems are on the order of<br />
20 mGy (2 rads) when diagnostic quality images are produced. It should be noted that these<br />
systems can also be operated in a lower radiation dose mode by reducing the x-ray tube<br />
current. Although the images provided by this mode of operation typically are not of<br />
sufficient quality to be used for billable procedures, they are acceptable for attenuation<br />
correction and anatomical correlation applications.<br />
Clinical PET/CT Systems<br />
Clinical PET/CT systems are only available with diagnostic CT scanners, and systems are<br />
generally acquired with 4, 8, 16, or 64 slice capability providing images of sufficient diagnostic<br />
quality to be used for billable procedures. As with SPECT/CT systems, the CT scanners can<br />
be operated at reduced tube current if the scans are only to be used for attenuation correction.<br />
Contrast Agents<br />
Many diagnostic applications of CT scanning require the use of contrast agents administered<br />
either orally or intravenously to improve the visualization of soft tissue structures in the body.<br />
However, the use of a contrast CT scan for attenuation correction is a source of some concern.<br />
The introduction of a dense, high atomic number agent such as iodine increases the attenuation<br />
coefficients of the regions of tissue in which the contrast agent is located. This presence visually<br />
enhances the region in CT images by increasing the attenuation oftheradiationbeaminthat<br />
region. However, when using the contrast CT scan for attenuation correction, the measured<br />
attenuation coefficients will be artificially increased potentially resulting in an artificial<br />
enhancement of the radionuclide distribution in the regions containing the contrast agent. In
28 J.A. Patton<br />
other words, the potential exists for the creation of artifacts of increased radionuclide uptake in<br />
those regions. For this reason, caution is indicated in the use of contrast CT scans for<br />
attenuation correction, and it is advised that the uncorrected SPECT or PET scan be carefully<br />
reviewed to insure that no artifacts have been created in the corrected images.<br />
Beam-Hardening Artifacts<br />
It is not uncommon to see streak artifacts in CT scans in regions of the body containing dense<br />
bony structures. These artifacts are due to the preferential absorption of low-energy photons by<br />
the structures resulting in streaks of decreased photon flux in the final images. This phenomenon,<br />
known as beam hardening, is more severe in regions where metal objects such as surgical<br />
clips and prosthetic devices are present. In many instances, the presence of these artifacts will<br />
invalidate the use of the CT scan for attenuation correction in those regions.<br />
Physiological Motion<br />
The accurate registration of a SPECT or PET scan with a CT scan depends on careful<br />
calibrations of the sequential data acquisition processes and assumes that there is no patient<br />
movement during the acquisitions. However, the natural physiological motion of the lungs and<br />
heart poses potential problems. These problems exist due to the fact that CT acquisitions are<br />
fast, i.e., images of multiple slices are acquired in less than a second, and SPECT and PET<br />
acquisitions are slow, i.e., several minutes per view. The relatively fast motion of the heart<br />
results in the motion being smoothed out in both data sets so that a reasonable registration is<br />
usually obtained. However, the slower motion of the lungs often results in a misregistration at<br />
thebaseofthelungsthatcancausedifficultyinthe accurate localization of lesions in this area.<br />
PET/CT systems are now available with respiratory gating capability so that both the CT and<br />
the PET scan of the chest can accurately be registered by eliminating the effects of lung motion.<br />
Radiation Dosimetry Considerations<br />
The replacement of conventional transmission sources with CT increases the concern regarding<br />
radiation dose to the patient. In the past, the radiation dose from transmission sources such as<br />
153 Gd used in SPECT and 68 Ge used in PET was generally ignored due to the small values<br />
associated with their use in comparison to the dose from the radionuclides used in these studies.<br />
For example, the effective dose equivalent (EDE) for a PET transmission scan with 68 Ge is on<br />
the order of 0.12 milli-Sieverts (mSv). However, when CT is used, the associated dose with this<br />
procedure is of such magnitude that it must be taken into consideration. The EDE for a<br />
diagnostic CT of the chest/abdomen/pelvis is on the order of 13 mSv assuming 140 kVp,<br />
340 mA, 0.5 s rotation time, 5 mm slice, and 17.5 cm/s table feed. For comparison purposes, the<br />
EDEfromaPETscanwith10mCiof 18 FDG is 11 mSv 37 andfromaSPECTscanwith25mCi<br />
of 99m Tc labeled white cells is 18.5 mSv. 37 Thus, the addition of the diagnostic CT increases the<br />
dose by 118% and 70%, respectively, in these two examples. If the CT scan is only to be used<br />
for attenuation correction, the tube current (mA) can be reduced by a factor of 4 or more,<br />
reducing the EDE to no more than 3.3 mSv. The attenuation measurement with CT would then<br />
increase the total EDE by only 30% and 18%, respectively, in the two examples. Every patient’s
I.1 History and Principles of Hybrid Imaging 29<br />
study should be reviewed carefully prior to beginning the study in order that the CT acquisition<br />
parameters can be adjusted to achieve the desired data while minimizing radiation dose.<br />
Quality Assurance<br />
In addition to the routine quality assurance procedures that are routinely performed with CT<br />
scanners and scintillation cameras with SPECT capability, it is important to routinely verify the<br />
accuracy of the registration techniques that are used with these combined systems. Errors in<br />
registration will cause inaccuracies in attenuation correction procedures and improper correlations<br />
of anatomy and function. All manufacturers recommend the scanning of an image<br />
registration phantom, such as the one shown in Fig. I.1.19, with recommended weekly or<br />
monthly frequencies. The phantom shown in Fig. I.1.19 has six radioactivity-filled syringes that<br />
are positioned along the three imaging axes. The phantom is scanned sequentially with the CT<br />
scanner, and scintillation camera and errors are calculated between the measured center<br />
locations of the syringes. These measurements are then compared with the acceptable errors<br />
for the system, typically 3–5 mm, in order to verify that the registration accuracy is sufficient for<br />
clinical applications. It may be important to do these measurements with substantial weight on<br />
the table to mimic the clinical situation.<br />
Fig. I.1.19 (A–C) Phantom used for quality assurance of the registration of images acquired with CT and<br />
SPECT in an integrated system (Reprinted by permission of the Society of Nuclear Medicine from: James<br />
A. Patton and Timothy G. Turkington. SPECT/CT Physical Principles and Attenuation Correction. J Nucl<br />
Med Technol 2008 36(1):1–10. Fig. 15.)
30 J.A. Patton<br />
Currently, the most common application of attenuation correction techniques in nuclear<br />
medicine is cardiac perfusion imaging. 38 The use of an accurate attenuation correction can<br />
provide valuable information in making the correct diagnostic interpretation. However,<br />
slight misalignments of the transmission and emission scans, often due to patient motion,<br />
can result in artifacts in the attenuation-corrected images. Because of this potential<br />
problem, manufacturers typically provide correction software to adjust the alignment of<br />
the two data sets. An example of currently available attenuation correction quality control<br />
(ACQC) software provided by General Electric Healthcare Systems is shown in Fig. I.1.20.<br />
In Fig. I.1.20B, CT images of the myocardium in the standard three orthogonal views<br />
format are shown with the perfusion images fused to this data set and presented as contours<br />
typically set at 30% of maximum counts. In these images, there is an obvious misalignment<br />
that results in attenuation-corrected images with artifacts of decreased perfusion as shown<br />
in Fig. I.1.20A. Under cursor control, the data sets can be re-aligned in the three views<br />
resulting in correct alignment as shown in Fig. I.1.20D. This results in the production of<br />
accurate attenuation-corrected perfusion images (Fig. I.1.20C). This is a valuable quality<br />
assurance technique that should be used regularly to validate registration prior to final<br />
image reconstruction and display in order to increase the level of confidence of the interpreting<br />
physician. 39<br />
Fig. I.1.20 Demonstration of the attenuation correction artifacts in a perfusion study (A) resulting from a<br />
misalignment of the CT and SPECT data sets (B) and the removal of these artifacts (C) after a re-alignment<br />
of the data sets (D) using registration quality assurance software (Reprinted by permission of the Society of<br />
Nuclear Medicine from: James A. Patton and Timothy G. Turkington. SPECT/CT Physical Principles and<br />
Attenuation Correction. J Nucl Med Technol 2008 36(1):1–10. Fig. 16.)
I.1 History and Principles of Hybrid Imaging 31<br />
Conclusions<br />
The impact of the availability of hybrid imaging systems has been significant to diagnostic<br />
imaging. This impact is emphasized by the fact that during the past 2 years many scintillation<br />
cameras and most PET scanners have been purchased in combination with CT<br />
scanners in hybrid configurations. Clinicians now have the ability to image radiopharmaceutical<br />
distributions in registered format with anatomical images to accurately correlate<br />
function with anatomy and to improve image quality using the anatomical data for<br />
attenuation correction. This technology significantly improves the overall quality of the<br />
diagnostic information obtained and also provides data to improve therapeutic decisions<br />
thus enhancing patient care. The hybrid technology is now being extended to PET/MRI<br />
systems, and further advances are foreseen with this new capability.
32 J.A. Patton<br />
References<br />
1. Anger HO, Rosenthal DJ. Scintillation camera and positron camera. In Medical Radioisotope Scanning.<br />
Vienna: International Atomic Energy Agency, 1959:59–75.<br />
2. Kuhl DE, Edwards RQ. Image separation radioisotope scanning. Radiology 1963;80:653–662.<br />
3. Kuhl DE, Edwards RQ. Cylindrical and section radioisotope scanning of the liver and brain. Radiology<br />
1964;83:926–936.<br />
4. Kuhl DE. A clinical radioisotope scanner for cylindrical and section scanning. In Medical Radioisotope<br />
Scanning, Vol. 1. Vienna: International Atomic Energy Agency, 1964:273–289.<br />
5. Muehllehner G. A tomographic scintillation camera. Phy Med Biol 1971;16:87–96.<br />
6. Keyes JW, Oleandea N, Heetderks WJ, Leonard PF, Rogers, WL. The humongotron: A scintillation<br />
camera transaxial tomography. J Nucl Med 1977;18:381–387.<br />
7. Jaszczak RJ, Huard D, Murphy P, Burdine J. Radionuclide emission tomography with a scintillation<br />
camera. J Nucl Med 1976;17:551.<br />
8. Galt JR, Germano G. Advances in instrumentation for cardiac SPECT. In DePuey EG, Berman DS,<br />
Garcia EV (eds): Cardiac SPECT Imaging. New York: Raven Press, 1995:91–102.<br />
9. Garcia EV (ed). Imaging guidelines for nuclear cardiology procedures, part I. J Nucl Cardiol<br />
1996;3:G3–45.<br />
10. Shepp LA, Vardi Y. Maximum likelihood reconstruction for emission tomography. IEEE Trans Med<br />
Imaging 1982;MI-1:113–122.<br />
11. Hudson HM, Larkin RS. Accelerated image reconstruction using ordered subsets of projection<br />
data. J Nucl Med 1994;13:601–609.<br />
12. Muehllehner G, Buchin M, Dudek J. Performance parameters of a positron imaging camera. IEEE<br />
Trans Nucl Sci 1976;NS-23:528–537.<br />
13. Patton JA. Instrumentation for coincidence imaging with multihead cameras. Semin Nucl Med<br />
2000;30:239–254.<br />
14. Robertson J, Marr R, Roseblurn B. Thirty-two crystal positron transverse section detector. In<br />
Freedman G (ed): Tomographic Imaging in Nuclear Medicine. New York: Society of Nuclear Medicine,<br />
1973:151–153.<br />
15. Burnham C, Brownell G. A multi-crystal positron camera. IEEE Trans Nucl Sci 1972;19:201–205.<br />
16. Brownell G, Burnham C. MGH positron camera. In Freedman G (ed): Tomographic Imaging in Nuclear<br />
Medicine. New York: Society of Nuclear Medicine, 1973:154–164.<br />
17. Ter-Pogossian MM, Phelps ME, Hoffman EJ, Mullani N. A positron-emission transaxial tomography<br />
for nuclear imaging (PETT). Radiology 1975;114:89–98.<br />
18. Phelps ME, Hoffman E, Mullani N, Ter-Pogossian MM. Application of annihilation coincidence<br />
detection to transaxial reconstruction tomography. J Nucl Med 1975;16:210–224.<br />
19. Phelps ME, Hoffman E, Mullani N, Higgins CS, Ter-Pogossian MM. Design considerations for a<br />
positron emission transaxial tomography (PETT III). IEEE Trans Nucl Sci 1976;NS-23:516–522.<br />
20. Hoffman E, Phelps ME, Mullani N, Higgins CS, Ter-Pogossian MM. Design and performance<br />
characteristics of a whole body transaxial tomography. J Nucl Med 1976;17:493–503.<br />
21. Phelps ME, Hoffman E, Huang S, Kuhl D. ECAT: A new computerized tomographic imaging system<br />
for positron emitting radiopharmaceuticals. J Nucl Med 1978;19:635–647.<br />
22. Hoffman E, Ricci A, van der Stee LMAM, Phelps ME. ECATIII – Basic design considerations. IEEE<br />
Trans Nucl Sci 1983;NS-30:729–733.<br />
23. Hounsfield G, Ambrose J. Computerized transverse axial scanning (tomography). Part I: Description<br />
of system. Part II: Clinical applications. Br J Radiol 1973;46:1016–1047.<br />
24. McCormack A. Reconstruction of densities from their projections, with applications to radiological<br />
physics. Phys Med Biol 1973;18:195–207.<br />
25. X-Ray Computed Tomography. In Bushberg JT, Seibert JA, Leidholdt, Jr. EM, Boone JM (eds): The<br />
Essential Physics of Medical Imaging, Second Edition. Philadelphia: Lippincott Williams & Wilkins,<br />
2002:327–369.<br />
26. Bruyant PP. Analytic and iterative reconstruction algorithms in SPECT. JNuclMed2002;43:1343–1358.<br />
27. Lang TF, Hasegawa BH, Liew SC, Brown JK, Blankespoor S, Reilly SM, Gingold EL, Cann CE. A<br />
prototype emission-transmission imaging system. IEEE Nucl Sci Symp Conf Rec 1991;3:1902–1906.<br />
28. Lang TF, Hasegawa BH, Liew SC, Brown JK, Blankespoor CS, Reilly SM, Gingold EL, Cann CE.<br />
Description of a prototype emission-transmission computed tomography imaging system. J Nucl Med<br />
1992;33:1881–1887.
I.1 History and Principles of Hybrid Imaging 33<br />
29. Patton JA, Delbeke D, Sandler MP. Image fusion using an integrated, dual-head coincidence camera<br />
with X-ray tube-based attenuation maps. J Nucl Med 2000;41:1364–1368.<br />
30. Townsend DW, Beyer T, Kinahan PE, Brun T, Roddy R, Nutt R, Byars LG. The SMART scanner: A<br />
combined PET/CT tomography for clinical oncology. IEEE Nucl Sci Symp Conf Rec1998;2:170–1174,<br />
paper M5-1.<br />
31. Beyer T, Townsend DW, Brun T, Kinahan PE, Charron M, Roddy R, Jerin J, Young J, Byars L, Nutt<br />
R. A combined PET/CT scanner for clinical oncology. J Nucl Med 2000;41:1369–1379.<br />
32. Kinahan PE, Hasegawa BH, Beyer T. X-ray-based attenuation correction for positron mission tomography/computed<br />
tomography scanners. Semin Nuc Med 2003;33:166–179.<br />
33. LaCroix KJ, Tsui BMW, Hasegawa BH, Brown JK. Investigation of the use of X-ray CT images for<br />
attenuation compensation in SPECT. IEEE Trans Nucl Sci 1994; NS-41:2793–2799.<br />
34. Blankespoor SC, Xu X, Kalki CK, Brown JK, Tang HR, Cann CE, Hasegawa BH.Attenuation correction<br />
of SPECT using X-ray CT on an emission-transmission CT system: Myocardial perfusion assessment.<br />
IEEE Trans Nucl Sci 1996; NS-43:2263–2274.<br />
35. Zaidi H, Hasegawa BH. Determination of the attenuation map in emission tomography. J Nucl Med<br />
2003;44:291–315.<br />
36. King MA, Glick SJ, Pretorius PH, Wells RG, Gifford HC, Narayanan MV, Farncombe T. Attenuation,<br />
scatter, and spatial resolution compensation in SPECT. In Wernick MN, Aarsvold JN (eds): Emission<br />
Tomography: The Fundamentals of PET and SPECT. London: Elsevier Academic Press, 2004:473–494.<br />
37. Stabin, M, Stubbs JB, Toohey RE. Radiation Dose Extimates for Radiopharmaceuticals. Oak Ridge,<br />
TN: Radiation Internal Dose Information Center, ORNL, 1996.<br />
38. Shaw LJ, Berman DS, Bax JJ, Brown KA, Cohen MC, Hendel RC, Mahmarian JJ, Williams KA, Ziffer<br />
JA. Computed tomographic imaging within nuclear cardiology, ASNC information statement – approved<br />
November 2004. JNuclCardiol2005;12:131–142.<br />
39. Tonge CM, Ellul G, Pandit M, Lawson RS, Shields RA, Arumugam P, Prescott MC. The value of<br />
registration correction in the attenuation correction of myocardial SPECT studies using low resolution<br />
computed tomography images. Nucl Med Commun 2006;27:843–852.
http://www.springer.com/978-0-387-92819-7