A very basic tutorial for performing linear mixed
A very basic tutorial for performing linear mixed
A very basic tutorial for performing linear mixed

Create successful ePaper yourself
Turn your PDF publications into a flip-book with our unique Google optimized e-Paper software.
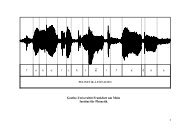
as <strong>linear</strong> <strong>mixed</strong> effects models, we want to know whether the difference in voice<br />
pitch between the polite and the in<strong>for</strong>mal condition are due to chance…<br />
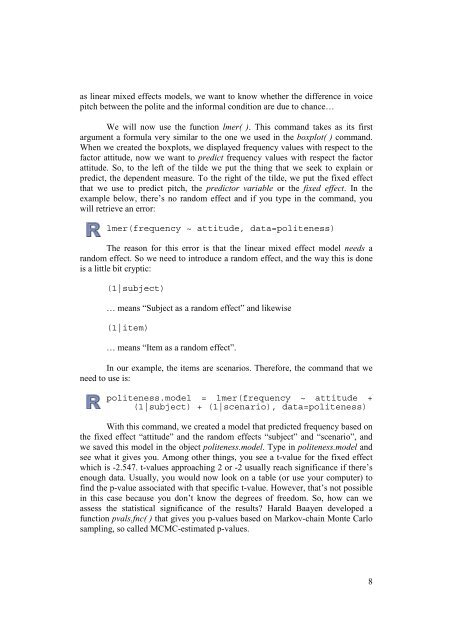
We will now use the function lmer( ). This command takes as its first<br />
argument a <strong>for</strong>mula <strong>very</strong> similar to the one we used in the boxplot( ) command.<br />
When we created the boxplots, we displayed frequency values with respect to the<br />
factor attitude, now we want to predict frequency values with respect the factor<br />
attitude. So, to the left of the tilde we put the thing that we seek to explain or<br />
predict, the dependent measure. To the right of the tilde, we put the fixed effect<br />
that we use to predict pitch, the predictor variable or the fixed effect. In the<br />
example below, there’s no random effect and if you type in the command, you<br />
will retrieve an error:<br />
lmer(frequency ~ attitude, data=politeness)<br />
The reason <strong>for</strong> this error is that the <strong>linear</strong> <strong>mixed</strong> effect model needs a<br />
random effect. So we need to introduce a random effect, and the way this is done<br />
is a little bit cryptic:<br />
(1|subject)<br />
… means “Subject as a random effect” and likewise<br />
(1|item)<br />
… means “Item as a random effect”.<br />
In our example, the items are scenarios. There<strong>for</strong>e, the command that we<br />
need to use is:<br />
politeness.model = lmer(frequency ~ attitude +<br />
(1|subject) + (1|scenario), data=politeness)<br />
With this command, we created a model that predicted frequency based on<br />
the fixed effect “attitude” and the random effects “subject” and “scenario”, and<br />
we saved this model in the object politeness.model. Type in politeness.model and<br />
see what it gives you. Among other things, you see a t-value <strong>for</strong> the fixed effect<br />
which is -2.547. t-values approaching 2 or -2 usually reach significance if there’s<br />
enough data. Usually, you would now look on a table (or use your computer) to<br />
find the p-value associated with that specific t-value. However, that’s not possible<br />
in this case because you don’t know the degrees of freedom. So, how can we<br />
assess the statistical significance of the results? Harald Baayen developed a<br />
function pvals.fnc( ) that gives you p-values based on Markov-chain Monte Carlo<br />
sampling, so called MCMC-estimated p-values.<br />
8