Early Warning Systems - UNEP/GRID-Sioux Falls
Early Warning Systems - UNEP/GRID-Sioux Falls
Early Warning Systems - UNEP/GRID-Sioux Falls

You also want an ePaper? Increase the reach of your titles
YUMPU automatically turns print PDFs into web optimized ePapers that Google loves.
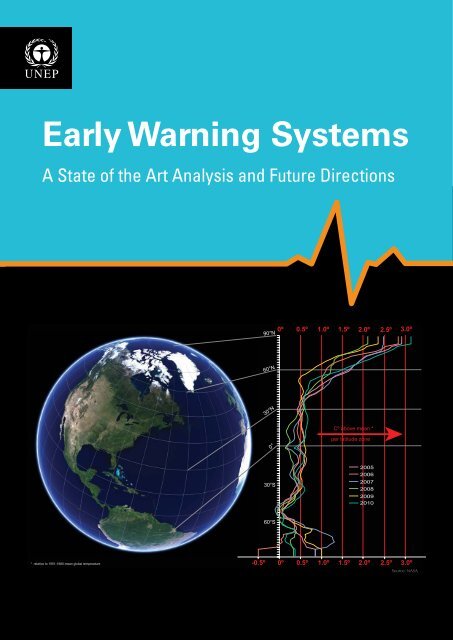
<strong>Early</strong> <strong>Warning</strong> <strong>Systems</strong><br />
A State of the Art Analysis and Future Directions<br />
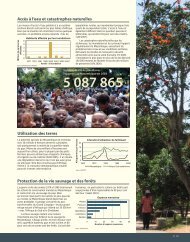
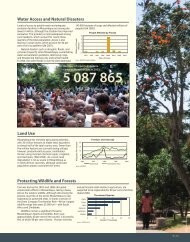
* relative to 1951-1980 mean global temperature<br />
-0.5º<br />
90°N<br />
60°N<br />
30°N<br />
0°<br />
30°S<br />
60°S<br />
0º<br />
0º<br />
0.5º<br />
0.5º<br />
1.0º<br />
1.0º<br />
1.5º<br />
2.0º<br />
Cº above mean *<br />
per latitude zone<br />
1.5º<br />
2005<br />
2006<br />
2007<br />
2008<br />
2009<br />
2010<br />
2.0º<br />
2.5º<br />
2.5º<br />
3.0º<br />
3.0º<br />
Source: NASA<br />
1
2<br />
© 2012 United Nations Environment Programme<br />
Publication: <strong>Early</strong> <strong>Warning</strong> <strong>Systems</strong>: A State of the Art Analysis and Future Directions<br />
ISBN: 978-92-807-3263-4<br />
Job Number: DEW/1531/NA<br />
United Nations Environment Programme, Nairobi.<br />
The report was prepared by Veronica Grasso, now with UNDP (Veronica.Grasso@undp.org),<br />
Ashbindu Singh, <strong>UNEP</strong> (Ashbindu.Singh@unep.org) and Janak Pathak, <strong>UNEP</strong> (janak.pathak@unep.org).<br />
Special thanks to Zinta Zommers of Oxford University, Arshia Chander of SGT, Inc., and Ramesh Singh of Chapman University and Editor of<br />
the Int. Journal of Natural Hazards for reveiwing the document and many valuable suggestions.<br />
Design and Layout - Kim Giese, <strong>UNEP</strong>/<strong>GRID</strong>-<strong>Sioux</strong> <strong>Falls</strong><br />
Disclaimers<br />
The content and views expressed in this publication are those of the authors and do not necessarily reflect the views or policies, or carry<br />
the endorsement of the contributory organisations or the United Nations Environment Programme (<strong>UNEP</strong>). The designations employed and<br />
the presentation of material in this publication do not imply the expression of any opinion whatsoever on the part of <strong>UNEP</strong> concerning the<br />
legal status of any country, territory or city or its authorities, or concerning the delimitation of its frontiers and boundaries. Reference to a<br />
commercial company or product in this publication does not imply the endorsement of <strong>UNEP</strong>.<br />
© Maps, photos, and illustrations as specified.<br />
Reproduction<br />
This publication may be reproduced in whole or in part and in any form for educational or non-profit purposes without special permission<br />
from the copyright holder, provided acknowledgement of the source is made. <strong>UNEP</strong> would appreciate receiving a copy of any publication<br />
that uses this publication as a source. No use of this publication may be made for resale or any other commercial purpose whatsoever<br />
without prior permission in writing from <strong>UNEP</strong>. Applications for such permission, with a statement of purpose and intent of the reproduction,<br />
should be addressed to the Director, Division of Communications and Public Information (DCPI), <strong>UNEP</strong>, P.O. Box 30552, Nairobi 00100,<br />
Kenya. The use of information from this publication concerning proprietary products for publicity or advertising is not permitted.<br />
Citation<br />
<strong>UNEP</strong> (2012). <strong>Early</strong> <strong>Warning</strong> <strong>Systems</strong>: A State of the Art Analysis and Future Directions. Division of <strong>Early</strong> <strong>Warning</strong> and Assessment (DEWA),<br />
United Nations Environment Programme (<strong>UNEP</strong>), Nairobi<br />
Produced by<br />
<strong>UNEP</strong> Division of <strong>Early</strong> <strong>Warning</strong> and Assessment<br />
United Nations Environment Programme<br />
P.O. Box 30552<br />
Nairobi, 00100, Kenya<br />
Tel: (+254) 20 7621234<br />
Fax: (+254) 20 7623927<br />
E-mail: uneppub@unep.org<br />
Web: www.unep.org<br />
This publication is available from http://www.unep.org<br />
<strong>UNEP</strong><br />
promotes environmentally sound<br />
practices globally and in its own activities. This<br />
publication has not been printed as our distribution<br />
policy aims to reduce <strong>UNEP</strong>’s carbon footprint.
<strong>Early</strong> <strong>Warning</strong> <strong>Systems</strong><br />
A State of the Art Analysis and Future Directions<br />
3
Table of Contents<br />
Chapter 1: Introduction .................................................................................................................................................................................................. 1<br />
1.1 <strong>Early</strong> warning .................................................................................................................................................................................................. 1<br />
1.2 Types of hazards .............................................................................................................................................................................................. 1<br />
1.3 <strong>Early</strong> warning systems: operational aspects ........................................................................................................................................... 3<br />
1.4 Communication of early warning information ...................................................................................................................................... 4<br />
1.5 <strong>Early</strong> warning systems and policy .............................................................................................................................................................. 6<br />
Chapter 2: The Role of Earth Observation ............................................................................................................................................................... 8<br />
2.1 Ongoing and rapid/sudden-onset environmental threats ................................................................................................................. 8<br />
Oil spills .................................................................................................................................................................................................. 8<br />
Chemical and nuclear accidents .................................................................................................................................................... 9<br />
Geological hazards .............................................................................................................................................................................. 9<br />
Earthquakes ........................................................................................................................................................................................... 9<br />
Landslides............................................................................................................................................................................................... 9<br />
Tsunami ................................................................................................................................................................................................10<br />
Volcanic eruptions .............................................................................................................................................................................10<br />
Hydro-meteorological hazards .....................................................................................................................................................10<br />
Floods ................................................................................................................................................................................................10<br />
Epidemics .............................................................................................................................................................................................11<br />
Wildfires ................................................................................................................................................................................................11<br />
2.2 Slow-onset (or “creeping”) environmental threats ..............................................................................................................................11<br />
Air quality .............................................................................................................................................................................................11<br />
Water quality .......................................................................................................................................................................................11<br />
Droughts, desertification and food security ............................................................................................................................12<br />
Droughts ..............................................................................................................................................................................12<br />
Desertification ................................................................................................................................................................. 12<br />
Food security ................................................................................................................................................................... 12<br />
Impact of climate variability ....................................................................................................................................................... 13<br />
Location specific environmental changes ................................................................................................................................13<br />
Chapter 3: Inventory of <strong>Early</strong> <strong>Warning</strong> <strong>Systems</strong>..................................................................................................................................................14<br />
3.1 Ongoing and rapid/sudden-onset environmental threats ...............................................................................................................14<br />
Oil spills ................................................................................................................................................................................................14<br />
Chemical and nuclear accidents ..................................................................................................................................................14<br />
Geological hazards ............................................................................................................................................................................15<br />
Earthquakes ........................................................................................................................................................................15<br />
Landslides ............................................................................................................................................................................15<br />
Tsunamis ..............................................................................................................................................................................15<br />
Volcanic eruptions .............................................................................................................................................................16<br />
Wildfires ................................................................................................................................................................................16<br />
Hydro-meteorological hazards (except droughts) ................................................................................................................17<br />
Floods ....................................................................................................................................................................................17<br />
Severe weather, storms and tropical cyclones ...........................................................................................................17<br />
Epidemics .............................................................................................................................................................................................18<br />
3.2 Slow-onset (or “creeping”) environmental threats ..............................................................................................................................18<br />
Air quality .............................................................................................................................................................................................18<br />
Droughts, desertification and food security ............................................................................................................................19<br />
Drought ................................................................................................................................................................................19<br />
Desertification ....................................................................................................................................................................20<br />
Food security .......................................................................................................................................................................20<br />
Impact of climate variability ..........................................................................................................................................................20<br />
Chapter 4: Conclusions and Future Perspectives ...............................................................................................................................................21<br />
4.1 <strong>Early</strong> warning systems: current gaps and needs ..................................................................................................................................21<br />
4.2 <strong>Early</strong> warning systems: future perspectives ...........................................................................................................................................21<br />
4.3 State of existing multi-hazard global monitoring/early warning systems ...................................................................................21<br />
4.4 Conclusions and recommendations........................................................................................................................................................25<br />
References .............................................................................................................................................................................................................................27<br />
Acronyms ...............................................................................................................................................................................................................................28<br />
Appendix................................................................................................................................................................................................................................30<br />
Glossary ..................................................................................................................................................................................................................................58<br />
i
ii<br />
Air monitoring station, Reno, Nevada, USA.<br />
Kecko/Flickr.com
Chapter 1: Introduction<br />
At a time of global changes, the world is striving to face<br />
and adapt to inevitable, possibly profound, alteration.<br />
Widening of droughts in southern Europe and sub-Saharan<br />
Africa, an increasing number of disasters, severe and more<br />
frequent flooding that could imperil low-lying islands<br />
and the crowded river deltas of southern Asia, are already<br />
taking place and climate change will cause additional<br />
environmental stresses and societal crises in regions already<br />
vulnerable to natural hazards, poverty and conflicts.<br />
A global multi-hazard early warning system is needed<br />
to inform us of pending threats. This report presents a<br />
state of the art assessment of existing monitoring/early<br />
warning systems (EWS) organized according to type of<br />
environmental threats , including air quality, wildland<br />
fires, nuclear and chemical accidents, geological hazards<br />
(earthquakes, tsunamis, volcanic eruptions, landslides),<br />
hydro-meteorological hazards (desertification, droughts,<br />
floods, impacts of climate variability, severe weather, storms,<br />
and tropical cyclones), epidemics and food insecurity. It<br />
identifies current gaps and needs with the goal of laying<br />
out guidelines for developing a global multi-hazard early<br />
warning system.<br />
Chapter 1 introduces the basic concepts of early warning<br />
systems; Chapter 2 introduces the role of earth observation<br />
systems for disasters and environmental change; Chapter 3<br />
focuses on existing early warning/monitoring systems; and<br />
Chapter 4 presents a global multi-hazard approach to<br />
early warning.<br />
1.1 <strong>Early</strong> warning<br />
<strong>Early</strong> warning (EW) is “the provision of timely and effective<br />
information, through identified institutions, that allows<br />
individuals exposed to hazard to take action to avoid<br />
or reduce their risk and prepare for effective response”,<br />
and is the integration of four main elements according<br />
to the United Nations’ International Strategy for Disaster<br />
Reduction (ISDR), it integrates (UN 2006):<br />
1. Risk Knowledge: Risk assessment provides essential<br />
information to set priorities for mitigation and<br />
prevention strategies and designing early warning<br />
systems.<br />
2. Monitoring and Predicting: <strong>Systems</strong> with monitoring and<br />
predicting capabilities provide timely estimates of the<br />
potential risk faced by communities, economies and<br />
the environment.<br />
3. Disseminating Information: Communication systems<br />
are needed for delivering warning messages to the<br />
potentially affected locations to alert local and regional<br />
governmental agencies. The messages need to be<br />
reliable, synthetic and simple to be understood by<br />
authorities and the public.<br />
4. Response: Coordination, good governance and<br />
appropriate action plans are key points in effective<br />
early warning. Likewise, public awareness and<br />
education are critical aspects of disaster mitigation.<br />
Failure of any part of the system will imply failure of the<br />
whole system. For example, accurate warnings will have no<br />
impact if the population is not prepared or if the alerts are<br />
received but not disseminated by the agencies receiving<br />
the messages.<br />
The basic idea behind early warning is that the earlier<br />
and more accurately we are able to predict short- and longterm<br />
potential risks associated with natural and humaninduced<br />
hazards, the more likely we will be able to manage<br />
and mitigate a disaster’s impact on society, economies,<br />
and environment.<br />
1.2 Types of hazards<br />
Environmental hazards can be associated with: ongoing and<br />
rapid/sudden-onset threats and slow-onset (or “creeping”)<br />
threats.<br />
1. Ongoing and Rapid/sudden-onset: These include such<br />
hazards as: accidental oil spills, nuclear plant failures,<br />
and chemical plant accidents—such as inadvertent<br />
chemical releases to the air or into rivers and water<br />
bodies—geological hazards and hydro-meteorological<br />
hazards (except droughts).<br />
2. Slow-onset (or “creeping”): Incremental but long-term<br />
and cumulative environmental changes that usually<br />
receive little attention in their early phases but which,<br />
over time, may cause serious crises. These include<br />
such issues as deteriorating air and water quality, soil<br />
pollution, acid rain, climate change, desertification<br />
processes (including soil erosion and land degradation),<br />
drought, ecosystems change, deforestation and forest<br />
fragmentation, loss of biodiversity and habitats,<br />
nitrogen overloading, radioactive waste, coastal<br />
erosion, pressures on living marine resources, rapid<br />
and unplanned urban growth, environment and health<br />
issues (emerging and re-emerging infectious diseases<br />
and links to environmental change), land cover/<br />
land changes, and environmental impacts of conflict,<br />
among others. Such creeping changes are often left<br />
unaddressed as policymakers choose or need to cope<br />
1
with immediate crises. Eventually, neglected creeping<br />
changes may become urgent crises that are more<br />
costly to deal with. Slow-onset threats can be classified<br />
into location— specific environmental threats, new<br />
emerging science and contemporary environmental<br />
threats (see Table 1).<br />
Note that rapid/sudden-onset hazards include geological<br />
threats such as earthquakes, volcanic eruptions, mudslides,<br />
2<br />
Type of Hazards Types of Environmental Threats<br />
1. Ongoing and rapid/sudden-onset threats Oil spills, nuclear plant failures, and chemical plant<br />
accidents; geological hazards and hydro-meteorological<br />
hazards, except for droughts.<br />
2. Slow-onset (or “creeping”) threats deteriorating air and water quality, soil pollution, acid rain, climate<br />
change, droughts, ecosystems change, loss of biodiversity and<br />
habitats, land cover/land changes, nitrogen overloading, radioactive<br />
waste, coastal erosion, etc.<br />
2.1 Location specific environmental threats Ecosystem changes, urban growth, transboundary pollutants,<br />
loss of wetlands, etc.<br />
2.2 New emerging science Associated with biofuels, nanotechnology, carbon cycle,<br />
climate change, etc.<br />
2.3 Contemporary environmental threats Electronic waste, bottled water, etc.<br />
Table 1: Types of environmental threats.<br />
Drought occuring in Switzerland dropped Lake Constance’s water levels 55 cm.<br />
and tsunamis. From a scientific point of view, geological<br />
events are the result of incremental environmental<br />
processes but it may be more effective to refer to them<br />
as quick onset. Most of the hydro-meteorological hazards<br />
(such as floods, tornadoes, storms, heat waves, etc.) may<br />
be considered rapid/sudden-onset hazards (type 1) but<br />
droughts are considered slow-onset (or “creeping”) hazards<br />
(type 2).<br />
Kecko/Flickr.com
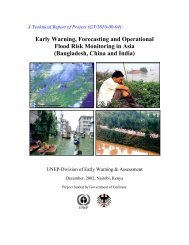
Figure 1: How early is early warning? (Golnaraghi 2005). The graph shows the timeliness of early warning systems for hydro-meteorological hazards<br />
and the area of impact (by specifying the diameter of the spherical area) for climatic hazards.<br />
Rapid/sudden-onset and slow-onset events will provide<br />
different amounts of available warning time.<br />
Figure 1 shows warning times for climatic hazards.<br />
<strong>Early</strong> <strong>Warning</strong> systems may provide seconds of available<br />
warning time for earthquakes to months of warning for<br />
droughts, which are the quickest and slowest onset hazards,<br />
respectively. Specifically, early warning systems provide<br />
tens of seconds of warning for earthquakes, days to hours<br />
for volcanic eruptions, and hours for tsunamis. Tornado<br />
warnings provide minutes of lead-time for response.<br />
Hurricane warning time varies from weeks to hours. The<br />
warning time provided by warning systems, increases to<br />
years or even decades of lead-time available for slow-onset<br />
threats (such as El Niño, global warming etc., as shown in<br />
Figure 1). Drought warning time is in the range of months<br />
to weeks.<br />
Slow-onset (or creeping) changes may cause serious<br />
problems to environment and society, if preventive<br />
measures are not taken when needed. Such creeping<br />
environmental changes require effective early warning<br />
technologies due to the high potential impact of<br />
incremental cumulative changes on society<br />
and the environment.<br />
1.3 <strong>Early</strong> warning systems:<br />
operational aspects<br />
<strong>Early</strong> warning systems help to reduce economic losses<br />
and mitigate the number of injuries or deaths from a<br />
disaster, by providing information that allows individuals<br />
and communities to protect their lives and property. <strong>Early</strong><br />
warning information empowers people to take action<br />
prior to a disaster. If well integrated with risk assessment<br />
studies and communication and action plans, early warning<br />
systems can lead to substantive benefits.<br />
Effective early warning systems embrace the following<br />
aspects: risk analysis; monitoring and predicting location<br />
and intensity of the disaster; communicating alerts<br />
to authorities and to those potentially affected; and<br />
responding to the disaster. The early warning system has to<br />
address all aspects.<br />
Monitoring and predicting is only one part of the early<br />
warning process. This step provides the input information<br />
for the early warning process that needs to be disseminated<br />
to those whose responsibility is to respond (Figure 2). <strong>Early</strong><br />
warnings may be disseminated to targeted users (local<br />
early warning applications) or broadly to communities,<br />
3
Figure 2: <strong>Early</strong> <strong>Warning</strong> System operational aspects.<br />
regions or to media (regional or global early warning<br />
applications). This information gives the possibility of taking<br />
action to initiate mitigation or security measures before a<br />
catastrophic event occurs. When monitoring and predicting<br />
systems are associated with communication systems and<br />
response plans, they are considered early warning systems<br />
(Glantz 2003). Commonly, however, early warning systems<br />
lack one or more elements. In fact, a review of existing early<br />
warning systems shows that in most cases communication<br />
systems and adequate response plans are missing.<br />
To be effective, warnings also must be timely so as to<br />
provide enough lead-time for responding; reliable, so<br />
that those responsible for responding to the warning will<br />
feel confident in taking action; and simple, so as to be<br />
understood. Timeliness often conflicts with the desire to<br />
have reliable predictions, which become more accurate<br />
as more observations are collected from the monitoring<br />
system (Grasso 2006). Thus, there is an inevitable trade-off<br />
between the amount of warning time available and the<br />
reliability of the predictions provided by the EWS. An initial<br />
alert signal may be sent to give the maximum amount of<br />
warning time when a minimum level of prediction accuracy<br />
has been reached. However, the prediction accuracy for<br />
the location and size of the event will continue to improve<br />
as more data are collected by the monitoring system part<br />
of the EWS network. It must be understood that every<br />
prediction, by its very nature, is associated with uncertainty.<br />
Because of the uncertainties associated with the predicted<br />
parameters that characterize the incoming disaster, it is<br />
possible that a wrong decision may be made. Two kinds of<br />
wrong decisions may occur (Grasso 2006): Missed Alarm<br />
(or False Negative), when the mitigation action is not taken<br />
when it should have been or False Alarm (or False Positive),<br />
when the mitigation action is taken when it should not<br />
have been.<br />
4<br />
Finally, the message should communicate the level of<br />
uncertainty and expected cost of taking action but also be<br />
stated in simple language so as to be understood by those<br />
who receive it. Most often, there is a communication gap<br />
between EW specialists who use technical and engineering<br />
language and the EWS users, who are generally outside of<br />
the scientific community. To avoid this, these early warnings<br />
need to be reported concisely, in layman’s terms and<br />
without scientific jargon.<br />
1.4 Communication of<br />
early warning information<br />
An effective early warning system needs an effective<br />
communication system. <strong>Early</strong> warning communication<br />
systems have two main components (EWCII 2003):<br />
• communication infrastructure hardware that must be<br />
reliable and robust, especially during the disaster; and<br />
• appropriate and effective interactions among the<br />
main actors of the early warning process, such as the<br />
scientific community, stakeholders, decision makers,<br />
the public, and the media.<br />
Redundancy of communication systems is essential for<br />
disaster management, while emergency power supplies<br />
and back-up systems are critical in order to avoid the<br />
collapse of communication systems after disasters occur.<br />
In addition, to ensure the communication systems operate<br />
reliably and effectively during and after a disaster occurs,<br />
and to avoid network congestion, frequencies and<br />
channels must be reserved and dedicated to disaster<br />
relief operations.<br />
Many communication tools are currently available for<br />
warning dissemination, such as Short Message Service<br />
(SMS) (cellular phone text messaging), email, radio,<br />
TV and web service. Information and communication<br />
technology (ICT) is a key element in early warning, which<br />
plays an important role in disaster communication and<br />
disseminating information to organizations in charge of<br />
responding to warnings and to the public during and after a<br />
disaster (Tubtiang 2005).<br />
Today, the decentralization of information and data<br />
through the World Wide Web makes it possible for millions<br />
of people worldwide to have easy, instantaneous access to<br />
a vast amount of diverse online information. This powerful<br />
communication medium has spread rapidly to interconnect<br />
our world, enabling near-real-time communication and<br />
data exchanges worldwide. According to the Internet World<br />
Stats database, as of December 2011, global documented<br />
Internet usage was 2.3 billion people. Thus, the Internet<br />
has become an important medium to access and deliver<br />
information worldwide in a very timely fashion.<br />
In addition, remote sensing satellites now provide a<br />
continuous stream of data. They are capable of rapidly
EWS: Decision making procedure<br />
based on cost-benefit analysis<br />
To improve the performance of EWS, a performancebased<br />
decision making procedure needs to be based on<br />
the expected consequences of taking action, in terms of<br />
the probability of a false and missed alarm. An innovative<br />
approach sets the threshold based on the acceptable<br />
probability of false (missed) alarms, from a cost-benefit<br />
analysis (Grasso 2007).<br />
Consider the case of a EWS decision making strategy<br />
based on raising the alarm if a critical severity level, a,<br />
is predicted to be exceeded at a site. The decision of<br />
whether to activate the alarm or not is based on the<br />
predicted severity of the event.<br />
A decision model that takes into account the<br />
uncertainty of the prediction and the consequences of<br />
taking action will be capable of controlling and reducing<br />
the incidence of false and missed alerts. The proposed<br />
decision making procedure intends to fill this gap. The<br />
EWS will provide the user with a real-time prediction of<br />
the severity of the event, and its error, . During<br />
the course of the event, the increase in available data<br />
will improve prediction accuracy. The prediction and its<br />
uncertainty are updated as more data come in. The actual<br />
severity of the event, , is unknown and may be defined<br />
by adding the prediction error to the predicted value, .<br />
The potential probability of false (missed) alarm is<br />
given by the probability of being less (greater) than the<br />
critical threshold; it becomes an actual probability of false<br />
(missed) alarm if the alarm is (not) raised:<br />
Referring to the principle of maximum entropy (Jaynes<br />
2003), the prediction error is modeled by Gaussian<br />
distribution, representing the most uninformative<br />
distribution possible due to lack of information. Hence, at<br />
and effectively detecting hazards, such as transboundary<br />
air pollutants, wildfires, deforestation, changes in water<br />
levels, and natural hazards. With rapid advances in data<br />
collection, analysis, visualization and dissemination,<br />
including technologies such as remote sensing,<br />
Geographical Information <strong>Systems</strong> (GIS), web mapping,<br />
sensor webs, telecommunications and ever-growing<br />
Internet connectivity, it is now feasible to deliver relevant<br />
information on a regular basis to a worldwide audience<br />
relatively inexpensively. In recent years, commercial<br />
companies such as Google, Yahoo, and Microsoft have<br />
started incorporating maps and satellite imagery into their<br />
(1)<br />
(2)<br />
time t, the actual severity of the event, , may be modeled<br />
with a Gaussian distribution, having a mean equal to the<br />
prediction and uncertainty equal to , which is<br />
the standard deviation of the prediction error . Eq.<br />
(1) and (2) may be written as follows (Grasso and<br />
others 2007):<br />
where represents the Gaussian cumulative distribution<br />
function. The tolerable level at which mitigation action<br />
should be taken can be determined from a cost-benefit<br />
analysis by minimizing the cost of taking action:<br />
where Csave are the savings due to mitigation actions and<br />
Cf a is the cost of false alert. Note that the tolerable levels<br />
and sum up to one, which directly exhibits the tradeoff<br />
between the tolerable threshold probabilities for false<br />
and missed alarms. The methodology offers an effective<br />
approach for decision making under uncertainty, focusing<br />
on user requirements in terms of reliability and cost of<br />
action.<br />
products and services, delivering compelling visual images<br />
and providing easy tools that everyone can use to add to<br />
their geographic knowledge.<br />
Information is now available in a near-real-time mode<br />
from a variety of sources at global and local levels. In<br />
the coming years, the multi-scaled global information<br />
network will greatly improve thanks to new technological<br />
advances that facilitate the global distribution of data and<br />
information at all levels.<br />
Globalization and rapid communication provides an<br />
unprecedented opportunity to catalyze effective action<br />
(3)<br />
(4)<br />
(5)<br />
5
at every level by rapidly providing authorities and the<br />
general public with high-quality and scientifically credible<br />
information in a timely fashion.<br />
The dissemination of warnings often follows a cascade<br />
process, which starts at the international or national<br />
level and then moves outwards or downwards in scale to<br />
regional and community levels (Twigg 2003). <strong>Early</strong> warnings<br />
may activate other early warnings at different authoritative<br />
levels, flowing down in responsibility roles, although all are<br />
equally necessary for effective early warning.<br />
Standard protocols play a fundamental role in addressing<br />
the challenge of effective coordination and data exchange<br />
among the actors in the early warning process and it aids in<br />
the process for warning communication and dissemination.<br />
The Common Alerting Protocol (CAP), Really Simple<br />
Syndication (RSS) and Extensible Markup Language (XML)<br />
are examples of standard data interchange formats for<br />
structured information that can be applied to warning<br />
messages for a broad range of information management<br />
and warning dissemination systems.<br />
The advantage of standard format alerts is that they are<br />
compatible with all information systems, warning systems,<br />
media, and most importantly, with new technologies such<br />
as web services. CAP, for example, defines a single standard<br />
message format for all hazards, which can activate multiple<br />
warning systems at the same time and with a single<br />
input. This guarantees consistency of warning messages<br />
and would easily replace specific application-oriented<br />
messages with a single multi-hazard message format. CAP is<br />
6<br />
Using new technology to track up-to-date environmental change.<br />
compatible with all types of information systems and public<br />
alerting systems (including broadcast radio and television),<br />
public and private data networks, multi-lingual warning<br />
systems and emerging technologies such as Internet Web<br />
services and existing systems such as the U.S. National<br />
Emergency Alert System and the National Oceanic and<br />
Atmospheric Organization (NOAA) Weather Radio. CAP<br />
uses Extensible Markup Language (XML), which contains<br />
information about the alert message, the specific hazard<br />
event, and appropriate responses, including the urgency<br />
of action to be taken, severity of the event, and certainty of<br />
the information.<br />
1.5 <strong>Early</strong> warning systems and policy<br />
For early warning systems to be effective, it is essential<br />
that they be integrated into policies for disaster mitigation.<br />
Good governance priorities include protecting the public<br />
from disasters through the implementation of disaster<br />
risk reduction policies. It is clear that natural phenomena<br />
cannot be prevented, but their human, socio-economic<br />
and environmental impacts can and should be minimized<br />
through appropriate measures, including risk and<br />
vulnerability reduction strategies, early warning, and<br />
appropriate action plans. Most often, these problems are<br />
given attention during or immediately after a disaster.<br />
Disaster risk reduction measures require long term plans<br />
and early warning should be seen as a strategy to effectively<br />
reduce the growing vulnerability of communities<br />
and assets.<br />
NASA/Flickr.com
The information provided by early warning systems<br />
enables authorities and institutions at various levels<br />
to immediately and effectively respond to a disaster. It<br />
is crucial that local government, local institutions, and<br />
communities be involved in the entire policy-making<br />
process, so they are fully aware and prepared to respond<br />
with short and long-term action plans.<br />
The early warning process, as previously described, is<br />
composed of 4 main stages: risk assessment, monitoring<br />
and predicting, disseminating and communicating<br />
warnings, and response. Within this framework, the first<br />
phase, when short- and long-term actions plans are<br />
laid out based on risk assessment analysis, is the realm<br />
of institutional and political actors. Then EW acquires a<br />
technical dimension in the monitoring and predicting<br />
phase, while in the communication phase, EW involves<br />
both technical and institutional responsibility. The response<br />
phase then involves many more sectors, such as national<br />
and local institutions, non-governmental organizations,<br />
communities, and individuals.<br />
Below is a summary of recommendations for effective<br />
decision-making within the early warning process (Sarevitz<br />
and others 2000):<br />
Prediction is insufficient for effective decisionmaking.<br />
Prediction efforts by the scientific community<br />
alone are insufficient for decision-making. The scientific<br />
community and policy-makers should outline the strategy<br />
for effective and timely decision-making by indicating what<br />
information is needed by decision-makers, how predictions<br />
will be used, how reliable the prediction must be to<br />
produce an effective response, and how to communicate<br />
this information and the tolerable prediction uncertainty<br />
so that the information can be received and understood<br />
by authorities and public. A miscommunicated or misused<br />
prediction can result in costs to society. Prediction,<br />
communication, and use of the information are necessary<br />
factors in effective decision-making within the early<br />
warning process.<br />
Develop effective communication strategies.<br />
Wishing not to appear ‘alarmist’ or to avoid criticism, local<br />
and national governments have sometimes kept the<br />
public in the dark when receiving technical information<br />
regarding imminent threats. The lack of clear and easyto-use<br />
information can sometimes confuse people and<br />
undermine their confidence in public officials. Conversely,<br />
there are quite a few cases where the public may have<br />
refused to respond to early warnings from authorities, and<br />
have therefore exposed themselves to danger or forced<br />
governments to impose removal measures. In any case,<br />
clear and balanced information is critical, even when<br />
some level of uncertainty remains. For this reason, the<br />
information’s uncertainty level must be communicated to<br />
users together with the early warning (Grasso and<br />
others 2007).<br />
Establish proper priorities. Resources must be<br />
allocated wisely and priorities should be set, based on risk<br />
assessment, for long- and short-term decision-making,<br />
such as investing in local early warning systems, education,<br />
or enhanced monitoring and observational systems. In<br />
addition, decision-makers need to be able to set priorities<br />
for timely and effective response to a disaster when it<br />
occurs based on the information received from the early<br />
warning system. Decision-makers should receive necessary<br />
training on how to use the information received when an<br />
alert is issued and what that information means.<br />
Clarify responsibilities. Institutional networks should<br />
be developed with clear responsibilities. Complex problems<br />
such as disaster mitigation and response require multidisciplinary<br />
research, multi-sector policy and planning,<br />
multi-stakeholder participation, and networking involving<br />
all the participants of the process, such as the scientific<br />
research community (including social sciences aspects),<br />
land use planning, environment, finance, development,<br />
education, health, energy, communications, transportation,<br />
labour, and social security and national defense.<br />
Decentralization in the decision making process could lead<br />
to optimal solutions by clarifying local government and<br />
community responsibilities.<br />
Collaboration will improve efficiency, credibility,<br />
accountability, trust, and cost-effectiveness. This<br />
collaboration consists of joint research projects, sharing<br />
information, and participatory strategic planning<br />
and programming.<br />
Establish and strengthen legal frameworks.<br />
Because there are numerous actors involved in early<br />
warning response plans (such as governing authorities,<br />
municipalities, townships, and local communities), the<br />
decision-making and legal framework of responsibilities<br />
should be set up in advance in order to be prepared when<br />
a disaster occurs. Hurricane Katrina in 2005 showed gaps in<br />
the legal frameworks and definition of responsibilities that<br />
exacerbated the disaster. Such ineffective decision-making<br />
must be dealt with to avoid future disasters such as the one<br />
in New Orleans.<br />
7
8<br />
Chapter 2: The Role of Earth Observation<br />
Earth observation (EO), through measuring and monitoring,<br />
provides an insight and understanding into Earth’s complex<br />
processes and changes. EO includes measurements that<br />
can be made directly or by sensors in-situ or remotely (i.e.<br />
satellite remote sensing, aerial surveys, land or ocean-based<br />
monitoring systems, Figure 3), to provide key information<br />
to models or other tools to support decision making<br />
processes. EO assists governments and civil society to<br />
identify and shape corrective and new measures to achieve<br />
sustainable development through original, scientifically<br />
valid assessments and early warning information on<br />
the recent and potential long-term consequences of<br />
human activities on the biosphere. At a time when the<br />
world community is striving to identify the impacts of<br />
human actions on the planet’s life support system, timesequenced<br />
satellite images help to determine these<br />
impacts and provide unique, visible and scientificallyconvincing<br />
evidence that human actions are causing<br />
substantial changes to the Earth’s environment and<br />
natural resource base (i.e. ecosystems changes, urban<br />
growth, transboundary pollutants, loss of wetlands, etc).<br />
By enhancing the visualization of scientific information<br />
on environmental change, satellite imagery will enhance<br />
environmental management and raise the awareness<br />
of emerging environmental threats. EO provides the<br />
opportunity to explore, to discover, and to understand the<br />
world in which we live from the unique vantage point<br />
of space.<br />
The following section discusses the potential role of EO<br />
for each type of environmental threat.<br />
2.1 Ongoing and rapid/sudden-onset<br />
environmental threats<br />
Oil spills<br />
Earth observation is increasingly used to detect illegal<br />
marine discharges and oil spills. Infra-red (IR) video and<br />
photography from airborne platforms, thermal infrared<br />
imaging, airborne laser fluoro-sensors, airborne and satellite<br />
optical sensors, as well as airborne and satellite Synthetic<br />
Aperture Radar (SAR) are used for this purpose. SAR has<br />
Figure 3: Illustration of multiple observing systems in use on the ground, at sea, in the atmosphere and from space for monitoring and researching<br />
the climate system (WMO 2011).
the advantage of also providing data during cloud cover<br />
conditions and darkness, unlike optical sensors. In addition,<br />
optical-sensor techniques applied to oil spills detection are<br />
associated to a high number of false alarms, more often<br />
cloud shadows, sun glint, and other conditions such as<br />
precipitation, fog, and the amounts of daylight present<br />
also may be erroneously associated with oil spills. For this<br />
reason, SAR is preferred over optical sensors, especially<br />
when spills cover vast areas of the marine environment, and<br />
when the oil cannot be seen or discriminated against the<br />
background. SAR detects changes in sea-surface roughness<br />
patterns modified by oil spills. The largest shortcoming of oil<br />
spills detection using SAR images is accurate discrimination<br />
between oil spills and natural films (Brekke and Soldberg<br />
2004). To date, operational application of satellite imagery<br />
for oil spill detection still remains a challenge due to limited<br />
spatial and temporal resolution. Additionally, processing<br />
times are often too long for operational purposes, and it<br />
is still not possible to measure the thickness of the oil spill<br />
(Mansor and others 2007; U.S. Department of the Interior,<br />
Minerals Management Service 2007). Existing applications<br />
are presented in Chapter 3.<br />
Chemical and nuclear accidents<br />
Chemical and nuclear accidents may have disastrous<br />
consequences, such as the 1984 accident in Bhopal,<br />
India, which killed more than 2 000 and injured about<br />
150 000, and the 1986 explosion of the reactors of the<br />
nuclear power plant in Chernobyl, Ukraine, which was the<br />
worst such accident to date, affecting part of the Soviet<br />
Union, eastern Europe, Scandinavia, and later, western<br />
Europe. Meteorological factors such as wind speed and<br />
direction, turbulence, stability layers, humidity, cloudiness,<br />
precipitation and topographical features, influence the<br />
impact of chemical and nuclear accidents and have to<br />
be taken into account in decision models. In some cases,<br />
emergencies are localized while in others, transport<br />
processes are most important. EO provides key data for<br />
monitoring and forecasting the dispersion and spread of<br />
the substance.<br />
Geological hazards<br />
Geohazards associated with geological processes such<br />
as earthquakes, landslides, and volcanic eruptions are<br />
mainly controlled by ground deformation. EO data allows<br />
monitoring of key physical parameters associated with<br />
geohazards, such as deformation, plate movements,<br />
seismic monitoring, baseline topographic, and geoscience<br />
mapping. EO products are useful for detection and<br />
mitigation before the event, and for damage assessment<br />
during the aftermath. For geohazards, stereo optical and<br />
radar interferometry associated with ground-based Global<br />
Positioning System (GPS) and seismic networks are used.<br />
For volcanic eruptions additional parameters are observed<br />
such as temperature and gas emissions. Ground based<br />
measurements have the advantage of being continuous<br />
in time but have limited spatial extent, while satellite<br />
observations cover wide areas but are not continuous in<br />
time. These data need to be integrated for an improved<br />
and more comprehensive approach (Committee on Earth<br />
Observation Satellites (CEOS) 2002; Integrated global<br />
observing strategy (IGOS-P) 2003).<br />
Earthquakes<br />
Earthquakes are due to a sudden release of stresses<br />
accumulated around the faults in the Earth’s crust. This<br />
energy is released through seismic waves that travel from<br />
the origin zone, which cause the ground to shake. Severe<br />
earthquakes can affect buildings and populations. The level<br />
of damage depends on many factors, such as the intensity<br />
and depth of the earthquake, and the vulnerability of<br />
structures and their distance from the earthquake’s origin.<br />
For earthquakes, information on the location and<br />
magnitude of the event first needs to be conveyed to<br />
responsible authorities. This information is used by seismic<br />
early warning systems to activate security measures<br />
within seconds after the earthquake’s origin and before<br />
strong shaking occurs at the site. Shakemaps generated<br />
within five minutes provide essential information to<br />
assess the intensity of ground shaking and the damaged<br />
areas. The combination of data from seismic networks<br />
and GPS may help to increase reliability and timeliness of<br />
this information. Earthquake frequency and probability<br />
shakemaps based on historical seismicity and base maps<br />
(geological, soil type, active faults, hydrological, DEMs),<br />
assist in the earthquake mitigation phase and need to be<br />
included in the building code design process for improved<br />
land use and building practices. For responses, additional<br />
data are needed, such as seismicity, intensity, strain,<br />
DEMs, soil type, moisture conditions, infrastructure and<br />
population, to produce post-event damage maps. Thermal<br />
information needs to continuously be monitored. This is<br />
obtained from low/medium resolution IR imagery from<br />
polar and geostationary satellites for thermal background<br />
characterization (Advanced Very High Resolution<br />
Radiometer (AVHRR), ATSR, MODIS and GOES) together<br />
with deformation from EDM and/or GPS network; borehole<br />
strainmeters; and SAR interferometry.<br />
Landslides<br />
Landslides are displacements of earth, rock, and debris<br />
caused by heavy rains, floods, earthquakes, volcanoes,<br />
and wildfires. Useful information for landslides and<br />
ground instability include the following: hazard zonation<br />
maps (landslides, debris flows, rockfalls, subsidence, and<br />
ground instability scenarios) during the mitigation phase,<br />
associated with landlside inventories, DEM, deformation<br />
(GPS network; SAR interferometry; other surveys such as<br />
leveling, laser scanning, aerial, etc), hydrology, geology, soil,<br />
geophysical, geotechnical, climatic, seismic zonation maps,<br />
9
10<br />
land cover, land use, and historical archives. Forecasting<br />
the location and extent of ground instability or landslides<br />
is quite challenging. Landslides can be preceded by cracks,<br />
accelerating movement, and rock fall activity. Real-time<br />
monitoring of key parameters thus becomes essential.<br />
The observed acceleration, deformation or displacement,<br />
exceeding a theoretical pre-fixed threshold is the trigger for<br />
issuing an alert signal. An alternative approach is based on<br />
hydrologic forecasting. It should be said that for large areas<br />
site-specific monitoring is not feasible. In this case, hazard<br />
mapping associated with monitoring of high risk zones<br />
remains the best option for warning. Local rapid mapping of<br />
affected areas, updated scenarios and real-time monitoring<br />
(deformation, seismic data, and weather forecasts) assist<br />
during the response phase.<br />
Tsunami<br />
A tsunami is a series of ocean waves generated by sudden<br />
displacements in the sea floor, landslides, or volcanic<br />
activity. Although a tsunami cannot be prevented, the<br />
impact of a tsunami can be mitigated through community<br />
preparedness, timely warnings, and effective response.<br />
Observations of seismic activity, sea floor bathymetry,<br />
topography, sea level data (Tide Gauge observations of sea<br />
height; Real-time Tsunami <strong>Warning</strong> Buoy Data; Deep Ocean<br />
Assessment and Reporting of Tsunamis (DART) buoys and<br />
sea-level variations from the TOPEX/Poseidon and Jason,<br />
the European Space Agency’s Envisat, and the U.S. Navy’s<br />
Geosat Follow-On), are used in combination with tsunami<br />
models to create inundation and evacuation maps and to<br />
issue tsunami watches and warnings.<br />
Volcanic eruptions<br />
Volcanic eruptions may be mild, releasing steam and gases<br />
or lava flows, or they can be violent explosions that release<br />
ashes and gases into the atmosphere. Volcanic eruptions<br />
can destroy land and communities living in their path, affect<br />
air quality, and even influence the Earth’s climate. Volcanic<br />
ash can impact aviation and communications.<br />
Data needs for volcanic eruptions include hazard<br />
zonation maps, real-time seismic, deformation (Electronic<br />
Distance Measurement (EDM) and/or GPS network;<br />
leveling and tilt networks; borehole strainmeters; gravity<br />
surveys; SAR interferometry), thermal (Landsat, ASTER,<br />
Geostationary operational environmental satellites (GOES),<br />
MODIS); air borne IR cameras; medium-high resolution heat<br />
flux imagery and gas emissions (COSPEC, LICOR surveys);<br />
Satellite imagery (i.e., ASTER) and digital elevation maps<br />
(DEM). As soon as the volcanic unrest initiates, information<br />
needs to be timely and relatively high-resolution. Once<br />
the eruption starts, the flow of information has to speed<br />
up. Seismic behaviour and deformation patterns need to<br />
be observed throughout the eruption especially to detect<br />
a change of eruption site (3-6 seismometers ideally with<br />
3-directional sensors; a regional network).<br />
Hydro-meteorological hazards<br />
Hydro-meteorological hazards include the wide variety of<br />
meteorological, hydrological and climate phenomena that<br />
can pose a threat to life, property and the environment.<br />
These types of hazards are monitored using the<br />
meteorological, or weather, satellite programs, beginning in<br />
the early 1960s. In the United States, NASA, NOAA, and the<br />
Department of Defense (DoD) have all been involved with<br />
developing and operating weather satellites. In Europe, ESA<br />
and EUMETSAT (European Organisation for the Exploitation<br />
of Meteorological Satellites) operate the meteorological<br />
satellite system (U.S. Centennial of Flight Commission).<br />
Data from geostationary satellite and polar microwave<br />
derived products (GOES) and polar orbiters (microwave data<br />
from the Defense Meteorological Satellite Program (DMSP),<br />
Special Sensor Microwave/Imager (SSM/I), NOAA/Advanced<br />
Microwave Sounding Unit (AMSU), and Tropical Rainfall<br />
Measuring Mission (TRMM)) are key in weather analysis<br />
and forecasting. GOES has the capability of observing<br />
the atmosphere and its cloud cover from the global scale<br />
down to the storm scale, frequently and at high resolution.<br />
Microwave data are available on only an intermittent<br />
basis, but are strongly related to cloud and atmospheric<br />
properties. The combination of GOES and Polar Orbiting<br />
Environmental Satellites (POES) is key for monitoring<br />
meteorological processes from the global scale to the<br />
synoptic scale to the mesoscale and finally to the storm<br />
scale. (Scofield and others 2002). GOES and POES weather<br />
satellites provide useful information on precipitation,<br />
moisture, temperature, winds and soil wetness, which is<br />
combined with ground observation.<br />
Floods<br />
Floods are often triggered by severe storms, tropical<br />
cyclones, and tornadoes. The number of floods has<br />
continued to rise steadily; together with droughts, they<br />
have become the most deadly disasters over the past<br />
decades. The increase in losses from floods is also due to<br />
climate variability, which has caused increased precipitation<br />
in parts of the Northern Hemisphere (Natural Hazards<br />
Working Group 2005). Floods can be deadly, particularly<br />
when they arrive without warning.<br />
In particular, polar orbital and geostationary satellite<br />
data are used for flood observation. Polar orbital satellites<br />
include optical low (AVHRR), medium (Landsat, SPOT, IRS)<br />
and high resolution (IKONOS) and microwave sensors (high<br />
(SAR-RADARSAT, JERS and ERS) and low resolution passive<br />
sensors (SSMI). Meteorological satellites include GOES 8<br />
and 10, METEOSAT, GMS, the Indian INSAT and the Russian<br />
GOMS; and polar orbitals suchh as NOAA (NOAA 15)<br />
and SSMI.<br />
For storms, additional parameters are monitored, such as<br />
sea surface temperature, air humidity, surface wind speed,<br />
rain estimates (from DMSP/SSMI, TRMM, ERS, QuikScat,
AVHRR, RADARSAT). TRMM offers unique opportunities<br />
to examine tropical cyclones. With TRMM, scientists are<br />
able to make extremely precise radar measurements of<br />
tropical storms over the oceans and identify their intensity<br />
variations, providing invaluable insights into the dynamics<br />
of tropical storms and rainfall.<br />
Epidemics<br />
Epidemics such as malaria and meningitis are linked to<br />
environmental factors. Satellite data can provide<br />
essential information on these factors and help to better<br />
understand diseases.<br />
As an example, the ESA Epidemio project, launched in<br />
2004, utilizes data from ESA’s Envisat or the French Space<br />
Agency’s Spot, and field data to gather information on the<br />
spread of epidemics, helping to better prepare for epidemic<br />
outbreaks. GEO, with WHO and other partners, are working<br />
together on the Meningitis Environmental Risk Information<br />
Technologies (MERIT) project to better understand the<br />
relationship between meningitis and environmental factors<br />
using remote sensing.<br />
Wildfires<br />
Wildfires pose a threat to lives and properties and are often<br />
connected to secondary effects such as landslides, erosion,<br />
and changes in water quality. Wildfires may be natural<br />
processes, human induced for agriculture purposes, or just<br />
the result of human negligence.<br />
Wildfire detection using satellite technologies is possible<br />
thanks to significant temperature difference between the<br />
Earth’s surface (usually not exceeding 10-25ºC) and the<br />
heat of fire (300-900ºC), which results in a thousand times<br />
difference in heat radiation generated by these objects.<br />
NOAA (AVHRR radiometer with 1 100m spatial resolution<br />
and 3 000 km swath width) and Earth Observing Satellites<br />
(EOS) (Terra and Aqua satellites with MODIS radiometer<br />
installed on them with 250, 500 and 1 000 m spatial<br />
resolution and 2 330 km swath width) are the most widely<br />
used modern satellites for operative fire monitoring (Klaver<br />
and others 1998). High-resolution sensors, such as the<br />
Landsat Thematic Mapper, SPOT multispectral scanner, or<br />
National Oceanic and Atmospheric Administration’s AVHRR<br />
or MODIS, are used for fire potential definition. Sensors used<br />
for fire detection and monitoring include AVHRR, which<br />
has a thermal sensor and daily overflights, the Defense<br />
Meteorological Satellite Program’s Optical Linescan System<br />
(OLS) sensor, which has daily overflights and operationally<br />
collects visible images during its nighttime pass, and the<br />
MODIS Land Rapid Response system. AVHRR and higher<br />
resolution images (SPOT, Landsat, and radar) can be used to<br />
assess the extent and impact of the fire.<br />
2.2 Slow-onset (or “creeping”)<br />
environmental threats<br />
Air quality<br />
Smog is the product of human and natural activities, such<br />
as industry, transportation, wildfires, volcanic eruptions,<br />
etc. and can have serious effects on human health and<br />
the environment.<br />
A variety of EO tools are available to monitor air quality.<br />
The National Aeronautics and Space Administration<br />
(NASA) and the European Space Agency (ESA) both have<br />
instruments to monitor air quality. The Canadian MOPITT<br />
(Measurements of Pollution in the Troposphere) aboard the<br />
Terra satellite monitors the lower atmosphere to observe<br />
how it interacts with the land and ocean biospheres,<br />
distribution, transport, sources, and sinks of carbon<br />
monoxide and methane in the troposphere. The Total<br />
Ozone Mapping Spectrometer (TOMS) instrument measures<br />
the total amount of ozone in a column of atmosphere as<br />
well as cloud cover over the entire globe. Additionally,<br />
TOMS measures the amount of solar radiation escaping<br />
from the top of the atmosphere to accurately estimate the<br />
amount of ultraviolet radiation that reaches the Earth’s<br />
surface. The Ozone Monitoring Instrument (OMI) on Aura<br />
will continue the TOMS record for total ozone and other<br />
atmospheric parameters related to ozone chemistry and<br />
climate. The OMI instrument distinguishes between aerosol<br />
types, such as smoke, dust, and sulphates, and can measure<br />
cloud pressure and coverage. ESA’s SCHIAMACHY (Scanning<br />
Imaging Absorption Spectro-Meter for Atmospheric<br />
ChartographY) maps atmosphere over a very wide<br />
wavelength range (240 to 2 380 nm), which allows detection<br />
of trace gases, ozone and related gases, clouds and dust<br />
particles throughout the atmosphere (Athena Global 2005).<br />
The Moderate Resolution Imaging Spectroradiometer<br />
(MODIS) sensor measures the relative amount of aerosols<br />
and the relative size of aerosol particles—solid or liquid<br />
particles suspended in the atmosphere. Examples of such<br />
aerosols include dust, sea salts, volcanic ash, and smoke. The<br />
MODIS aerosol optical depth product is a measure of how<br />
much light airborne particles prevent from passing through<br />
a column of atmosphere. New technologies are also being<br />
explored for monitoring air quality, such as mobile phones<br />
equipped with simple sensors to empower citizens to<br />
collect and share real-time air quality measurements. This<br />
technology is being developed by a consortium called<br />
Urban Atmospheres.<br />
Water quality<br />
The traditional methods of monitoring coastal water quality<br />
require scientists to use boats to gather water samples,<br />
typically on a monthly basis because of the high costs<br />
11
12<br />
of these surveys. This method captures episodic events<br />
affecting water quality, such as the seasonal freshwater<br />
runoff, but is not able to monitor and detect fast changes.<br />
Satellite data provide measures of key indicators of water<br />
quality —turbidity and water clarity—to help monitor fast<br />
changes in factors that affect water quality, such as winds,<br />
tides and human influences including pollution and runoff.<br />
GeoEYE’s Sea-viewing Wide Field-of-view Sensor (SeaWiFS)<br />
instrument, launched aboard the OrbView-2 satellite in<br />
1997, collects ocean colour data used to determine factors<br />
affecting global change, particularly ocean ecology and<br />
chemistry. MODIS sensor, launched aboard the Aqua<br />
satellite in 2002, together with its counterpart instrument<br />
aboard the Terra satellite, collects measurements from the<br />
entire Earth surface every one to two days and can also<br />
provide measurements of turbidity (Hansen 2007). Overall,<br />
air and water quality monitoring coverage still appears to<br />
be irregular and adequate and available in real-time only for<br />
some contaminants (GEO 2005).<br />
Droughts, desertification and food security<br />
Droughts<br />
NOAA’s National Weather Service (NWS) defines a drought<br />
as “a period of abnormally dry weather sufficiently<br />
prolonged for the lack of water to cause serious hydrologic<br />
imbalance in the affected area.”<br />
Drought can be classified by using 4 different definitions:<br />
meteorological (deviation from normal precipitation);<br />
agricultural (abnormal soil moisture conditions);<br />
hydrological (related to abnormal water resources); and<br />
socioeconomic (when water shortage impacts people’s lives<br />
and economies).<br />
A comprehensive and integrated approach is required<br />
to monitor droughts, due to the complex nature of the<br />
problem. Although all types of droughts originate from a<br />
precipitation deficiency, it is insufficient to monitor solely<br />
this parameter to assess severity and resultant impacts<br />
(World Meteorological Organization 2006). Effective<br />
drought early warning systems must integrate precipitation<br />
and other climatic parameters with water information such<br />
as streamflow, snow pack, groundwater levels, reservoir<br />
and lake levels, and soil moisture, into a comprehensive<br />
assessment of current and future drought and water supply<br />
conditions (Svoboda and others 2002). In particular, there<br />
are 6 key parameters that are used in a composite product<br />
developed from a rich information stream, including climate<br />
indices, numerical models, and the input of regional and<br />
local experts.<br />
These are:<br />
1) Palmer Drought Severity Index (based on<br />
precipitation data, temperature data, division<br />
constants (water capacity of the soil, etc.) and<br />
previous history of the indices),<br />
2) Soil Moisture Model Percentile (calculated<br />
through a hydrological model that takes observed<br />
precipitation and temperature and calculates soil<br />
moisture, evaporation and runoff. The potential<br />
evaporation is estimated from<br />
observed temperature),<br />
3) Daily stream flow percentiles,<br />
4) Percent of normal precipitation,<br />
5) Standardized precipitation index, and<br />
6) Remotely sensed vegetation health index.<br />
Additional indicators may include the Palmer Crop<br />
Moisture Index, Keetch-Byram Drought Index, Fire Danger<br />
Index, evaporation-related observations such as relative<br />
humidity and temperature departure from normal, reservoir<br />
and lake levels, groundwater levels, field observations of<br />
surface soil moisture, and snowpack observations. Some<br />
of these indices and indicators are computed for point<br />
locations, and others are computed for climate divisions,<br />
drainage (hydrological) basins, or other geographical<br />
regions (Svoboda and others 2002). A complete list of<br />
drought products can be found on NOAA’s National<br />
Environmental Satellite, Data, & Information Service (NOAA-<br />
NESDIS) web page.<br />
Desertification<br />
Desertification refers to the degradation of land in arid,<br />
semi-arid, and dry sub-humid areas due to climatic<br />
variations or human activity. Desertification can occur due<br />
to inappropriate land use, overgrazing, deforestation, and<br />
over-exploitation. Land degradation affects many countries<br />
worldwide and has its greatest impact in Africa.<br />
In spite of the potential benefits of EO information,<br />
the lack of awareness of the value and availability of<br />
information, inadequate institutional resources and<br />
financial problems are the most frequent challenges to<br />
overcome in detecting desertification (Sarmap and others<br />
2003). In 2004, through a project called DesertWatch, ESA<br />
has developed a set of indicators based principally on land<br />
surface parameters retrieved from satellite observations<br />
for monitoring land degradation and desertification.<br />
DesertWatch is being tested and applied in Mozambique,<br />
Portugal, and Brazil.<br />
Food security<br />
Food security was defined at the 1996 World Food Summit<br />
as existing “when all people at all times have access to<br />
sufficient, safe, nutritious food to maintain a healthy and<br />
active life”. The concept of food security includes both<br />
physical and economic access to food meeting people’s<br />
needs and preferences. There are currently four systems for<br />
global agricultural monitoring, all using EO data:<br />
• The USDA Foreign Agricultural Service’s<br />
Crop Explorer.
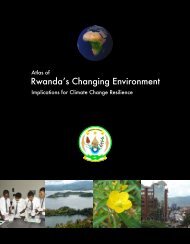
After a crash in the price of tobacco, Malawian farmers have opted for crop diversification as a path to food security. Shot on farm estates in Chiradzulu district.<br />
• The European Commission’s Monitoring of<br />
Agriculture with Remote Sensing.<br />
• CropWatch, developed by the Chinese Academy of<br />
Sciences’ Institute for Remote Sensing Applications.<br />
• The U.N. Food and Agriculture Organization’s Global<br />
Information and <strong>Early</strong> <strong>Warning</strong> System (GIEWS).<br />
These provide information on food availability, market<br />
prices and livelihoods.<br />
Impact of climate variability<br />
The observations of climate-related variables on a global<br />
scale have made it possible to document and analyze<br />
the behaviour of Earth’s climate, made available through<br />
programs such as: the IOC-WMO-<strong>UNEP</strong>-ICSU Global Ocean<br />
Observing System (GOOS); the FAO-WMO-UNESCO-<strong>UNEP</strong>-<br />
ICSU Global Terrestrial Observing System (GTOS); the WMO<br />
Global Observing System (GOS) and Global Atmosphere<br />
Watch (GAW); the research observing systems and<br />
observing systems research of the WMO-IOC-ICSU World<br />
Climate Research Programme (WCRP) and other climaterelevant<br />
international programs; and WMO-UNESCO-ICSU-<br />
IOC-<strong>UNEP</strong> Global Climate Observing System (GCOS).<br />
The Intergovernmental Panel on Climate Change (IPCC)<br />
periodically reviews and assesses the most recent scientific,<br />
technical and socio-economic information produced<br />
worldwide relevant to the understanding of climate<br />
change. Hundreds of scientists worldwide contribute to the<br />
preparation and review of these reports.<br />
According to the recent IPCC report, the atmospheric<br />
buildup of greenhouse gases is already shaping the earth’s<br />
climate and ecosystems from the poles to the tropics, which<br />
face inevitable, possibly profound, alteration. The IPCC has<br />
predicted widening droughts in southern Europe and the<br />
Middle East, sub-Saharan Africa, the American Southwest<br />
and Mexico, and flooding that could imperil low-lying<br />
islands and the crowded river deltas of southern Asia. It<br />
stressed that many of the regions facing the greatest risks<br />
are among the world’s poorest. Information about the<br />
impacts of climate variability is needed by communities<br />
and resource managers to adapt and prepare for larger<br />
fluctuations as global climate change becomes more<br />
evident. This information includes evidence of changes<br />
occurring due to climate variability, such as loss of<br />
ecosystems, ice melting, coastal degradation, and<br />
severe droughts. Such information will provide<br />
policy-makers scientifically valid assessment and early<br />
warning information on the current and potential<br />
long-term consequences of human activities on<br />
the environment.<br />
Location-specific environmental changes<br />
(i.e., ecosystem changes, loss of biodiversity and habitats, land<br />
cover/land changes, coastal erosion, urban growth, etc.)<br />
Landsat satellites (series 1 to 7) are extensively used to<br />
monitor location-specific environmental changes. They<br />
have the great advantage of providing repetitive, synoptic,<br />
global coverage of high-resolution multi-spectral imagery<br />
(Fadhil 2007). Landsat can be used for change detection<br />
applications to identify differences in the state of an object<br />
or phenomenon by comparing the satellite imagery<br />
at different times. Change detection is key in natural<br />
resources management (Singh 1989). Central to this theme<br />
is the characterization, monitoring and understanding of<br />
land cover and land use change, since they have a major<br />
impact on sustainable land use, biodiversity, conservation,<br />
biogeochemical cycles, as well as land-atmosphere<br />
interactions affecting climate and they are indicators of<br />
climate change, especially at a regional level (IGOS-P 2004).<br />
The United Nations Environment Programme’s (<strong>UNEP</strong>)<br />
bestselling publication One Planet, Many People: Atlas of<br />
Our Changing Environment (<strong>UNEP</strong> 2006), which shows<br />
before and after satellite photos to document changes<br />
to the Earth’s surface over the past 30 years, proves the<br />
importance and impact of visual evidence of environmental<br />
change in hotspots. The Atlas contains some remarkable<br />
Landsat satellite imagery and illustrates the alarming rate of<br />
environmental destruction. Through the innovative use of<br />
some 271 satellite images, 215 ground photos and 66 maps,<br />
the Atlas provides visual proof of global environmental<br />
changes—both positive and negative—resulting from<br />
natural processes and human activities. Case studies include<br />
themes such as atmosphere, coastal areas, waters, forests,<br />
croplands, grasslands, urban areas, and tundra and Polar<br />
Regions. The Atlas demonstrates how our growing numbers<br />
and our consumption patterns are shrinking our natural<br />
resource base.<br />
Travis Lupick/Flickr.com<br />
13
Chapter 3: Inventory of <strong>Early</strong> <strong>Warning</strong> <strong>Systems</strong><br />
The aim of this report is to identify current gaps and future<br />
needs of early warning systems through the analysis of the<br />
state of the art of existing early warning and monitoring<br />
systems for environmental hazards. Among existing early<br />
warning/monitoring systems, only systems that provide<br />
publicly accessible information and products have been<br />
included in the analysis. For the present study, several<br />
sources have been used, such as the Global Survey of<br />
<strong>Early</strong> <strong>Warning</strong> <strong>Systems</strong> (UN 2006) together with the online<br />
inventory of early warning systems on ISDR’s Platform<br />
for the Promotion of <strong>Early</strong> <strong>Warning</strong> (PPEW) website, and<br />
several additional online sources, technical reports and<br />
scientific articles listed in the references. For each hazard<br />
type, a gap analysis has been carried out to identify critical<br />
aspects and future needs of EWS, considering aspects such<br />
as geographical coverage, and essential EWS elements such<br />
as monitoring and prediction capability, communication<br />
systems and application of early warning information in<br />
responses. Below is the outcome of the review of existing<br />
early warning/monitoring systems for each hazard type.<br />
Details of all systems, organized in tables by hazard type,<br />
are listed in the Appendix. The current gaps identified<br />
for each hazard type could be related to technological,<br />
organizational, communication or geographical coverage<br />
aspects. To assess the geographical coverage of existing<br />
systems for each hazard type, the existing systems have<br />
been imposed on the hazard’s risk map. For this analysis,<br />
the maps of risks of mortality and economic loss were taken<br />
from Natural Disaster Hotspots: A Global Risk Analysis, a<br />
report from the World Bank (Dilley and others 2005).<br />
3.1 Ongoing and rapid/sudden-onset<br />
environmental threats<br />
Oil spills<br />
To detect operational oil spills, satellite overpasses and<br />
aerial surveillance flights need to be used in an integrated<br />
manner. In many countries in Northern Europe, the KSAT<br />
manual approach is currently used to identify oil spills from<br />
the satellite images. KSAT has provided this operational<br />
service since 1996, and in Europe, use of satellites for oil<br />
spill detection is well established and well integrated<br />
within the national and regional oil pollution surveillance<br />
and response chains. Operational algorithms utilizing<br />
satellite-borne C-band SAR instruments (Radarsat-1, Envisat,<br />
Radarsat-2) are also being developed for oil-spill detection<br />
in the Baltic Sea area.<br />
Chemical and nuclear accidents<br />
Releases of a hazardous substance from industrial accidents<br />
can have immediate adverse effects on human and animal<br />
14<br />
life or the environment. WMO together with IAEA provides<br />
specialized meteorological support to environmental<br />
emergency response related to nuclear accidents and<br />
radiological emergencies. The WMO network of eight<br />
specialized numerical modeling centres called Regional<br />
Specialized Meteorological Centres (RSMCs) provides<br />
predictions of the movement of contaminants in the<br />
atmosphere. The Inter-Agency Committee on the Response<br />
to Nuclear Accidents (IACRNA) of the IAEA, coordinates the<br />
international intergovernmental organizations responding<br />
to nuclear and radiological emergencies. IACRNA members<br />
are: the European Commission (EC), the European Police<br />
Office (EUROPOL), the Food and Agriculture Organization<br />
of the United Nations (FAO), IAEA, the International Civil<br />
Aviation Organization (ICAO), the International Criminal<br />
Police Organization (INTERPOL), the Nuclear Energy<br />
Agency of the Organization for Economic Co-operation<br />
and Development (OECD/NEA), the Pan American Health<br />
Organization (PAHO), <strong>UNEP</strong>, the United Nations Office for<br />
the Co-ordination of Humanitarian Affairs (UN-OCHA), the<br />
United Nations Office for Outer Space Affairs (UNOOSA),<br />
the World Health Organization (WHO), and WMO. The<br />
Agency’s goal is to provide support during incidents<br />
or emergencies by providing near real-time reporting<br />
of information through the following: the Incident and<br />
Emergency Centre (IEC), which maintains a 24 hour oncall<br />
system for rapid initial assessment, and if needed,<br />
triggers response operations; the Emergency Notification<br />
and Assistance Convention Website (ENAC) , which allows<br />
the exchange of information on nuclear accidents or<br />
radiological emergencies; and the Nuclear Event Webbased<br />
System (NEWS), which provides information on all<br />
significant events in nuclear power plants, research reactors,<br />
nuclear fuel cycle facilities and occurrences involving<br />
radiation sources or the transport of radioactive material.<br />
The Global Chemical Incident Alert and Response System<br />
of the International Programme on Chemical Safety, which<br />
is part of WHO, focuses on disease outbreaks from chemical<br />
releases and also provides technical assistance to Member<br />
States for response to chemical incidents and emergencies.<br />
Formal and informal sources are used to collect information<br />
and if necessary, additional information and verification is<br />
sought through official channels: national authorities, WHO<br />
offices, WHO Collaborating Centres, other United Nations<br />
agencies, and members of the communicable disease<br />
Global Outbreak Alert and Response Network (GOARN),<br />
Internet-based resources, particularly the Global Public<br />
Health Intelligence Network (GPHIN) and ProMED-Mail3.<br />
Based on this information, a risk assessment is carried out to<br />
determine the potential impact and if assistance needs to<br />
be offered to Member States.
Geological hazards<br />
Earthquakes<br />
Earthquake early warning systems are a relatively new<br />
approach to seismic risk reduction. They provide a rapid<br />
estimate of seismic parameters such as magnitude and<br />
location associated with a seismic event based on the<br />
first seconds of seismic data registered at the epicentre.<br />
This information can then be used to predict ground<br />
motion parameters of engineering interest including peak<br />
ground acceleration and spectral acceleration. Earthquake<br />
warning systems are currently operational in Mexico, Japan,<br />
Romania, Taiwan and Turkey (Espinosa Aranda and others<br />
1995; Wu and others 1998; Wu and Teng 2002; Odaka and<br />
others 2003; Kamigaichi 2004; Nakamura 2004; Horiuchi and<br />
others 2005). <strong>Systems</strong> are under development for seismic<br />
risk mitigation in California and Italy. Local and national<br />
scale seismic early warning systems, which provide seismic<br />
information between a few seconds and tens of seconds<br />
before shaking occurs at the target site, are used for a<br />
variety of applications such as shutting down power plants,<br />
stopping trains, evacuating buildings, closing gas valves,<br />
and alerting wide segments of the population through the<br />
TV, among others.<br />
On the global scale, multi-national initiatives, such as<br />
the U.S. Geological Survey (USGS) and GEO-FOrschungs<br />
Netz (GEOFON), operate global seismic networks for<br />
seismic monitoring but do not provide seismic early<br />
warning information. Today, the USGS in cooperation<br />
with Incorporated Research Institutions for Seismology<br />
(IRIS) operates the Global Seismic Networks (GSN), which<br />
comprises more than 100 stations providing free, realtime,<br />
open access data. GEOFON collects information from<br />
several networks and makes this information available to<br />
the public online. USGS Earthquake Notification Service<br />
(ENS) provides publicly available email notification for<br />
earthquakes worldwide within 5 minutes for earthquakes<br />
in U.S. and within 30 minutes for events worldwide. USGS<br />
also provides near-real-time maps of ground motion<br />
and shaking intensity following significant earthquakes.<br />
This product, called ShakeMap, is being used for postearthquake<br />
response and recovery, public and scientific<br />
information, as well as for preparedness exercises and<br />
disaster planning.<br />
Effective early warning technologies for earthquakes are<br />
much more challenging to develop than for other natural<br />
hazards because warning times range from only a few<br />
seconds in the area close to a rupturing fault to a minute or<br />
so (Heaton 1985; Allen and Kanamori 2003; Kanamori 2005).<br />
Several local and regional applications exist worldwide but<br />
no global system exists or could possibly exist for seismic<br />
early warning at global scale, due to timing constraints.<br />
Earthquake early warning systems applications must be<br />
designed at the local or regional level. Although various<br />
early warning systems exist worldwide at the local or<br />
regional scale, there are still high seismic risk areas that<br />
lack early warning applications, such as Peru, Chile, Iran,<br />
Pakistan, and India.<br />
Landslides<br />
Landslides cause billions of dollars in losses every year<br />
worldwide. However, most slopes are not monitored and<br />
landslide early warning systems are not yet in place.<br />
The International Consortium on Landslides (ICL),<br />
created at the Kyoto Symposium in January 2002, is an<br />
international non-governmental and non-profit scientific<br />
organization, which is supported by the United Nations<br />
Educational, Scientific and Cultural Organization (UNESCO),<br />
the WMO, FAO, and the United Nations International<br />
Strategy for Disaster Reduction (UN/ISDR). ICL’s mission is<br />
to promote landslide research for the benefit of society and<br />
the environment and promote a global, multidisciplinary<br />
program regarding landslides. ICL provides information<br />
about current landslides on its website, streaming this<br />
information from various sources such as the Geological<br />
Survey of Canada. This information does not provide<br />
any early warning since it is based on news reports<br />
after the events have occurred. Enhancing ICL’s existing<br />
organizational infrastructure by improving landslide<br />
prediction capability would allow ICL to provide early<br />
warning to authorities and populations. Technologies for<br />
slopes monitoring has greatly improved, but currently<br />
only few slopes are being monitored at a global scale. The<br />
use of these technologies would be greatly beneficial for<br />
mitigating losses from landslides worldwide.<br />
Tsunamis<br />
The Indian Ocean tsunami of December 2004 killed<br />
220 000 people and left 1.5 million homeless. It<br />
highlighted gaps and deficiencies in existing tsunami<br />
warning systems. In response to this disaster, in June<br />
2005 the Intergovernmental Oceanographic Commission<br />
(IOC) secretariat was mandated by its member states to<br />
coordinate the implementation of a tsunami warning<br />
system for the Indian Ocean, the northeast Atlantic and<br />
Mediterranean, and the Caribbean. Efforts to develop these<br />
systems are ongoing. Since March 2011, the Indonesian<br />
meteorological, climatological and geophysical agency<br />
has been operating the German-Indonesian Tsunami <strong>Early</strong><br />
<strong>Warning</strong> System for the Indian Ocean. Milestones, such as<br />
the development of the automatic data processing software<br />
and underwater communication for the transmission of<br />
pressure data from the ocean floor to a warning centre,<br />
have been reached. These systems will be part of the<br />
Global Ocean Observing System (GOOS), which will be<br />
part of GEOSS.<br />
The Pacific basin is monitored by the Pacific Tsunami<br />
<strong>Warning</strong> System (PTWS), which was established by 26<br />
Member States and is operated by the Pacific Tsunami<br />
<strong>Warning</strong> Center (PTWC), located near Honolulu, Hawaii.<br />
15
PTWC monitors stations throughout the Pacific basin<br />
to issue tsunami warnings to Member States, serving<br />
as the regional center for Hawaii and as a national and<br />
international tsunami information center. It is part of the<br />
PTWS effort. NOAA National Weather Service operates<br />
PTWC and the Alaska Tsunami <strong>Warning</strong> Center (ATWC)<br />
in Palmer, Alaska, which serves as the regional Tsunami<br />
<strong>Warning</strong> Center for Alaska, British Columbia, Washington,<br />
Oregon, and California. PTWS monitors seismic stations<br />
operated by PTWC, USGS and ATWC to detect potentially<br />
tsunamigenic earthquakes. Such earthquakes meet specific<br />
criteria for generation of a tsunami in terms of location,<br />
depth, and magnitude. PTWS issues tsunami warnings<br />
to potentially affected areas, by providing estimates of<br />
tsunami arrival times and areas potentially most affected.<br />
If a significant tsunami is detected, the tsunami warning<br />
is extended to the Pacific basin. The International Tsunami<br />
Information Center (ITIC), under the auspices of IOC, aims to<br />
mitigate tsunami risk by providing guidance and assistance<br />
to improve education and preparedness. ITIC also provides<br />
a complete list of tsunami events worldwide. Official<br />
tsunami bulletins are released by PTWC, ATWC, and the<br />
Japan Meteorological Agency (JMA). Regional and national<br />
tsunami information centres exist worldwide; the complete<br />
list is available from IOC.<br />
Currently, no global tsunami warning system is in place.<br />
In addition, fully operational tsunami early warning systems<br />
are needed for the Indian Ocean and the Caribbean. Initial<br />
steps have been taken in this direction. In 2010, NOAA<br />
established the Caribbean Tsunami <strong>Warning</strong> Program as<br />
the first step towards the development of a Caribbean<br />
Tsunami <strong>Warning</strong> Center. Since 2005, steps have been<br />
taken to develop an Indian Ocean tsunami system, such as<br />
establishing 26 tsunami information centres and deploying<br />
23 real-time sea level stations and 3 deep ocean buoys<br />
in countries bordering Indian Ocean. In 2005, the United<br />
States Agency for International Development (USAID)<br />
launched the US Indian Ocean Tsunami <strong>Warning</strong> <strong>Systems</strong><br />
Program as the US Government’s direct contribution to the<br />
international effort led by the IOC. Since then, there are<br />
ongoing activities, such as Germany’s five-year German-<br />
Indonesia Tsunami <strong>Early</strong> <strong>Warning</strong> System program with<br />
Indonesia, the Tsunami Regional Trust Fund established in<br />
2005, and the United Kingdom’s tsunami funds reserved for<br />
early warning capacity building.<br />
Nevertheless, on 17 July 2006, only one month after the<br />
announcement that the Indian Ocean’s tsunami warning<br />
system was operational, a tsunami in Java, Indonesia, killed<br />
hundreds of people. On that day, tsunami warnings were<br />
issued to alert Jakarta but there was not enough time<br />
to alert the coastal areas. The July 2006 tsunami disaster<br />
illustrates that there are still operational gaps to be solved<br />
in the Indian Ocean tsunami early warning system, notably<br />
in warning coastal communities on time.<br />
16<br />
Volcanic eruptions<br />
Volcanic eruptions are always anticipated by precursor<br />
activities. In fact, seismic monitoring, ground deformation<br />
monitoring, gas monitoring, visual observations, and<br />
surveying are used to monitor volcanic activity. Volcano<br />
observatories are distributed worldwide. A complete list of<br />
volcano observatories is available at the World Organization<br />
of Volcanic Observatories (WOVO) web site. However,<br />
there is still a divide between developed and developing<br />
countries. In particular, a large number of observatories<br />
and research centres monitor volcanoes in Japan and the<br />
United States very well. Most Central and South American<br />
countries (Mexico, Guatemala, El Salvador, Nicaragua, Costa<br />
Rica, Colombia, Ecuador, Peru, Chile, Trinidad, and the<br />
Antilles) have volcano observatories that provide public<br />
access to volcanic activity information. In Africa, only two<br />
countries (Congo and Cameroon) have volcano monitoring<br />
observatories and they do not provide public access to<br />
information. Only a small number, probably fewer than 50,<br />
of the world’s volcanoes are well monitored, mostly due to<br />
inadequate resources in poor countries (National Hazards<br />
Working Group 2005). There is a need to fill this gap by<br />
increasing the coverage of volcanic observatories.<br />
Currently, there is no global early warning system<br />
for volcanic eruptions except for aviation safety. Global<br />
volcanic activity information is provided by the Smithsonian<br />
institution, which partners with the USGS under the Global<br />
Volcanism Program to provide online access to volcanic<br />
activity information, collected from volcano observatories<br />
worldwide. Reports and warnings are available on a<br />
daily basis. Weekly and monthly summary reports are<br />
also available, but these only report changes in volcanic<br />
activity level, ash advisories, and news reports. The<br />
information is also available through Google Earth. This<br />
information is essential for the aviation sector, which must<br />
be alerted to ash-producing eruptions. There are several<br />
ash advisory centres distributed worldwide, in London,<br />
Toulouse, Anchorage, Washington, Montreal, Darwin,<br />
Wellington, Tokyo, and Buenos Aires. However, there is a<br />
need to coordinate interaction and data sharing among<br />
the approximately 80 volcano observatories that make up<br />
WOVO. ESA is developing GlobVolcano, an Information<br />
System to provide earth observations for volcanic<br />
risk monitoring.<br />
Wildfires<br />
<strong>Early</strong> warning methodologies for wildfires are based on the<br />
prediction of precursors, such as fuel loads and lightning<br />
danger. These parameters are relevant for triggering<br />
prediction, but once the fire has begun, fire behaviour<br />
and pattern modeling are fundamental for estimating fire<br />
propagation patterns. Most industrial countries have EW<br />
capabilities in place, while most developing countries have<br />
neither fire early warning nor monitoring systems in place
(Goldammer and others 2003). Local and regional scale<br />
fire monitoring systems are available for Canada, South<br />
America, Mexico and South Africa. An interactive mapping<br />
service based on Google maps and EO imagery from INPE,<br />
the Brazilian Space Research Institute, has been available<br />
since September 2008. Individuals can contribute with<br />
information from the ground; in only 3 months the service<br />
has received 41 million reports on forest fires and illegal<br />
logging, making it one of the most successful web sites<br />
in Brazil; it has had real impact through follow up legal<br />
initiatives and Parliamentary enquiries.<br />
Wildfire information is available worldwide through<br />
the Global Fire Monitoring Center (GFMC), a global portal<br />
for fire data products, information, and monitoring. This<br />
information is accessible to the public through the GFMC<br />
web site but is not actively disseminated. The GFMC<br />
provides global fire products through a worldwide network<br />
of cooperating institutions. GFMC fire products include:<br />
fire danger maps and forecasts, which provide assessment<br />
of fire onset risk; near real-time fire events information;<br />
an archive of global fire information; and assistance and<br />
support in the case of a fire emergency. Global fire weather<br />
forecasts are provided by the Experimental Climate<br />
Prediction Center (ECPC), which also provides national<br />
and regional scale forecasts. NOAA provides experimental,<br />
potential fire products based on estimated intensity and<br />
duration of vegetation stress, which can be used as a proxy<br />
for assessment of potential fire danger. The Webfire Mapper,<br />
part of FAO’s Global Fire Information Management System<br />
(GFIMS), initially developed by the University of Maryland<br />
and financially supported by NASA, provides near realtime<br />
information on active fires worldwide, detected by<br />
the MODIS rapid response system. The Webfire Mapper<br />
integrates satellite data with GIS technologies for active<br />
fire information. This information is available to the public<br />
through the website and email alerts.<br />
The European forest fire information system also<br />
provides information on current fire situations and forecasts<br />
for Europe and the Mediterranean area.<br />
Although global scale fire monitoring systems exist,<br />
an internationally standardized approach is required to<br />
create a globally comprehensive early fire warning system.<br />
Integration of existing fire monitoring systems could<br />
significantly improve fire monitoring and early warning<br />
capabilities. An information network must be developed to<br />
disseminate early warnings about wild-fire danger at both<br />
the global and local levels, to quickly detect and report<br />
fires, and to enhance rapid fire detection and classification<br />
capabilities at national and regional levels. The Global <strong>Early</strong><br />
<strong>Warning</strong> System for Wild-Fires, which is under development<br />
as part of the Global Earth Observation System of <strong>Systems</strong><br />
(GEOSS) effort, will address these issues.<br />
Hydro-meteorological hazards (except droughts)<br />
Floods<br />
Among natural hazards that are currently increasing in<br />
frequency, floods are the deadliest. This study shows there<br />
is inadequate coverage of flood warning and monitoring<br />
systems, especially in developing or least developed<br />
countries such as China, India, Bangladesh, Nepal, West<br />
Africa, and Brazil. At the local scale, there are several<br />
stand-alone warning systems, for example, in Guatemala,<br />
Honduras, El Salvador, Nicaragua, Zimbabwe, South Africa,<br />
Belize, Czech Republic, and Germany. However, they do<br />
not provide public access to information. The European<br />
Flood Alert System (EFAS), which is an initiative by EC-JRC,<br />
provides information on the possibility of river flooding<br />
occuring within the next three days. EFAS also provides an<br />
overview of current floods based on information received<br />
from the National Hydrological Services and the Global<br />
Runoff Data Center in Germany.<br />
Floods are monitored worldwide from the Dartmouth<br />
Flood Observatory, which provides public access to<br />
major flood information, satellite images and estimated<br />
discharge. Orbital remote sensing (Advanced Scanning<br />
Microradiometer (AMSR-E and QuickScat)) is used to detect<br />
and map major floods worldwide. Satellite microwave<br />
sensors can monitor, at a global scale and on a daily<br />
basis, increases of floodplain water surface without cloud<br />
interference. The Dartmouth Flood Observatory provides<br />
estimated discharge and satellite images of major floods<br />
worldwide but does not provide forecasts of flood<br />
conditions or precipitation amounts that could allow flood<br />
warnings to be issued days in advance of events. NOAA<br />
provides observed hydrologic conditions of major US river<br />
basins and predicted values of precipitation for rivers in<br />
the United States. NOAA also provides information on<br />
excessive rainfall that could lead to flash-flooding and if<br />
necessary warnings are issued within six hours in advance.<br />
IFnet Global Flood Alert System (GFAS) uses global satellite<br />
precipitation estimates for flood forecasting and warning.<br />
The GFAS website publishes useful public information<br />
for flood forecasting and warning, such as precipitation<br />
probability estimates, but the system is currently running<br />
on a trial basis. At a global scale, flood monitoring systems<br />
are more developed than flood early warning systems. For<br />
this reason, existing technologies for flood monitoring must<br />
be improved to increase prediction capabilities and flood<br />
warning lead times.<br />
Severe weather, storms and tropical cyclones<br />
At the global level, the World Weather Watch (WWW) and<br />
Hydrology and Water Resources Programmes coordinated<br />
by WMO provide global collection, analysis and distribution<br />
of weather observations, forecasts and warnings. The<br />
WWW is composed of the Global Observing System (GOS),<br />
17
18<br />
which provides the observed meteorological data; the<br />
Global Telecommunications System (GTS), which reports<br />
observations, forecasts and other products and the Global<br />
Data Processing System (GDPS), which provides weather<br />
analyses, forecasts and other products. The WWW is an<br />
operational framework of coordinated national systems,<br />
operated by national governments.<br />
The Tropical Cyclone Programme (TCP) is also part of<br />
the WWW. TCP is in charge of issuing tropical cyclones and<br />
hurricanes forecasts, warnings and advisories, and seeks to<br />
promote and coordinate efforts to mitigate risks associated<br />
with tropical cyclones. TCP has established tropical cyclone<br />
committees that extend across regional bodies (Regional<br />
Specialized Meteorological Centres (RSMC)), which,<br />
together with National Meteorological and Hydrological<br />
Services (NMHSs), monitor tropical cyclones globally and<br />
issue official warnings to the Regional Meteorological<br />
Services of countries at risk. Regional bodies worldwide<br />
have adopted standardized WMO-TCP operational plans<br />
and manuals, which promote internationally accepted<br />
procedures in terms of units, terminology, data and<br />
information exchange, operational procedures, and<br />
telecommunication of cyclone information. Each member<br />
of a regional body is normally responsible for its land and<br />
coastal waters warnings. A complete list of WMO members<br />
and RSMCs is available on the WMO-TCP website. WMO<br />
then collects cyclone information and visualizes it on<br />
world maps. The University of Hawaii collects information<br />
from WMO and provides online information on cyclone<br />
categories, wind speed, and current and predicted courses.<br />
Although comprehensive coverage of early warning<br />
systems for storms and tropical cyclones is available, recent<br />
disasters such as Hurricane Katrina of 2005 have highlighted<br />
inadequacies in early warning system technologies for<br />
enabling effective and timely emergency response. There<br />
is a pressing need to improve communication between<br />
the sectors involved by strengthening the links between<br />
scientific research, organizations responsible for issuing<br />
warnings, and authorities in charge of responding to these<br />
warnings. While the WWW is an efficient framework of<br />
existing RSMC, NMHSs and networks, national capacities in<br />
most developing countries need improvements in order to<br />
effectively issue and manage early warnings. Action plans<br />
must also be improved.<br />
Epidemics<br />
Epidemics pose a significant threat worldwide, particularly<br />
in those areas that are already affected by other serious<br />
hazards, poverty, or under-development. Epidemics spread<br />
easily across country borders. Globalization increases the<br />
potential of a catastrophic disease outbreak: there is the risk<br />
that millions of people worldwide could potentially<br />
be affected.<br />
A global disease outbreak early warning system is<br />
urgently needed. WHO is already working in this field<br />
through the Epidemic and Pandemic Alert and Response,<br />
which provides real-time information on disease outbreaks,<br />
and GOARN. The 192 WHO member countries, disease<br />
experts, institutions, agencies, and laboratories, part of<br />
an Outbreak Verification List, are constantly informed of<br />
rumoured and confirmed outbreaks. The WHO constantly<br />
monitors anthrax, avian influenza, Crimean-Congo<br />
hemorrhagic fever (CCHF), dengue hemorrhagic fever, Ebola<br />
hemorrhagic fever, Hepatitis, Influenza, Lassa fever, Marburg<br />
Hemorrhagic Fever, Meningococcal disease, plague, Rift<br />
Valley fever, Severe Acute Respiratory Syndrome (SARS),<br />
Tularaemia, and Yellow fever.<br />
A global early warning system for animal diseases<br />
transmissible to humans was formally launched in July 2006<br />
by the FAO, the World Organization for Animal Health (OIE),<br />
and WHO. The Global <strong>Early</strong> <strong>Warning</strong> and Response System<br />
for Major Animal Diseases, including Zoonoses (GLEWS)<br />
monitors outbreaks of major animal diseases worldwide.<br />
A malaria early warning system is not yet available and<br />
the need for system development is pressing, especially in<br />
Sub-Saharan Africa where malaria causes more than one<br />
million deaths every year. The IRI institute at Columbia<br />
University provides malaria risk maps based on rainfall<br />
anomaly, which is one of the factors influencing malaria<br />
outbreak and distribution, but no warning is disseminated<br />
to the potentially affected population.<br />
In addition, the Malaria Atlas Project (MAP) supported<br />
by the Wellcome Trust, the Global Fund to Fight AIDS,<br />
Tuberculosis and Malaria, the University of Oxford-Li<br />
Ka Shing Foundation Global Health Programme and<br />
others, aims to disseminate free, accurate and up-todate<br />
information on malaria. The MAP is a joint effort of<br />
researchers from around the globe working in different<br />
fields (from public health to mathematics, geography and<br />
epidemiology). MAP produces and makes available a range<br />
of maps and estimates to support effective planning of<br />
malaria control at national and international scales.<br />
3.2 Slow-onset (or “creeping”)<br />
environmental threats<br />
Air quality<br />
Air pollution affects developing and developed countries<br />
without exception. For this reason, air quality monitoring<br />
and early warning systems are in place in most countries<br />
worldwide. Nevertheless, there is still a technological divide<br />
between developed and developing countries; in fact, these<br />
systems are most developed in the United States, Canada,<br />
and Europe. There are several successful cases to mention<br />
in Asia (Taiwan, China, Hong Kong, Korea, Japan, and
Thailand), a few in Latin America (Argentina, Brazil,<br />
and Mexico City) and only one in Africa (Cape Town,<br />
South Africa).<br />
Most of the existing systems focus on real-time air<br />
quality monitoring by collecting and analyzing pollutant<br />
concentration measurements from ground stations.<br />
Satellite observation is extremely useful for aviation and<br />
tropospheric ozone monitoring, which is done by NASA<br />
and ESA. Air quality information is communicated mainly<br />
through web services. The U.S. Environmental Protection<br />
Agency (EPA) provides an email alert service (EPA AIRNow)<br />
only available in the U.S. and the Ministry of Environment of<br />
Ontario, Canada, also provides email alerts. The EPA AIRNow<br />
notification service provides air quality information in<br />
real-time to subscribers via e-mail, cell phone or pager,<br />
allowing them to take steps to protect their health in<br />
critical situations.<br />
While current air quality information is provided by each<br />
of the air quality monitoring systems listed in the Appendix,<br />
few sources provide forecasts. The following agencies<br />
provide forecasts, which are fundamental for early warning:<br />
U.S. EPA, ESA, Prev’Air, and the Environmental Agencies of<br />
Belgium, Germany, and Canada (See Appendix). Prediction<br />
capability is an essential component of the early warning<br />
process. Existing air quality monitoring systems need to<br />
be improved in order to provide predictions to users days<br />
in advance so they can act when unhealthy air quality<br />
conditions occur.<br />
Droughts, desertification and food security<br />
Drought<br />
Drought early warning systems are the least developed<br />
systems due its complex processes and environmental<br />
and social impacts. The study of existing drought early<br />
warning systems shows that only a few such systems<br />
exist worldwide.<br />
On a regional scale, the FEWS Net for Eastern Africa,<br />
Afghanistan, and Central America reports on current famine<br />
conditions, including droughts, by providing monthly<br />
bulletins that are accessible on the FEWS Net webpage.<br />
For the United States, the U.S. Drought Monitor (Svoboda<br />
and others 2002) provides current drought conditions at<br />
the national and state level through an interactive map<br />
available on the website accompanied by a narrative on<br />
current drought impacts and a brief description of forecasts<br />
for the following week. The U.S. Drought Monitor, a joint<br />
effort between the US Department of Agriculture (USDA),<br />
NOAA, the Climate Prediction Center, the University of<br />
Nebraska Lincoln and others, has become the best available<br />
product for droughts (Svoboda and others 2002). It has<br />
a unique approach that integrates multiple drought<br />
indicators with field information and expert input, and<br />
provides information through a single easy-to-read map<br />
of current drought conditions and short notes on drought<br />
forecast conditions. For China, the Beijing Climate Center<br />
(BCC) of the China Meteorological Administration (CMA)<br />
monitors drought development. Based on precipitation<br />
and soil moisture monitoring from an agricultural<br />
meteorological station network and remote-sensing-based<br />
monitoring from CMA’s National Satellite Meteorological<br />
Center, a drought report and a map on current drought<br />
conditions are produced daily and made available on their<br />
website. The European Commission Joint Research Center<br />
(EC-JRC) provides publicly available drought-relevant<br />
information through the following real-time online maps:<br />
daily soil moisture maps of Europe; daily soil moisture<br />
anomaly maps of Europe; and daily maps of the forecasted<br />
top soil moisture development in Europe (seven-day trend).<br />
At a global scale, two institutions (FAO’s Global<br />
Information and <strong>Early</strong> <strong>Warning</strong> System on Food and<br />
Agriculture (GIEWS) and Benfield Hazard Research Center of<br />
the University College London) provide some information<br />
on major droughts occurring worldwide. The FAO-GIEWS<br />
provides information on countries facing food insecurity<br />
through monthly briefing reports on crop prospects and<br />
food situations, including drought information, together<br />
with an interactive map of countries in crisis, available<br />
through the FAO website. Benfield Hazard Research Center<br />
uses various data to produce a monthly map of current<br />
drought conditions accompanied by a short description for<br />
each country. In addition, the WMO provides useful global<br />
meteorological information, such as precipitation levels,<br />
cloudiness, and weather forecasts, which are visualized on a<br />
clickable map on the WMO website.<br />
Existing approaches for drought early warning must<br />
be improved. Due to the complex nature of droughts,<br />
a comprehensive and integrated approach (such as the<br />
one adopted by the U.S. Drought Monitor) that would<br />
consider numerous drought indicators is required for<br />
drought monitoring and early warning. In addition, for<br />
large parts of the world suffering from severe droughts,<br />
early warning systems are not yet in place, such as in<br />
western and southern Africa, and in eastern Africa where<br />
FEWS Net is available but no drought forecast is provided.<br />
Parts of Europe (Spain, parts of France, southern Sweden,<br />
and northern Poland) are characterized by high drought<br />
risk but have no system in place. India, parts of Thailand,<br />
Turkey, Iran, Iraq, eastern China, areas of Ecuador, Colombia,<br />
and the south-eastern and western parts of Australia also<br />
require a drought warning system.<br />
19
Desertification<br />
The United Nations Convention to Combat Desertification<br />
(UNCCD), signed by 110 governments in 1994, aims to<br />
promote local action programs and international activities.<br />
National Action Programmes at the regional or subregional<br />
levels are key instruments for implementing the<br />
convention and are often supported by action programmes<br />
at sub-regional and regional levels. These programs lay<br />
out regional and local action plans and strategies to<br />
combat desertification. The UNCCD website provides a<br />
desertification map together with documentation, reports,<br />
and briefing notes on the implementation of action<br />
programs for each country worldwide.<br />
Currently no desertification early warning system<br />
is fully implemented, despite their potential to<br />
mitigate desertification.<br />
Food security<br />
The FAO’s GIEWS supports policy-makers by delivering<br />
periodic reports through the GIEWS webpage and an<br />
email service. GIEWS also promotes collaboration and data<br />
exchange with other organizations and governments.<br />
The frequency of briefs and reports—which are released<br />
monthly or bimonthly—may not be adequate for<br />
early warning purposes. The WFP is also involved in<br />
disseminating reports and news on famine crises through<br />
its web-service. No active dissemination is provided by WFP.<br />
Another service is FEWS net, a collaborative effort of the<br />
USGS, United States Agency for International Development<br />
(USAID), NASA, and NOAA, which reports on food insecurity<br />
conditions and issues watches and warnings to decisionmakers.<br />
These bulletins are also available on their website.<br />
Food security prediction estimates and maps would be<br />
extremely useful for emergency response, resources<br />
allocation, and early warning. The Food Security and<br />
Nutrition Working Group (FSNWG) serves as a platform to<br />
promote the disaster risk reduction agenda in the region<br />
and provides monthly updates on food security through<br />
maps and reports available on its website. FEWSnet and<br />
FSNWG were instrumental in predicting the food crisis in<br />
2010-2011 in the East African Region in a timely manner.<br />
Nevertheless these early warnings did not lead to early<br />
action to address the food crisis. If they had been used<br />
adequately, the impacts of the serious humanitarian crisis<br />
in the Horn of Africa could have been partially mitigated<br />
(Ververs 2011).<br />
Impact of climate variability<br />
Nearly all efforts to cope with climate change or variability<br />
focus on either mitigation to reduce emissions or on<br />
20<br />
adaptation to adjust to changes in climate. Although it is<br />
imperative to continue with these efforts, the on-going<br />
pace of climate change and the slow international response<br />
suggests that a third option is becoming increasingly<br />
important: to protect the population against the immediate<br />
threat and consequences of climate-related extreme events,<br />
including heat waves, forest fires, floods and droughts, by<br />
providing it with timely, reliable and actionable warnings.<br />
Although great strides have been made in developing<br />
climate-related warning systems over the past few years,<br />
current systems only deal with some aspects of climaterelated<br />
risks or hazards, and have large gaps in geographic<br />
coverage. Information exists for melting glaciers, lake water<br />
level, sea height and sea surface temperature anomalies, El<br />
Niño and La Niña. The National Snow and Ice Data Center<br />
(NSIDC)-Ice Concentration and Snow Extent provides near<br />
real-time data on daily global ice concentration and snow<br />
coverage. The USDA, in cooperation with the NASA and<br />
the University of Maryland, routinely monitors lake and<br />
reservoir height variations for approximately 100 lakes<br />
worldwide and provides online public access to lake water<br />
level data. Information on Sea Height Anomaly (SHA) and<br />
Significant Wave Height data are available from altimeter<br />
JASON-1, TOPEX, ERS-2, ENVISAT and GFO on a near-real<br />
time basis with an average 2-day delay. This information is<br />
provided by NOAA. Additionally, near real-time Sea Surface<br />
Temperature (SST) products are available from NOAA’s<br />
GOES and POES, as well as NASA’s EOS, Aqua and Terra.<br />
The International Research Institute (IRI) for Climate and<br />
Society provides a monthly summary of the El Niño and<br />
La Niña Southern Oscillation, providing forecast summary,<br />
probabilistic forecasts, and a sea surface temperature index.<br />
However, these systems are still far from providing the<br />
coverage and scope that is needed and technically feasible.<br />
Large parts of the world’s most vulnerable regions are still<br />
not covered by a comprehensive early warning system.<br />
Most systems only deal with one aspect of climate-related<br />
risks or hazards, e.g., heat waves or drought. Finally, most<br />
systems do not cover the entire early warning landscape<br />
from collection of meteorological data to delivery and<br />
response of users. Recently, the World Meteorological<br />
Organization proposed a Global Framework for Climate<br />
Services, which aims to strengthen the global cooperative<br />
system for collecting, processing and exchanging<br />
observations and for using climate-related information<br />
(WMO 2011).
Chapter 4: Conclusions and Future Perspectives<br />
4.1 <strong>Early</strong> warning systems: current gaps<br />
and needs<br />
<strong>Early</strong> warning technologies appear to be mature in certain<br />
fields but not yet in others. Considerable progress has<br />
been made, thanks to advances in scientific research<br />
and in communication and information technologies.<br />
Nevertheless, a significant amount of work remains to fill<br />
existing technological, communication, and geographical<br />
coverage gaps. <strong>Early</strong> warning technologies are now<br />
available for almost all types of hazards, although for<br />
some hazards (such as droughts and landslides) these<br />
technologies are still less developed. Most countries appear<br />
to have early warning systems for disaster risk reduction.<br />
However, there is still a technological and national capacity<br />
divide between developed and developing countries.<br />
From an operational point of view, some elements of the<br />
early warning process are not yet mature. In particular, it is<br />
essential to strengthen the links between sectors involved<br />
in early warning, including organizations responsible<br />
for issuing warnings and the authorities in charge of<br />
responding to these warnings, as well as promoting good<br />
governance and appropriate action plans.<br />
4.2 <strong>Early</strong> warning systems:<br />
future perspectives<br />
It is generally recognized that it is fundamental to establish<br />
effective early warning systems to better identify the<br />
risk and occurrence of hazards and to better monitor the<br />
population’s level of vulnerability. Although several early<br />
warning systems are in place at the global scale in most<br />
countries for most hazard types, there is the need “To work<br />
expeditiously towards the establishment of a worldwide<br />
early warning system for all natural hazards with regional<br />
nodes, building on existing national and regional capacity<br />
such as the newly established Indian Ocean Tsunami<br />
<strong>Warning</strong> and Mitigation System” (2005 UN World Summit<br />
Outcome). By building upon ongoing efforts to promote<br />
early warning, a multi-hazard early warning system will<br />
have a critical role in preventing hazardous events from<br />
turning into disasters. A globally comprehensive early<br />
warning system can be built, based on the many existing<br />
systems and capacities. This will not be a single, centrally<br />
planned and commanded system, but a networked and<br />
coordinated assemblage of nationally owned and operated<br />
systems. It will make use of existing observation networks,<br />
warning centres, modeling and forecasting capacities,<br />
telecommunication networks, and preparedness and<br />
response capacities (UN 2006). A global approach to<br />
early warning will also guarantee consistency of warning<br />
messages and mitigation approaches globally thus<br />
improving coordination at a multi-level and multi-sector<br />
scale among the different national actors such as the<br />
technical agencies, the academic community, disaster<br />
managers, civil society, and the international community.<br />
The next section provides an analysis of existing<br />
global early warning/monitoring systems that aggregate<br />
multi-hazard information.<br />
4.3 State of existing multi-hazard global<br />
monitoring/early warning systems<br />
This section presents the results of a comparative analysis<br />
of multi-hazard global monitoring/early warning systems.<br />
The aim of this analysis is to assess the effectiveness of<br />
existing global scale multi-hazard systems and define the<br />
set of needs suggested by comparing existing services. It<br />
assesses existing monitoring/early warning systems (Grasso<br />
and Singh 2007), chosen to be multi-hazard with global<br />
coverage, such as WFP’s (the UN food aid agency’s) HEWS;<br />
AlertNet, the humanitarian information alert service by<br />
Reuters; ReliefWeb, the humanitarian information alert<br />
service by UN-OCHA; GDACS (Global Disaster Alert and<br />
Coordination System), a joint initiative of the United Nations<br />
Office for the Coordination of Humanitarian Affairs (UN-<br />
OCHA) and the EC-JRC; and USGS ENS. These systems have<br />
been analysed for the type of events covered, variety of<br />
output/communication forms and range of users served.<br />
These systems cover a range of hazards and<br />
communicate results using a variety of methods. USGS ENS<br />
only provides information on earthquakes and volcanic<br />
eruptions through the Volcano Hazards Program (VHP)<br />
in collaboration with Smithsonian Institution. ReliefWeb<br />
focuses on natural hazards (earthquakes, tsunamis, severe<br />
weather, volcanic eruptions, storms, floods, droughts,<br />
cyclones, insect infestation, fires, and technological hazards)<br />
and health; AlertNet additionally provides information<br />
on food insecurity and conflicts. GDACS provides timely<br />
information on natural hazards (earthquakes, tsunamis,<br />
volcanic eruptions, floods, and cyclones). HEWS informs<br />
users on earthquakes, severe weather, volcanic eruptions,<br />
floods, and locusts.<br />
Existing systems, such as HEWS, post the information<br />
on a web site, provide mobile phone and RSS services,<br />
and GDACS sends emails, SMS and faxes to users. The<br />
GDACS notification service mostly addresses humanitarian<br />
organizations, rescue teams or aid agencies. AlertNet<br />
provides information to users through a web service, email,<br />
SMS and reports. ReliefWeb uses web services, email and<br />
reports to disseminate information to users. ReliefWeb and<br />
AlertNet also use new communications tools (Facebook and<br />
Twitter). OCHA’s Virtual On-site Operations Coordination<br />
Centre (Virtual-OSOCC) enables real-time information<br />
exchange by all actors of the international disaster response<br />
21
community during the early phases following disasters. This<br />
service has been integrated within GDACS but is restricted<br />
to disaster managers.<br />
The only natural event notification provided by USGS<br />
email service is earthquakes. HEWS offers no email<br />
22<br />
Figure 4: USGS map of recent earthquakes. The symbols showing recent earthquakes are colour coded; the most recent earthquakes are red and<br />
past-day events are orange, while last week’s events are yellow. Note that the size of symbol decreases with decreasing magnitude. From: http://<br />
earthquake.usgs.gov/eqcenter/recenteqsww/ (accessed 12 August 2011).<br />
notifications for natural events. AlertNet and ReliefWeb<br />
inform users on natural hazards and on health, food and<br />
security issues. USGS, ReliefWeb, AlertNet and GDACS serve<br />
a wide a variety of users such as international organizations,<br />
humanitarian aid, policy/decision makers, and civil society.<br />
Figure 5: The USGS and Smithsonian Institution’s Volcanic Activity Map showing past-week volcanic eruptions; red triangles show new volcanic<br />
activity and yellow is for ongoing activity. From: http://www.volcano.si.edu/reports/usgs/ (accessed 13 March 2009).
Figure 6: WFP–HEWS <strong>Early</strong> <strong>Warning</strong> Natural Hazards Map. The above global map provides the latest natural hazard information. From: http://www.<br />
hewsweb.org/hp/ (accessed 12 July 2011).<br />
The optimal global coverage multi-hazard system has to be<br />
as comprehensive as possible in terms of content, output<br />
and range of users. It will enhance existing systems by<br />
streaming data and information from existing sources and<br />
it will deliver this information in a variety of user-friendly<br />
formats to reach the widest range of users. By building<br />
on existing systems the multi-hazard system will inherit<br />
both the technological and geographical coverage gaps<br />
and limitations of existing early warning systems. The<br />
Volcano on the Canary Islands.<br />
review analysis performed in Chapter 3 has shown that<br />
for some hazards (such as droughts and landslides) these<br />
technologies are still less developed and for tsunamis<br />
these systems are still under development for areas at risk.<br />
The analysis has shown that there is still a technological<br />
and national capacity divide between developed and<br />
developing countries. From an operational point of view,<br />
the links and communication networks between all sectors<br />
involved (organizations responsible for issuing warnings<br />
artzubi/Flickr.com<br />
23 23
24<br />
Figure 7: AlertNet Map for country updates; circles with increasing diameter indicate higher number of events. From: http://www.alertnet.org/<br />
(accessed 12 August 2011).<br />
and the authorities in charge of responding to these<br />
warnings) need improvement. Likewise, good governance<br />
and appropriate action plans need to be promoted.<br />
Overcoming these gaps and enhancing, integrating, and<br />
coordinating existing systems is the first priority for the<br />
development of a global scale multi-hazard early<br />
warning system.<br />
Figure 5 GDACS Map for hazards: earthquakes, tsunamis, cyclones, volcanic eruptions, floods. Symbols for events are color coded according to<br />
intensity and potential impact. From: www.gdacs.org (accessed 08/12/2011).
4.4 Conclusions and recommendations<br />
<strong>Early</strong> warning technologies have greatly benefited from<br />
recent advances in communication and information<br />
technologies and an improved knowledge on natural<br />
hazards and the underlying science. Nevertheless many<br />
gaps still exist in early warning technologies and capacities,<br />
especially in the developing world, and a lot more has to<br />
be done to develop a global scale multi-hazard system.<br />
Operational gaps need to be filled for slow-onset hazards<br />
both in monitoring, communication and response phases.<br />
Effective and timely decision-making is needed for slowonset<br />
hazards.<br />
Below are some recommendations:<br />
1) Fill existing gaps<br />
Chapter 3 identified the weaknesses and gaps<br />
in existing early warning systems. Technological,<br />
geographical coverage, and capacity gaps exist, in<br />
addition to operational gaps for slow-onset hazards.<br />
In particular, actions need to be taken to improve<br />
prediction capabilities for landslides hazard aimed at<br />
developing a landslides early warning system. Likewise,<br />
there is a pressing need to improve existing prediction<br />
capabilities for droughts. A global early fire warning<br />
system is not yet in place, the tsunami early warning<br />
systems for the Indian Ocean and the Caribbean are<br />
not yet fully operational and a desertification early<br />
warning system has not been developed yet. There<br />
are ongoing efforts to develop these systems, such<br />
as the GFMC effort for the global fire EWS, the Indian<br />
Ocean Tsunami <strong>Warning</strong> System operated by Indonesia<br />
and a NOAA led effort in the Caribbean. A malaria<br />
early warning system is mandatory for Africa, where<br />
one million deaths occur every year due to malaria.<br />
Climate variability impacts need to be monitored<br />
within a global and coordinated effort, and the Global<br />
Framework for Climate Services needs to be further<br />
elaborated and operationalized. Local earthquake<br />
early warning systems applications are needed in<br />
high seismic risk areas, where early warning systems<br />
are not yet in place. Air quality and flood systems<br />
require improvements in prediction capabilities. Dust<br />
storms and transboundary early warning systems do<br />
not yet exist. A coordinated volcanic early warning<br />
system that would integrate existing resources is also<br />
needed as well as an increase in coverage of volcanic<br />
observatories. Particular attention should be paid to<br />
fill gaps in decision making processes for slow-onset<br />
hazards. Their extent and impact are challenging to<br />
quantify. For this reason, actions and response are far<br />
more difficult tasks for slow-onset hazards than they are<br />
for other natural hazards. An institutional mechanism<br />
to regularly monitor and communicate slow-onset<br />
changes is needed to keep changes under review and<br />
to enable rational and timely decisions to be taken<br />
based on improved information.<br />
2) Build capacity<br />
The evaluation study of existing early warning systems<br />
(Chapter 3) highlighted that a technological divide<br />
between developed and developing countries still<br />
exists. It is critical to develop basic early warning<br />
infrastructures and capacities in parts of the developing<br />
world most affected by disasters; it is also important to<br />
promote education programs on disaster mitigation<br />
and preparedness and integrate disaster mitigation<br />
plans into the broader development context. Poor<br />
countries suffer greater economic losses from disasters<br />
than rich countries. Development plays a key role<br />
and has a significant impact on disaster risk. Almost<br />
85 per cent of the people exposed to the deadliest<br />
hazards, earthquakes, floods, cyclones and droughts<br />
live in the developing world. The impact of disasters is<br />
mostly influenced by previous development choices. By<br />
integrating disaster mitigation strategies into planning<br />
and policies, the effects of disasters can be sensibly<br />
reduced and managed. “Disaster risk is not inevitable,<br />
but on the contrary can be managed and reduced<br />
through appropriate development actions” (United<br />
Nations Development Programme-UNDP 2004). It is<br />
through ”risk-sensitive development planning that<br />
countries can help reduce disaster risks”.<br />
Key targets for capacity building include:<br />
1. Developing national research, monitoring<br />
and assessment capacity, including training in<br />
assessment and early warning;<br />
2. Supporting national and regional institutions<br />
in data collection, analysis and monitoring of<br />
natural and man-made hazards;<br />
3. Providing access to scientific and technological<br />
information, including information on state-ofthe-art<br />
technologies;<br />
4. Education and awareness-raising, including<br />
networking among universities with<br />
programmes of excellence in the field of the<br />
emergency management;<br />
5. Organizing of training courses for local decision<br />
makers and communities;<br />
6. Bridging the gap between emergency relief and<br />
long-term development.<br />
25
26 26<br />
3) Bridge the gaps between science and decision<br />
making, and strengthen coordination and<br />
communication links<br />
Scientific and technological advances in modeling,<br />
monitoring and predicting capabilities could bring<br />
immense benefits to early warning if science were<br />
effectively translated into disaster management<br />
actions. Bridging the gap between scientific research<br />
and decision making will make it possible to fully<br />
exploit capacities of early warning technologies for<br />
societal benefit. The major challenge is to ensure<br />
that early warnings result in prompt responses<br />
by governments and potentially the international<br />
community. This requires that information be effectively<br />
disseminated in an accessible form down to the end<br />
user. This is achievable by adopting standard formats<br />
and easy-to-use tools for information dissemination,<br />
such as interactive maps, emails, SMS, etc. The adoption<br />
of standard formats (such as the Common Alerting<br />
Protocol CAP) for disseminating and exchanging<br />
information has to be promoted. The advantage of<br />
A volunteer group training in handling flash flood casualities, Pakistan.<br />
standard format alerts is their compatibility with<br />
all information systems, warning systems, media,<br />
and most importantly, with new technologies such<br />
as web services. The adoption of standard formats<br />
guarantees consistency of warning messages and<br />
is compatible with all types of information systems<br />
and public alerting systems, including broadcast<br />
radio and television as well as public and private data<br />
networks, with multi-lingual warning systems and<br />
emerging technologies. This would easily replace<br />
specific application oriented messages and will allow<br />
the merging of warning messages from several early<br />
warning systems into a single multi-hazard message<br />
format. Finally, it is critical to strengthen coordination<br />
and communication links by defining responsibility<br />
mechanisms and appropriate action plans. More often,<br />
time -sequenced warning messages are released in early<br />
warning processes, implying a decrease in warning<br />
times available for action and in reliability of the<br />
information. This trade-off needs to be addressed.<br />
ground reporter/Flickr.com
References<br />
Allen, R.M. and Kanamori, H., The Potential for Earthquake <strong>Early</strong><br />
<strong>Warning</strong> in Southern California, Science, 300, 786-789, 2003.<br />
Athena Global, Earth Observation Guide 2005.<br />
Brekke, C. and Soldberg, A.H.S. Oil spill detection by satellite<br />
remote sensing, Remote Sensing of Environment 95 (2005)<br />
1–13.<br />
Committee on Earth Observation Satellites (CEOS) Disaster<br />
Management Support Group (DMSG) CEOS Disaster<br />
Management Support Group Report, The Use of Earth<br />
Observing Satellites for Hazard Support: Assessments &<br />
Scenarios, Final Report of the CEOS Disaster Management<br />
Support Group, 2002. http://http://ceos.esa.int/plenary16/<br />
papers/plenary16_doc14_dmsg_final/final_report/DMSG_<br />
final.html (accessed 09/2007)<br />
Dilley M., Chen R.S. , Deichmann U., Lerner-Lam A.L. , Arnold M.,<br />
Natural Disaster Hotspots: A Global Risk Analysis, a report<br />
from the World Bank, 2005.<br />
Espinosa-Aranda JM, Jimenez A, Ibarrola G, Alcantar F, Aguilar<br />
A, Mexico City Seismic Alert System. Seismogical Research<br />
Letters 66: 42-53, 1995.<br />
Fadhil A.M., Environmental Change Monitoring by Geoinformation<br />
Technology for Baghdad and its Neighboring Areas, http://<br />
www.gisdevelopment.net/application/environment/<br />
conservation/ma06_103.htm (accessed 10/2011)<br />
Global Earth Observation System of <strong>Systems</strong> GEOSS 10-year<br />
Implementation Plan Reference Document, 2005.<br />
Golnaraghi M., <strong>Early</strong> warning systems, <strong>UNEP</strong>/<strong>GRID</strong>-Arendal Maps<br />
and Graphics Library: http://maps.grida.no/go/graphic/early_<br />
warning_systems, 2005.<br />
Goldammer J.G. et al., <strong>Early</strong> <strong>Warning</strong> of Wildland Fires, Second<br />
International Conference on <strong>Early</strong> <strong>Warning</strong>, Bonn, Germany,<br />
16-18 October 2003.<br />
Glantz M.H., Usable Science: <strong>Early</strong> warning systems: Do’s and<br />
Don’ts. Report of workshop, 20-23 October, Shangai, China,<br />
2003.<br />
Grasso V.F., Seismic <strong>Early</strong> <strong>Warning</strong> <strong>Systems</strong>: Procedure for<br />
Automated Decision Making, PhD thesis, 2005.<br />
Grasso V.F., Seismic <strong>Early</strong> <strong>Warning</strong> <strong>Systems</strong>: Procedure for<br />
automated decision making, University of Naples “Federico II”,<br />
Ph.D. thesis, January 2006. http://www.fedoa.unina.it/825/<br />
Grasso V.F., Beck J.L., Manfredi G., Automated decision procedure<br />
for earthquake early warning, Journal of Engineering<br />
Structures, 29 (Issue 12), December 2007, Pages 3455–3463<br />
Grasso, V.F., and Singh, A., 2008, Global Environmental Alert Service<br />
(GEAS): Advances in Space Research, v. 41, no. 11, p. 1836-<br />
1852. http://dx.doi.org/10.1016/j.asr.2007.11.014.<br />
Heaton, T. H. (1985). A model for a seismic computerized alert<br />
network. Science 228, 987–990.<br />
Horiuchi, S., H. Negishi, K. Abe, A. Kimimura, and Y. Fujinawa. An<br />
automatic processing system for broadcasting earthquake<br />
alarms. Bulletin of Seismological Society of America, BSSA,<br />
Submitted, 2004.<br />
Jaynes, E. T. Probability theory: The logic of science, L.Bretthorst,<br />
ed., Cambridge University Press, Cambridge, U.K., 2003.<br />
Kamigaichi, O. JMA Earthquake <strong>Early</strong> <strong>Warning</strong>. Journal of Japan<br />
Association for Earthquake Engineering 2004, 4, 134-137.<br />
Kanamori, H. (2005). Real-time seismology and earthquake<br />
damage mitigation. Annual Review of Earth and Planetary<br />
Sciences 33, 195–214.<br />
Kathryn H., NASA Satellites Eye Coastal Water Quality, NASA Earth<br />
Observatory News , 2007. http://www.nasa.gov/centers/<br />
goddard/news/topstory/2007/coastal_waters.html (accessed<br />
09/2007)<br />
Klaver R.W., Singh A. and Fosnight E.A., Global forest fire watch:<br />
wildfire potential, detection, monitoring and assessment,<br />
Proceedings of First International Conference on Geospatial<br />
Information in Agriculture and Forestry, Disney’s Coronado<br />
Springs Resort, Lake Buena Vista, Florida, USA, 1-3 June 1998.<br />
http://www.na.unep.net/globalfire/indofire/firepaper.html)<br />
(accessed 07/2011)<br />
IGOS-P- Integrated Global Observations of the Land, A proposed<br />
theme to the IGOS-Partnership-Version 2, Eleventh IGOS<br />
Partners Meeting, Rome, Italy, 27 May 2004.<br />
IGOS-P Geohazards Report, 2003. http://ioc.unesco.org/<br />
igospartners/geohazards.htm<br />
Mansor S. B., Assilzadeh H., Ibrahim H.M., Mohamd A. R. , Oil Spill<br />
Detection and Monitoring from Satellite Image, 2007. http://<br />
www.gisdevelopment.net/application/miscellaneous/<br />
misc027.htm (accessed 08/2011)<br />
Nakamura, Y. (2004). UrEDAS, urgent earthquake detection and<br />
alarm system, now and future. In Proceedings of the 13th<br />
World Conferenceon Earthquake Engineering, August 2004,<br />
paper no. 908.<br />
Odaka, T.; Ashiya, K.; Tsukada, S.; Sato, S.; Ohtake, K.; Nozaka, D. A<br />
new method of quickly estimating epicentral distance and<br />
magnitude from a single seismic record. Bull. Seism. Soc. Am.<br />
2003, 93, 526-532.<br />
Report on Integrating <strong>Early</strong> <strong>Warning</strong> into Relevant Policies, Second<br />
International Conference on <strong>Early</strong> <strong>Warning</strong>, EWC II, 16-18<br />
October, Bonn, 2003.<br />
Sarevitz D., Pielke R.A. and Byerly R., Prediction, Science, Decision<br />
Making and the Future of Nature, Island Press, 2000.<br />
Sarmap, University of Valencia,EOS.D2C, Chinese Academy of<br />
Forestry, Treaty Enforcement Services using Earth Observation<br />
(TESEO) Desertification, Final Report, 2003<br />
Scofield R.A., Kuligowski R. J., Qiu S., and Davenport C. , AWIPS for<br />
Satellite-Derived Hydrometeorological Applications, 18th<br />
International Conference on IIPS Interactive Symposium on<br />
AWIPS, 2002.<br />
27
28<br />
Singh, A. 1989. Digital Change Detection Techniques Using<br />
Remotely Sensed Data. Int. J. of Remote Sensing, Vol. 10(6):<br />
989-1003.<br />
Svoboda M., LeComte D., Hayes M., Heim R., Gleason K., Angel J.,<br />
Rippey B., Tinker R., Palecki M., Stooksbury D., Miskus D., and<br />
Stephens S., The Drought Monitor. Bulletin of the American<br />
Meteorological Society pp.1181–1190, Volume 83, Issue 8,<br />
August 2002.<br />
The Global Earth Observation System of <strong>Systems</strong> (GEOSS), 10-Year<br />
Implementation Plan Reference Document, 2005<br />
The Role of Science In Physical Natural Hazard Assessment, Report<br />
to the UK Government by the Natural Hazard Working Group,<br />
2005. http://www.bis.gov.uk/files/file8511.pdf<br />
Twigg J., <strong>Early</strong> <strong>Warning</strong> <strong>Systems</strong> for Natural Disasters Reduction,<br />
Zschau J. and Kuppers A. Editors, Springer, pp. 19-26, 2003.<br />
UNDP- United Nations Development Programme Bureau for Crisis<br />
Prevention and Recovery, Reducing disaster risk a challenge<br />
for development, 2004.<br />
Websites Visited<br />
International Atomic Energy Agency (IAEA). http://www.iaea.org/<br />
(accessed 08/2007)<br />
Modis Rapid Response System. http://rapidfire.sci.gsfc.nasa.gov/<br />
NOAA-National Environmental Satellite Data and Information<br />
Service- NESDIS, http://www.ncdc.noaa.gov/oa/climate/<br />
research/dm/weekly-dm-animations.html (accessed 08/2007)<br />
Acronyms<br />
AMSR-E Advanced Scanning Microradiometer<br />
AMSU NOAA/Advanced Microwave Sounding Unit<br />
ATWC Alaska Tsunami <strong>Warning</strong> Center<br />
AVHRR Advanced Very High Resolution Radiometer<br />
BCC Beijing Climate Center<br />
CAP Common Alerting Protocol<br />
CEOS Committee on Earth Observation Satellites<br />
CMA China Meteorological Administration<br />
CNES Centre National d’Etudes Spatiales<br />
DEM Digital elevation maps<br />
DMSP Defense Meteorological Satellite Program<br />
DoD Department of Defense<br />
EC European Commission<br />
EC-JRC European Commission Joint Research Center<br />
ECPC Experimental Climate Prediction Center<br />
EDM Electronic Distance Measurement<br />
EFAS European Flood Alert System<br />
United Nations, Global Survey of <strong>Early</strong> <strong>Warning</strong> <strong>Systems</strong>, United<br />
Nations report, 2006.<br />
United Nations Environment Programme Division of <strong>Early</strong> <strong>Warning</strong><br />
and Assessment (<strong>UNEP</strong>-DEWA), “One Planet Many People:<br />
Atlas of Our Changing Environment.”, Nairobi, Kenya, 2006.<br />
Ververs, M., The Aest African Food Crisis: Did Regional <strong>Early</strong><br />
<strong>Warning</strong> <strong>Systems</strong> Function?, The Journal of Nutrition, 2011.<br />
World Meteorological Organization, Climate Knowledge for Action:<br />
A Global Framework for Climate Services– Empowering the<br />
most vulnerable, No. 1065, 2011.<br />
World Meteorological Organization, Drought Monitoring and <strong>Early</strong><br />
<strong>Warning</strong>: Concepts, Progress and Future Challenges,<br />
WMO Report No. 1006, ISBN 92-63-11006-9, 2006<br />
Wu, Y. M., T. C. Shin and Y. B. Tsai, Quick and reliable determination<br />
of magnitude for seismic early warning, Bull. Seismol. Soc.<br />
Am. 88, 1254- 1259. 1998.<br />
Wu, Y. M.; Teng, T. L. A virtual sub-network approach to earthquake<br />
early warning. Bull. Seism. Soc. Am. 2002, 92, 2008-2018.<br />
U.S. Department of the Interior, Minearls Management Service,<br />
2007. http://www.mms.gov/tarprojectcategories/remote.htm<br />
(accessed 08/2011)<br />
U.S.Centennial of Flight Commission. http://www.<br />
centennialofflight.gov (accessed 10/2011)<br />
United Nations Convention to Combat Desertification (UNCCD):<br />
http://www.unccd.int/ (accessed 06/2007)<br />
ENAC Emergency Notification and<br />
Assistance Convention<br />
EO Earth observation<br />
ESA European Space Agency<br />
EOS Earth Observing Satellites<br />
EPA U.S. Environmental Protection Agency<br />
EWS <strong>Early</strong> <strong>Warning</strong> System<br />
EW <strong>Early</strong> <strong>Warning</strong><br />
FAO Food and Agriculture Organization<br />
of the United Nations<br />
FEWS Net Famine <strong>Early</strong> <strong>Warning</strong> System<br />
FSNWG Food Security and Nutrition Working Group<br />
GAW Global Atmosphere Watch<br />
GCOS Global Climate Observing System<br />
GDACS Global Disaster Alert and Coordination System<br />
GDPS Global Data Processing System<br />
GEOSS Global Earth Observation System of <strong>Systems</strong>
GFAS Global Flood Alert System<br />
GFIMS Global Fire Information Management System<br />
GFMC Global Fire Monitoring Center<br />
GIEWS Global Information and <strong>Early</strong> <strong>Warning</strong> System<br />
on Food and Agriculture<br />
GIS Geographical Information <strong>Systems</strong><br />
GOARN Global Outbreak Alert and Response Network<br />
GOES Geostationary operational<br />
environmental satellites<br />
GOOS Global Ocean Observing System<br />
GOS Global Observing System<br />
GPHIN Global Public Health Intelligence Network<br />
GPS Global Positioning System<br />
GSN Global Seismic Networks<br />
GTOS Global Terrestrial Observing System<br />
GTS Global Telecommunications System<br />
HEWS Humanitarian <strong>Early</strong> <strong>Warning</strong> <strong>Early</strong><br />
<strong>Warning</strong> Service<br />
IAEA International Atomic Energy Agency<br />
ICT Information and Communication Technology<br />
ICL International Consortium on Landslides<br />
IEC Incident and Emergency Centre<br />
IGOS Integrated global observing strategy<br />
INPE Brazilian Space Research Institute<br />
IOC ntergovernmental Oceanographic Commission<br />
IPCC Intergovernmental Panel for Climate Change<br />
IR Infra-red<br />
IRI International Research Institute<br />
IRIS Incorporated Research Institutions<br />
for Seismology<br />
ISDR International Strategy for Disaster Reduction<br />
ITIC International Tsunami Information Center<br />
JMA Japan Meteorological Agency<br />
MODIS Moderate Resolution<br />
Imaging Spectroradiometer<br />
MOPITT Measurements of Pollution in the Troposphere<br />
NASA National Aeronautics and Space Administration<br />
NEWS Nuclear Event Web-based System<br />
NMHS National Meteorological and<br />
Hydrological Services<br />
NOAA National Oceanic and Atmospheric Organization<br />
NOAA-NESDIS NOAA’s National Environmental Satellite,<br />
Data, & Information Service<br />
NSIDC National Snow and Ice Data Center<br />
NWS National Weather Service<br />
OMI Ozone Monitoring Instrument<br />
OIE World Organization for Animal Health<br />
OLS Optical Linescan System<br />
POES Polar Orbiting Environmental Satellites<br />
PPEW Platform for the Promotion of <strong>Early</strong><br />
<strong>Warning</strong> (ISDR)<br />
PTWC Pacific Tsunami <strong>Warning</strong> Center<br />
PTWS Pacific Tsunami <strong>Warning</strong> System<br />
RSMC Regional Specialized Meteorological Centres<br />
RSS Really Simple Syndication<br />
SAR Synthetic Aperture Radar<br />
SCHIAMACH Scanning Imaging Absorption<br />
Spectro-Meter for Atmospheric<br />
Chartography<br />
SeaWiFS Sea-viewing Wide Field-of-view Sensor<br />
SHA Sea Height Anomaly<br />
SMS Short Message Service<br />
SSM/I-Special Sensor Microwave/Imager<br />
SST Sea surface temperature<br />
TOMS Total Ozone Mapping Spectrometer<br />
TRMM Tropical Rainfall Measuring Mission<br />
UN United Nations<br />
UNCCD United Nations Convention to<br />
Combat Desertification<br />
UNDP United Nations Development Programme<br />
<strong>UNEP</strong> United Nations Environment Programme<br />
<strong>UNEP</strong>-DEWA United Nations Environment Programme-<br />
Division of <strong>Early</strong> <strong>Warning</strong> and Assessment<br />
UNESCO United Nations Educational, Scientific and<br />
Cultural Organization<br />
UN-OCHA United Nations Office for the Coordination of<br />
Humanitarian Affairs<br />
UNOOSA United Nations Office for Outer Space Affairs<br />
USAID United States Agency for<br />
International Development<br />
USGS U.S. Geological Survey<br />
USGS-ENS U.S. Geological Survey-Earthquake<br />
Notification Service<br />
VHP Volcano Hazards Program<br />
WCP World Climate Programme<br />
WCRP World Climate Research Programme<br />
WFP World Food Programme<br />
WHO World Health Organization<br />
WMO World Meteorological Organization<br />
WMO-TCP World Meteorological Organization-Tropical<br />
Cyclone Programme<br />
WOVO World Organization of Volcanic Observatories<br />
WWW World Weather Watch<br />
XML Extensible Markup Language<br />
29
30<br />
Appendix<br />
Type of event Source Geographic Output Website Description<br />
Coverage<br />
Air Pollution<br />
European Space Global Daily Maps of total http://www.temis.nl/ ESA provides daily maps of<br />
Agency (ESA) ozone column, global index.html air quality: Ozone column<br />
ozone field, erythemal from SCIAMACHY, GOME<br />
UV index, NO 2 column, or OMI; UV information is<br />
absorbing aerosol index from SCIAMACHY and other<br />
and 8-days forecsats sources, NO 2 from OMI and<br />
GOME-2 and SCIAMACHY. Is<br />
also available a 8-day<br />
forecast of total ozone<br />
column and UV index at a<br />
global scale. Comments:<br />
Information on ground-level<br />
ozone is not provided thus<br />
the use of these products for<br />
local scale air pollution<br />
assessment is limited.<br />
NASA Global Daily maps of total Maps of total ozone NASA provides daily maps<br />
ozone column and column from OMI: of total ozone column and<br />
Aerosol index http://toms.gsfc. aerosol index from OMI<br />
nasa.gov/teacher/ instrument that also<br />
ozone_overhead_v8 provides information on<br />
.html?96,56 aerosol type and cloud<br />
coverage. Using these data<br />
Maps of total ozone it is possible to monitor<br />
from OMI: http:// a wide range of<br />
toms.gsfc.nasa.gov/ phenomena such as<br />
ozone/ozone_v8.html desert dust storms,<br />
forest fires and biomass<br />
Maps of aerosol index: burning. Comments:<br />
http://toms.gsfc. Information on ground-<br />
nasa.gov/aerosols/ level ozone is not provided<br />
aerosols_v8.html thus the use of these<br />
products for local scale air<br />
assessment pollution<br />
is limited.<br />
Europe<br />
European Europe Real-time Maps http://www.eea. Data is collected by EEA<br />
Environment of ground-level europa.eu/maps/ from several European<br />
Agency-EEA ozone ozone/welcome/ organizations which provide<br />
ground-level ozone<br />
measurements to EEA. Data<br />
is then made available on<br />
the EEA website through<br />
real-time interactive maps,<br />
which are updated an hourly<br />
basis. Air quality maps are<br />
color coded according to<br />
threshold values in EU<br />
legislation. Comments: The<br />
air quality data used on EEA<br />
website are preliminary. They<br />
are received immediately<br />
—within an hour of the<br />
measurement being made<br />
—from measurement<br />
stations. Particulate matter<br />
information will be provided<br />
in the future. Forecasts of<br />
ground-level ozone are not<br />
available.
Type of event Source Geographic Output Website Description<br />
Coverage<br />
Air Quality U.K. Real-time maps of For London: The London Air Quality<br />
Network air quality index http://www.londonair. Network measures air quality<br />
org.uk/ london/asp/ parameters as NO 2 , CO, SO 2 ,<br />
PublicBulletin.asp? ozone, PM2.5 and PM10<br />
bulletindate= in and around greater<br />
03%2F05%2F2006& London. Measurements<br />
region=0&bulletin= are collected either hourly or<br />
daily&site=&la_id= twice daily from continuous<br />
&postcode=&Submit monitoring sites, processed<br />
=Go and checked then placed on<br />
the web site with an hourly<br />
For the whole U.K. update. The air quality index<br />
http://www.airquality. displayed on the map is<br />
co.uk/archive/ color coded. Comments: Air<br />
index.php quality information is not<br />
complete for all the<br />
monitoring sites. Forecasts<br />
of air quality index are not<br />
available.<br />
Leeds City Leeds, U.K. Real-time maps of http://www.airviro. Leeds City Council Air<br />
Council fPM10, SO 2 , NO 2 , smhi.se/leeds/ Pollution Monitoring site<br />
CO 2 , ozone. operates a monitoring<br />
network to gather<br />
information used to review<br />
and assess air quality within<br />
the Leeds area. The maps<br />
gives access to the PM10,<br />
SO 2 , NO 2 , CO 2 , ozone current<br />
values and results for the last<br />
7 days are also available. It is<br />
also possible to download<br />
data in Excel format.<br />
Comments: Forecasts of<br />
PM10, SO 2 , NO 2 , CO 2 , ozone<br />
are not available.<br />
National Denmark Real-time maps of http://www2.dmu.dk Air quality in Denmark is<br />
Environmental air quality index /1_Viden/2_miljoe monitored with a network<br />
Research -tilstand/3_luft/ of measuring stations. Data<br />
Institute of 4_maalinger/ are usually updated every<br />
Denmark default_en.asp hour during daytime and<br />
updated in real-time.<br />
Comment: The webpage is<br />
only available in Danish.<br />
PREV’Air Europe Real-time maps of http://prevair.ineris.fr Real-time maps of ozone,<br />
(Ministere de ozone, NO 2 , and /fr/index.php NO 2 , and PM10 are available<br />
L’Ecologie et du PM10 (only for for France from Associations<br />
development France) and 3-day http://www.notre- Agréées de Surveillance<br />
durable, INERIS, forecasts planete.info/ de la Qualité de l´Air<br />
CNRS, Meteo environnement/ (AASQA) updated every<br />
France and picsactus.php hour. PREV’Air uses a<br />
Institute Pierre predictive model to produce<br />
Simon Laplace) 2-days prediction maps<br />
ozone, NO 2 , and PM2.5,<br />
PM10 for Europe and for<br />
ozone the product is<br />
available also at a global<br />
scale. Comments: The<br />
website is available only in<br />
French.<br />
31
32<br />
Type of event Source Geographic Output Website Description<br />
Coverage<br />
Interregional Belgium Daily values and Observations: This effort is a collaborative<br />
Cell for the forecast maps of http://www.irceline. effort Interregional Cell for<br />
Environment ozone, NO 2 , CO, be/~celinair/ the Environment and the<br />
SO 2 , PM10, PM2.5 english/homeen European Agency for the<br />
and C 6 H 6 _java.html Environment EEA.<br />
Home page:<br />
http://www.irceline.<br />
be/<br />
AirParif Ile de Real-time and forecast http://www.airparif. AIRPARIF provides air quality<br />
France maps of NO 2 , PM10, asso.fr/ information for the region<br />
ozone and SO 2 and 1 day forecast. It also<br />
displays an interactive map<br />
on air quality for major<br />
European cities.Comments:<br />
The website is available only<br />
in French.<br />
Federal Germany Real-time maps of http://www.env-it.de/ Federal Environmental<br />
Environmental NO 2 , ozone, PM10, luftdaten/start.fwd? Agency (FEA) and the<br />
Agency CO 2 and SO 2 . setLanguage=en German Laender collect<br />
Forecast maps of ozone air quality data from<br />
measuring stations in<br />
Germany on air quality.<br />
Comments: Some of the<br />
website’s pages are available<br />
only in German.<br />
Environmental Ireland Daily values of NO 2 , http://www.epa.ie/ The Environmental<br />
Protection SO 2 , PM, benzene whatwedo/monitoring/ Protection Agency (EPA)<br />
Agency air/data/ for Ireland provide an<br />
interactive map of air quality<br />
and daily values of NO 2 , SO 2 ,<br />
PM, benzene. Comments:<br />
Daily values are not available<br />
for all monitoring sites.<br />
Forecasts are not available.<br />
Asia<br />
Ministry of China-84 Daily values of Main website in Ministry of Environmental<br />
Environmental major cities air quality index English: http://english. Protection Administration of<br />
Protection in China and prominent mep.gov.cn/ China provides daily air<br />
Administration pollutant (PM Air Quality Daily: quality index and prominent<br />
of China or SO 2 ) http://datacenter. pollutant (PM or SO 2 )<br />
mep.gov.cn/report/air associated with a level grade<br />
_daily/air_dairy_en.jsp for 120 cities in China on their<br />
Air Quality Forecast: website. Forecasts are also<br />
http://datacenter.mep. available. Comments: Daily<br />
gov.cn/report/air_ values are not available for all<br />
forecast/dairy_ monitoring sites.<br />
forecast_en.jsp<br />
Environmental Hong Kong Daily values of air http://www.epd-asg. The Environmental<br />
Protection quality index and gov.hk/ Protection Department (EPD)<br />
Department- prominent pollutant provides daily air quality<br />
Government (PM or NO 2 ). index and prominent<br />
of Hong Kong pollutant (PM or NO 2 )<br />
associated with a level grade.<br />
Graphs are also available to<br />
show data of the past days.<br />
Comments: Forecasts are not<br />
provided.
Type of event Source Geographic Output Website Description<br />
Coverage<br />
Environmental Taiwan Real-time air quality http://210.69.101.141/ The EPA of Taiwan aims at<br />
Protection index map. For each taqm/en/default.aspx preventing pollution, and<br />
Administration monitoring site is supporting international<br />
provided a detailed environmental initiatives<br />
table of SO 2 , CO, in order to achieve sustainable<br />
ozone, PM10, O 2 . development. EPA provides<br />
a daily map of air quality<br />
level for Taiwan. Comments:<br />
Forecasts are also provided.<br />
AIRKOREA Korea Real-time map of air http://www.airkorea. Since 2005, AIRKOREA<br />
quality index and NO 2 , or.kr/airkorea/eng provides a public access to air<br />
CO, PM10, ozone, /realtime/main.jsp quality information collected<br />
O 2 , SO 2 . hourly in more than 16 areas<br />
in South Korea. On the<br />
website, an interactive map<br />
shows air quality index and<br />
pollutant values for major<br />
cities. Comments: Forecasts are<br />
not provided.<br />
Pollution Thailand Daily map of air Daily air quality map: Pollution Control Department<br />
Control quality index and http://www.pcd.go.th provides access to air<br />
Department– values of PM10, SO 2 , NO 2 , /AirQuality/Regional quality information for 30<br />
Ministry of CO, ozone are /Graph/createaqi2.cfm locations in Thailand. A<br />
Natural provided in a table. Values of SO 2 , NO 2 , CO, color coded air quality map is<br />
Resources and ozone: http://www. available on the website.<br />
Environment pcd.go.th/AirQuality/ For each location is also<br />
Regional/Default.cfm provided a table with<br />
pollutants values. Comments:<br />
Forecasts are not provided.<br />
Australia<br />
Environment New South Values of ozone, http://www. The EPA is involved in<br />
Protection Wales NO 2 , PM10, CO, environment.nsw. programs on pollution,<br />
Authority– SO 2 . gov.au/AQMS/ aqi.htm. coastal management, and<br />
Department of water quality. The EPA website<br />
Environment provides daily values of<br />
and Conservation pollutants for the Sydney<br />
area, Illawarra, Hunter,<br />
Tablelands and Slopes areas.<br />
Comments: Forecasts are not<br />
provided.<br />
Environment Victoria, Map of air quality Map of air quality EPA Victoria provides<br />
Protection Australia index and forecasts index: http://www. public access to values<br />
Authority– of CO, NO 2 , O 3 and epa.vic.gov.au/ of several air pollutants<br />
Victoria hydrocarbons Air/AQ4Kids/ selected CO, NO 2 , O 3 and<br />
concentrations. station_map.asp hydrocarbons concentrations.<br />
(only for Victoria In addition to it, prevailing<br />
and Melbourne). Forecasts: temperature and wind<br />
Also wind condition http://www.epa.vic. conditions, are also provided.<br />
and temperature gov.au/Air/AAQFS/<br />
are provided. AAQFS_VIC_Forecast<br />
.asp<br />
http://www.epa.vic.<br />
gov.au/Air/AAQFS/<br />
AAQFS_Melb_<br />
Forecast.asp<br />
33
34<br />
Type of event Source Geographic Output Website Description<br />
Coverage<br />
North and South America<br />
Environment Canada Real-time maps of air http://www.ec.gc.ca/ Environment Canada website<br />
Canada quality index and cas-aqhi/ provides access to real-time<br />
forecasts (only in maps of air quality index for<br />
summer) British Columbia, Alberta,<br />
Ontario, Quebec, New<br />
Brunswick, Prince Edward<br />
Island, Nova Scotia, Labrador<br />
and Newfoundland. From May<br />
to September forecasts are<br />
also available. Air Quality<br />
advisories are issued when<br />
the air pollution levels exceed<br />
national standards. They are<br />
issued in partnership with<br />
provincial and municipal<br />
environment and health<br />
authorities and contain advice<br />
on action that can be taken to<br />
protect the health of<br />
Canadians and the<br />
environment. Comments:<br />
Forecasts are available only in<br />
summer.<br />
Alberta Alberta, Maps of air http://environment. Alberta Government website<br />
Government Canada quality index alberta.ca/0977.html provides access to air quality<br />
information through<br />
http://www. interactive Google maps,<br />
environment. alberta. which also provides forecasts.<br />
ca/apps/aqhi/aqhi.aspx<br />
Ministry of British Real-time values http://www. The Water, Air and Climate<br />
Environment, Columbia, air quality bcairquality.ca/ Change Branch Ministry of<br />
Government Canada Environment provides<br />
of British information on air quality for<br />
Columbia various locations in British<br />
Columbia, together with<br />
forecasts.<br />
Ministry of Ontario Real-time and http://www. Ministry of Environment<br />
Environment, forecast maps of airqualityontario provides a detailed and<br />
Ontario air quality index .com/ comprehensive service to<br />
and information on air quality information with<br />
O 3 , PM, NO 2 , SO. daily updated air quality<br />
E-mail alerts index maps and 3-day<br />
forecast; email alerts for<br />
several locations in Ontario<br />
are also available.<br />
Ministry of Quebec Daily map of http://www.iqa. Ministry of Environment,<br />
Environment, air quality index mddep.gouv.qc.ca/ Quebec provides daily<br />
Quebec contenu/index_en. air quality and past days<br />
asp#carte values. This information is<br />
accessible on the website<br />
through an interactive map.<br />
Comments: Forecasts are not<br />
available
Type of event Source Geographic Output Website Description<br />
Coverage<br />
Ville de Montreal Maps of air quality index http://ville.montreal. The City of Montréal operates<br />
Montreal and values of PM, CO, ca/portal/page? its own Air Quality Monitoring<br />
NO 2 , O 3 (shown on a pageid= Network. For each station,<br />
graph). Forecast report 7237,74495616& air quality levels are provided<br />
&_dad=portal& Comments: Website is only in<br />
schema=PORTAL French.<br />
Bay area air Bay Area, Daily and forecast Air quality forecast: The Bay Area Air Quality<br />
quality U.S. maps of air quality http://www. Management provides daily<br />
management index and value of sparetheair.org/ information on air quality and<br />
district PM2.5. Bulletins on air Stay-Informed/ 5-days forecasts.<br />
quality incidents Todays-Air-Quality/<br />
Five-Day-Forecast.aspx<br />
Bulletins:<br />
http://www.baaqmd.<br />
gov<br />
PM2.5:<br />
http://gate1.baaqmd.<br />
gov/aqmet/aq.aspx<br />
U.S. U.S. and Real-time and U.S.: EPA AirNow provides real-<br />
Environmental Canada forecast maps of air http://airnow.gov/ time air quality index for the<br />
Protection quality index and major cities of U.S. and parts of<br />
Agency values of O 3 and PM2.5 Canada: Canada. Maps are provided<br />
http://airnow.gov/ via AirNow website and the<br />
index.cfm?action= website offers daily forecasts<br />
airnow.canada as well as real-time air quality<br />
conditions for over 300 cities<br />
across the US, and provides<br />
links to more detailed State<br />
and local air quality web sites.<br />
The Enviroflash notification<br />
service provides air quality<br />
information in real-time to<br />
subscribers by e-mail,<br />
cellphone, pager, allowing<br />
them to take steps to protect<br />
their health in critical<br />
situations.<br />
CAMNET North East Live pictures from http://www. CAMNET provides webcam<br />
Real-time Coast, U.S. webcams, 0 3 and hazecam.net/ live pictures and<br />
pollution and PM levels, wind corresponding air quality<br />
visibility speed conditions from scenic urban<br />
camera and rural vistas in the<br />
network Northeast. CAMNET, brings to<br />
the attention the effects of air<br />
pollution on visibility.<br />
Comments: Values of<br />
pollutants are not available.<br />
Virginia Virginia, Current and http://www.deq. Virginia Department of Air<br />
Department U.S. forecasts of air state.va.us/ Quality monitors levels of<br />
of Air Quality quality index airquality/ ozone and particle pollution<br />
from stations around Virginia<br />
and provides air quality index<br />
for each town. Comments:<br />
Values of pollutants are not<br />
available.<br />
35
36<br />
Type of event Source Geographic Output Website Description<br />
Coverage<br />
Georgia Georgia, Daily Values http://www.air. The Ambient Monitoring<br />
Department U.S. of O 3 , SO 2 , dnr.state.ga.us/ Program measures levels of<br />
of Natural CO, NO 2 , PM10, amp/ air pollutants throughout the<br />
Resources PM2.5 and air State. The data are used to<br />
quality index calculate the Air Quality Index<br />
(also forecasts). and to compare it with air<br />
standards established.<br />
Comments: Forecasts are<br />
available only for air quality<br />
index.<br />
Delaware Air Delaware, Daily maps of air quality http://www.dnrec. Data are collected by air<br />
Quality U.S. index and values of O 3 , state.de.us/air/ quality monitoring stations<br />
Monitoring PM, wind speed and aqm_page/airmont/ distributed in the region. A<br />
Network direction. Air.asp map shows the air quality<br />
index and for each station<br />
location are provided values<br />
of O 3 , PM, wind speed and<br />
direction.Comments: Forecasts<br />
are not provided.<br />
Department Nevada, Air quality information Website: The department provides air<br />
of Conservation U.S. and values of O 3 , PM10 http://ndep.nv.gov/ quality status and trends for<br />
and Natural and PM2.5 and others admin/monitoring.htm the State’s monitoring<br />
Resources jurisdiction. Graphs of the<br />
monitoring data for each<br />
station can be found by<br />
navigating through the<br />
Monitoring Data menu item.<br />
Comments: Forecasts are not<br />
provided.<br />
Arizona Arizona, Daily and forecast Live webcam pictures: Arizona Department of<br />
Department of U.S. values of O 3 , CO, http://www.phoenixvis. Environmental Quality<br />
Environmental PM10, PM2.5 and net/ informs on air quality by<br />
Quality air quality index. providing daily values of<br />
Live images from http://www.azdeq.gov/ pollutants and live webcam<br />
webcams in environ/air/monitoring/ images. Forecasts are<br />
the Phoenix area. links.html provided through a report.<br />
Comments: Daily values are<br />
http://www.azdeq.gov/ provided by US EPA.<br />
environ/air/index.html<br />
Department of Montana, Maps of air quality index http://todaysair.mt.gov/ Air quality of Montana is<br />
Environmental U.S. provided through an<br />
Quality, interactive color coded maps.<br />
Montana For each station a graph of<br />
hourly air quality variations is<br />
shown on the website.<br />
Thresholds are also set for<br />
unhealthy, very unhealthy,<br />
and hazardous conditions.<br />
Comments: Values of<br />
pollutants are not provided.<br />
Idaho Idaho, Daily maps and values http://airquality.deq. For each monitored site, the<br />
Department of U.S. of air quality index, O 3 idaho.gov/ Idaho Department of<br />
Environmental CO, SO 2 , NO 2 , PM Environmental Quality<br />
Quality provides air quality index<br />
maps and the values of<br />
pollutant of concern.<br />
Comments: Information is not<br />
complete for all monitoring<br />
sites
Type of event Source Geographic Output Website Description<br />
Coverage<br />
Florida Florida, Real-time and http://www.dep.state. Through a Java/GIS<br />
Department of U.S. forecast maps of fl.us/air/air_quality/ application map air quality<br />
Environmental air quality index, airdata.htm information is provided, in<br />
Protection O 3 and PM. particular hourly ozone,<br />
particulate matter and air<br />
quality index. Comments:<br />
Values of pollutants are not<br />
available.<br />
Wisconsin Wisconsin, Real-time map of http://dnr.wi.gov/air/ The map provided by<br />
Department of U.S. air quality index and aq/health/status.asp the Wisconsin Department<br />
Natural values of SO, NO 2 , CO, of Natural Resources shows<br />
Resources PM10 and PM2.5. http://prodoasjava. air quality index derived from<br />
dnr.wi.gov/wisards/ ozone and PM2.5 values. The<br />
webreports/previous Air Quality Index is calculated<br />
DaysData.do from real time data.<br />
Additional pollutants are<br />
available as SO, NO 2 , CO,<br />
PM10, provided for each<br />
monitoring site in a table.<br />
Comments: Forecasts are not<br />
provided.<br />
Pima County Tucson, Values of O 3 , wind http://www. The Pima County Department<br />
Department of Arizona, speed, wind direction. airinfonow.org/ of Environmental Quality Air<br />
Environmental U.S. monsites/map_ Info Now web site, provides<br />
Quality site.asp current air quality information<br />
for the metropolitan<br />
Tucson area. The information<br />
can be accessed from an<br />
interactive map, clicking on<br />
each monitoring site a table<br />
opens providing ozone<br />
concentration and wind and<br />
temperature recordings.<br />
Comments: Air quality index<br />
and other relevant pollutants<br />
are not provided, neither<br />
forecasts.<br />
Greater Canada Air quality index http://www. Real-time information on air<br />
Vancouver and forecasts metrovancouver.org/ quality for several locations is<br />
Regional services/air/provided by GVRD. An interactive map<br />
District-GVRD monitoring/Pages/ shows the monitoring stations<br />
airqualityindex.aspx aroundthe Vancouver area.<br />
For each site are provided<br />
graphs of air quality index<br />
and forecasts. Comments:<br />
Values of relevant pollutants<br />
are not provided.<br />
37
38<br />
Type of event Source Geographic Output Website Description<br />
Coverage<br />
Inter Agency U.S. Graphs of air quality http://www.satguard. This web site provides real-<br />
Real-Time index, Real-time com/USFS/realtime/ time smoke concentration<br />
Smoke smoke monitoring. fleet.asp data (along with some other<br />
Particulate meteorological information)<br />
Monitoring from portable smoke<br />
monitors. Historical data from<br />
past monitoring efforts are<br />
also available. The data is<br />
updated hourly with 5-minute<br />
averages from the operating<br />
site. An interactive map is<br />
available on the website from<br />
which users can access<br />
detailed tables of air quality<br />
index. Comments: Note only<br />
9 sites are monitored<br />
throughout the US.<br />
Washington Washington Daily maps of air quality https://fortress.wa An interactive map is available<br />
Department area, U.S. index and values of .gov/ecy/enviwa/ on the website of the<br />
of Ecology pollutant of concern. Default.htm Washington Department of<br />
Ecology. For each site is<br />
provided a graph of the<br />
recording of the pollutant of<br />
concern (O 3 , PM, CO).<br />
Comments: Not all pollutants<br />
are available for all monitoring<br />
stations. In addition, forecasts<br />
are not available.<br />
USDA, Forest U.S. Live webcam images http://www. Forest Service Real-time air<br />
Service Real- and values of air fsvisimages. quality provides live pictures<br />
time air quality quality index, O 3 and com/descriptions.aspx from webcams and<br />
PM10 and PM2.5. corresponding air quality<br />
conditions in the Northeast.<br />
Real-time display panel for<br />
visibility data show the air<br />
pollution and meteorological<br />
conditions associated with<br />
each image. These data are<br />
collected at the site of the<br />
camera or at another location<br />
within the scene of the<br />
photograph. Comments:<br />
Forecasts are not available.<br />
Ministry of Argentina Daily values of O 3 http://www.meteofa. Ministry of Defense, National<br />
Defense, mil.ar/?mod=ozono Meteorological Service<br />
National &id=1 website provides a table with<br />
Meteorological daily values of ozone for Base<br />
Service Vicecomodoro Marambio,<br />
Ushuaia, Comodoro Rivadavia,<br />
Buenos Aires. Comments:<br />
Forecasts are not available.
Type of event Source Geographic Output Website Description<br />
Coverage<br />
INPE, Brazil Brazil Maps of CO, O 3 , NOx, PM, http://meioambiente. INPE produces real-time maps<br />
and Volatil Organic cptec.inpe.br/ of air quality for Brazil, from<br />
Compounds satellite observations. Maps<br />
are produced for fine particles<br />
from fires, carbon monoxide<br />
and industrial and urban<br />
emissions and are updated<br />
every 2 hours. Comments:<br />
The website is available only<br />
in Portuguese.<br />
Secretaria Mexico Hourly maps of air http://www.sma.df. Secretaria del Medio<br />
del Medio City quality index gob.mx/simat/ Ambiente monitors hourly<br />
Ambiente the air quality of Mexico City.<br />
For each monitoring location<br />
is provided a table of major<br />
pollutants and the related air<br />
quality index.<br />
Comments: Website is<br />
available only in Spanish.<br />
Direccion Baja Daily maps of air http://aire. Direccion de Ecologia<br />
de Ecologia California quality index bajacalifornia. provides daily information on<br />
gob.mx/eng/ air quality for different<br />
aqmaps.cfm locations in Baja California.<br />
Information on air quality and<br />
related health effects is<br />
provided for each location.<br />
Comments: Values of<br />
pollutants are not provided,<br />
neither forecasts.<br />
Africa<br />
City of Cape Town, Data provided by http://www.capetown. Reports are available and<br />
Cape Town South Africa request gov.za/airqual/ data can be requested by<br />
air quality email.<br />
network<br />
39
40<br />
Type of event Source Geographic Output Website Description<br />
Coverage<br />
Wild-Fires<br />
ECPC, Global Fire Weather Index http://ecpc.ucsd.edu/ The Experimental Climate<br />
Experimental (FWI) maps forecast d2s/index.html Prediction Center (ECPC) at<br />
Climate for tomorrow, weekly the Climate Research Division,<br />
Prediction and monthly forecast. Scripps Institution of<br />
Centre Oceanography, University<br />
of California, San Diego, in<br />
collaboration with a number<br />
of national and international<br />
researchers, undertakes<br />
research on climate analysis<br />
and predictions, regional<br />
seasonal predictions of<br />
fire danger indices for the US<br />
Forest Service (and global<br />
predictions for the Global Fire<br />
Monitoring Centre, which is<br />
an Activity of the UN<br />
International Strategy for<br />
Disaster Reduction). ECPC<br />
produces forecast maps of fire<br />
weather index for fire early<br />
warning. Comments: ECPC<br />
does not report on active fires.<br />
University of Global Map of active fires http://firefly.geog. Web Fire Mapper displays<br />
Maryland, and information on umd.edu/firms/ active fires detected by the<br />
Webfire temperature and MODIS Rapid Response<br />
Mapper certainty. E-mail System. FIRMS is funded by<br />
notification service NASA and builds on Web Fire<br />
Mapper, a web mapping<br />
interface that displays<br />
hotspots/fires detected by the<br />
MODIS Rapid Response<br />
System and delivers near real-<br />
time hotspot/fire information<br />
and monthly burned area<br />
information to international<br />
users and support fire<br />
managers around the World.<br />
Comments: Webfire Mapper<br />
reports on active fires<br />
worldwide but does not<br />
provide forecast products.
Type of event Source Geographic Output Website Description<br />
Coverage<br />
GFMC, Global Daily/Weekly http://www.fire. The GFMC provides a global<br />
Global Fire information on fires, uni-freiburg.de/ portal for wildland fire<br />
Monitoring satellite images, fire documentation, information<br />
Centre (activity danger map and monitoring and is<br />
by ISDR) publicly accessible through<br />
the Internet. The regularly<br />
updated national to global<br />
wildland fire products of the<br />
GFMC are generated by a<br />
worldwide network of<br />
cooperating institutions. The<br />
online and offline products<br />
collected from several<br />
sources include: <strong>Early</strong> warning<br />
of fire danger and near-real<br />
time monitoring of fire events;<br />
Interpretation, synthesis and<br />
archive of global fire<br />
information. Comments: The<br />
GFMC provides a<br />
comprehensive overview and<br />
amount of material for fire<br />
monitoring and early warning.<br />
Users may find difficult to<br />
browse material in the<br />
website.<br />
North and South America<br />
NOAA SPC, U.S. Fire weather http://www.spc. NOAA SPC provides forest<br />
NOAA Storm forecast maps noaa.gov/products weather forecast maps for US<br />
Prediction and satellite images /fire_wx/ identifying areas under threat<br />
Centre and fire weather outlooks for<br />
http://www.spc. a 3-8 days’ time frame.<br />
noaa.gov/products/<br />
fire_wx/#Day2 The maps can be also overlaid<br />
on satellite images depicting<br />
active fires.<br />
USDA, Forest U.S. Fire Danger maps http://www.wfas.net/ The Wildland Fire Assessment<br />
Service, and forecasts System, is an internet-based<br />
Wildland Fire information system. The<br />
Assessment current implementation<br />
System provides a national view of<br />
weather and fire potential,<br />
including national fire danger<br />
and weather maps and<br />
satellite-derived products, as<br />
daily forest fire danger maps<br />
and 48h forecasts. Comments:<br />
Maps are available in low<br />
resolution and only for U.S.<br />
CFS, Canadian Canada Fire danger maps and http://cwfis.cfs.nrcan. The Canadian Wildland Fire<br />
Forest Service satellite images gc.ca/en_CA/index Information System creates<br />
behaviour maps year-round<br />
and hot spot maps throughout<br />
the forest fire season,<br />
generally between May and<br />
September.<br />
41
42<br />
Type of event Source Geographic Output Website Description<br />
Coverage<br />
Ministry of Argentina Daily fire risk maps Haines index maps: Ministry of Defense, National<br />
Defense, http://www. Meteorological Service<br />
National meteofa.mil.ar/ produces daily maps of<br />
Meteorological ?mod=dpd&id=3 convective fire risk using<br />
Service the Haines Index that is an<br />
Fire risk maps: indicator for the potential<br />
http://www. development of convective<br />
meteofa.mil.ar/ fire activity in dependence<br />
?mod=dpd&id=4 of vertical temperature<br />
and humidity profiles<br />
calculated in the lower,<br />
middle and high atmosphere.<br />
Fire risk maps are produced<br />
based on meteorological data<br />
(temperature, relative<br />
humidity, wind and<br />
precipitation at 18:00 UTC).<br />
Comments: Website is<br />
available only in Spanish.<br />
CPTEC-INPE, South Map of active fires http://sigma.cptec. INPE produces real-time<br />
Centro de America and forecast maps. inpe.br/queimadas maps of wild fires for South<br />
Previsao de /index_in.php America and also Africa. The<br />
Tempo e information is provided by<br />
Estudios interactive maps available on<br />
Climaticos, the website. Forecast maps<br />
Brazil are also available.<br />
Europe<br />
German Germany Fire danger maps http://www.dwd.de/ German Weather Service<br />
Weather bvbw/appmanager/ (Deutscher Wetterdienst -<br />
Service bvbw/dwdwww DWD) provides daily<br />
Desktop?_nfpb=true&_ prediction of forest fire<br />
pageLabel=_dwdwww danger maps.<br />
_spezielle_nutzer_<br />
landwirtschaft_<br />
agrarwetter&<br />
T34201040811665222<br />
16849gsbDocument<br />
Path=Content%2F<br />
Landwirtschaft%2<br />
FWarndienste%2<br />
FWaldbrand%2Fwbx__<br />
teaser.html&_state=<br />
maximized&_window<br />
Label=T342010408116<br />
6522216849&lastPage<br />
Label=_dwdwww_<br />
spezielle_nutzer_<br />
landwirtschaft_<br />
agrarwetter<br />
Finnish Finland Fire danger maps http://virpo.fmi.fi/ The Finnish Meteorological<br />
Meteorological metsapalo_public/ Institute publishes a daily fire<br />
Institute danger map of Finland. The<br />
map is based on the Forest<br />
Fire Index Calculation System.<br />
Comments: The website is in<br />
Finnish
Type of event Source Geographic Output Website Description<br />
Coverage<br />
Australia<br />
National Rural New Map of active fires http://nrfa.fire.org.nz/ Forecasted fire danger is<br />
Fire Authority Zealand and forecast maps. provided daily by the<br />
NRFA. Monthly severity<br />
comparisons is also<br />
provided.<br />
Africa<br />
University South Map of active fires http://www.wamis. Web Fire Mapper displays<br />
of Maryland, Africa co.za/ active fires detected by the<br />
NASA, MODIS Rapid Response<br />
EUMETSAT, System, from a collaboration<br />
CSIR, ESKOM between the NASA Goddard<br />
Space Flight Centre (GSFC)<br />
and the University of<br />
Maryland (UMD). Comments:<br />
Forecast products are not<br />
available.<br />
Zululand Kwazulu Fire danger information http://www.zfps.co.za/ Zululand Fire service provides<br />
Fire Natal weather-links.html links to fire weather<br />
Fire danger index information and an interactive<br />
calculator: fire danger index calculator.<br />
http://www.zfps.co.za/ Comment: Fire danger maps<br />
fdi-calculator.html are not provided.<br />
Asia<br />
Korea Korea Fire danger maps http://forestfire.kfri. Korea Forest Service provides<br />
Research go.kr an information service which<br />
Institute includes the prediction of<br />
forest fire danger. On this web<br />
a daily forest fire danger map<br />
of South Korea is published.<br />
Comments: The website is<br />
available only in Korean.<br />
Malaysian South Fire danger maps http://www.met.gov. Malaysia Meteorological<br />
Meteorological East Asia my/index.php?option Department provides a fire<br />
Department =com_content&task= danger maps. Temperature,<br />
view&id=1556&Itemid humidity and rainfall maps<br />
=1121&lang=english are also provided.<br />
43
44<br />
Type of event Source Geographic Output Website Description<br />
Coverage<br />
Earthquakes<br />
USGS, U.S. Global Seismic parameters (in Alerts in the USGS provides near-real-time<br />
Geological CAP, RSS) and near-real Common Alerting information on location,<br />
Survey time 2D maps and 3D Protocol (CAP): magnitude, depth, of<br />
in Google Earth http://earthquake. earthquakes worldwide. The<br />
usgs.gov/eqcenter/ U.S. Geological Survey (USGS)<br />
recenteqsww/ Earthquake Notification<br />
catalogs/ Service (ENS) alerts<br />
caprss1days2.5.xml subscribed users via email.<br />
Comments: USGS reports on<br />
List of Alerts in earthquakes within minutes.<br />
several formats<br />
(CAP, RSS, Google<br />
Earth): http://<br />
earthquake.usgs.<br />
gov/eqcenter/<br />
recenteqsww/<br />
catalogs/<br />
2D Maps:<br />
http://earthquake.<br />
usgs.gov/eqcenter/<br />
recenteqsww/<br />
Geofon Global Seismic parameters http://www.gfz- The GEOFON/GEVN real-<br />
potsdam. de/geofon/ time data servers acquires<br />
new/rt.html data from a virtual broadband<br />
seismic network which is<br />
http://geofon.gfz- composed of GEOFON<br />
potsdam.de/db/ stations and many stations<br />
eqinfo.php from international partner<br />
networks. The data is also redistributed<br />
in real-time to the<br />
public. It is also archived in<br />
the GEOFON Data Archive for<br />
backup purposes and made<br />
available from there to the<br />
users by the normal archive<br />
data request tools. Comments:<br />
Geofon reports on<br />
earthquakes within minutes.<br />
<strong>Early</strong> warning for this reason<br />
is not possible.<br />
Europe<br />
CRdC AMRA, Naples, Alerts to users Gasparini P., Barberi F., A seismic early warning<br />
Competence Italy Belli A.: <strong>Early</strong> <strong>Warning</strong> system for the protection of<br />
Center of of Volcanic eruptions the Neapolitan area is under<br />
Campania and Earthquakes in development. The early<br />
Region, the neapolitan area, warning system would<br />
Environmental Campania Region, provide tens of seconds of<br />
Risk Analysis South Italy, warning time available for<br />
and Monitoring Proceedings of the seismic risk mitigation before<br />
second international ground shaking initiates<br />
warning, Bonn, 16-18 in Naples. Comments: The<br />
October 2003. system is still under<br />
development. Information<br />
is not publicly available, but<br />
only to users.
Type of event Source Geographic Output Website Description<br />
Coverage<br />
Ignalina Lithuania Shut down the Wieland, M., Griesser, An EWS has been installed at<br />
Power Plant reactor L., and Kuendig, C., the Ignalina Nuclear Power<br />
Sesmic <strong>Early</strong> <strong>Warning</strong> Plant in Lithuania (Wieland,<br />
System For a Nuclear 2000). The system consists of<br />
Power Plant. six seismic stations encircling<br />
Proceedings of the the Nuclear Power Plant at a<br />
“12th World distance of 30 km and a<br />
Conference on seventh station at the power<br />
Earthquake plant. The system will shut<br />
Engineering– down the reactor before a<br />
12WCEE” Auckland, hazardous earthquake might<br />
New Zealand, 2000. occur in the vicinity of the<br />
Nuclear Power Plant.<br />
Comments: Information is not<br />
publicly available, but only to<br />
users.<br />
University Romania, Alerts to users Wenzel F., Oncescu The EWS for the protection of<br />
of Bucharest Bucharest M.C., Baur M., Bucharest, Romania. provides<br />
Fiedrich F., Ioncescu a warning time of about 25-30<br />
C., An early warning seconds for the urban area of<br />
system for Bucharest, Bucharest located at 130 Km<br />
Seismological from the epicentral area<br />
Research Letters (Wenzel et al., 1999).<br />
70:2:161-169, 1999. Comments: Information is not<br />
publicly available, but only to<br />
users.<br />
Bogazici Istanbul Alerts sent to users Erdik M., Istanbul Rapid Response and <strong>Early</strong><br />
University, (such as power and Earthquake <strong>Early</strong> <strong>Warning</strong> system is in<br />
Department of gas companies, warning and operation in the metropolitan<br />
Earthquake nuclear research Rapid response area of Istanbul. Ten strong<br />
Engineering, facilities, critical system, Proc. Of motion stations were installed<br />
Istanbul chemical factories, Workshop on as close as possible to the<br />
subway system and earthquake early fault zone. Data is<br />
several high-rise warning, CalTech, continuously ollected from<br />
buildings) Pasadena, 13-15 these stations via digital radio<br />
July 2005. modem to provide early<br />
warning for potentially<br />
disastrous earthquakes.<br />
Whenever 2 stations detect a<br />
shaking intensity value that<br />
exceeds the threshold, the first<br />
alarm is issued. <strong>Early</strong> warning<br />
signals will be communicated<br />
to the users by UHF systems.<br />
Comments: Information is not<br />
publicly available, but only to<br />
users.<br />
Asia<br />
SDR, Asia, Stopping of the http://www.sdr.co The system is operated by<br />
System and Japan high velocity .jp/eng_page/ SDR which is the producer<br />
Data Research Shinkansen index2_e.html of UrEDAS (Urgent Earthquake<br />
Co., Ltd. railway line. Detection and Alarm System)<br />
instruments able to detect a<br />
seismic event and issue an<br />
alarm. The system issues an<br />
alarm if the acceleration of the<br />
ground motion exceeds a pre-<br />
defined threshold level and<br />
immediately, the high velocity<br />
Shinkansen railway is stopped.<br />
Comments: Information is not<br />
publicly available.<br />
45
46<br />
Type of event Source Geographic Output Website Description<br />
Coverage<br />
TGC, Tokyo Asia, Interruption of Tokyo Gas annual Tokyo Gas has developed a<br />
Gas Co., Ltd Japan, gas supply report 1999, Safety. safety system to ensure stable<br />
Tokyo supply in the event of an<br />
earthquake or other disaster.<br />
The goal is to prevent<br />
secondary damage such as<br />
fires and explosions<br />
consequences of earthquakes.<br />
Comments: Information is not<br />
publicly available.<br />
Central Taiwan Alerts sent to users Wu, Y. M., T. C. Shin An EWS for Taiwan has been<br />
Weather and Y. B. Tsai, Quick implemented as part the<br />
Bureau and reliable “Taiwan Rapid Earthquake<br />
determination of Information Release System<br />
magnitude for -TREIRS” which has been<br />
seismic early developed by Central Weather<br />
warning, Bull. Bureau in 1995.<br />
Seismol. Soc. Am. Comments: Information is not<br />
88, 1254- 1259. publicly available.<br />
1998.<br />
JMA, Japan Japan Alerts to universities, Horiuchi, S., H. Within a few seconds from the<br />
Meteorological private organizations Negishi, K. Abe, A. first trigger based on the<br />
Agency and the public Kimimura, and Y. first seconds of observation,<br />
Fujinawa. An location and magnitude are<br />
automatic calculated. The central<br />
processing system processing stations are<br />
for broadcasting located at JMA Tokyo and<br />
earthquake alarms. Tsukuba Information Center.<br />
Bulletin of Through a dedicated line and<br />
Seismological Society wireless communication<br />
of America, BSSA, system the information is<br />
Submitted, 2004. transmitted to users.<br />
Since October 2007, the<br />
http://www.jma.go.jp/ warnings are transmitted<br />
en/quake/ through media like TV and<br />
radio and are used for<br />
other applications such as<br />
promptly slowing down trains,<br />
controlling elevators to avoid<br />
danger and enabling people<br />
to quickly protect themselves.<br />
North and South America<br />
More information at:<br />
www.bousai.go.jp/kyoryoku/<br />
soukikeikai.pdf<br />
CIRES, Mexico, Alerts to residents Espinosa-Aranda JM, The system has been installed<br />
Centro de Mexico and authorities Jimenez A, Ibarrola G, in 1991 for the protection<br />
Instrumentacion City Alcantar F, Aguilar A, of Mexico City. The system<br />
y Registro Mexico City Seismic issues alerts to residents and<br />
Sismico Alert System. authorities. Evacuation alerts<br />
Seismogical are issued in case of<br />
Research Letters damaging earthquakes with<br />
66: 42-53, 1995. magnitude exceeding a<br />
critical threshold. The system<br />
started in 1991 in<br />
experimental mode for<br />
schools’ alert and stopping<br />
the metropolitan subway<br />
system. Only several years<br />
later it became a public<br />
service.
Type of event Source Geographic Output Website Description<br />
Coverage<br />
Tsunamis<br />
CalTech, UC California Magnitude and http://www.elarms Allen and Kanamori (2003)<br />
Berkeley location estimates .org developed ElarmS an early<br />
Allen, R.M. and warning methodology for<br />
Kanamori, H., The Southern California. Within<br />
Potential for seconds after the earthquake<br />
Earthquake <strong>Early</strong> origin Elarms is able to<br />
<strong>Warning</strong> in estimate the earthquake<br />
Southern magnitude and location, to<br />
California, Science, provide early warning of few<br />
300, 786-789, 2003. to tens of seconds in case of<br />
damaging seismic event.<br />
Comments: The system has<br />
not been implemented yet.<br />
Seismologists across California<br />
are testing Elarms.<br />
UNESCO-IOC, Global Tsunami warnings http://www.unesco.org/ After forty years of experience<br />
United Nations and advisories new/en/natural- coordinating the Pacific<br />
Educational sciences/ioc-oceans/ Tsunami <strong>Warning</strong> System<br />
Scientific and sections-and- (PTWS), UNESCO-IOC is<br />
Cultural programmes/tsunami/ leading a global effort to<br />
Organization- establish ocean-based<br />
Intergovern- http://itic.ioc-unesco. tsunami warning systems. The<br />
mental org/ website integrates<br />
Oceanographic information from different<br />
Commission sources and provides tsunami<br />
warnings and other technical<br />
information.<br />
PTWS, Pacific Tsunami Bulletins. http://ptwc.weather The Pacific Tsunami <strong>Warning</strong><br />
Pacific Email and SMS .gov/ Center (PTWC) serves as the<br />
Tsunami alert service operational headquarters<br />
<strong>Warning</strong> for the Pacific Tsunami<br />
System <strong>Warning</strong> System in the Pacific<br />
(PTWS). The Pacific basin<br />
is monitored by the Pacific<br />
Tsunami <strong>Warning</strong> System<br />
(PTWS) which was established<br />
by 26 Member States and is<br />
operated by the PTWC,<br />
located near Honolulu, Hawaii.<br />
PTWC monitors stations<br />
throughout the Pacific basin<br />
to issue tsunami warnings to<br />
Member States, serving as the<br />
regional center for Hawaii and<br />
as a national and international<br />
tsunami information center.<br />
The system disseminates<br />
tsunami information and<br />
warning messages to over<br />
100 points across the Pacific.<br />
Comments: PTWS website<br />
provides also tsunami<br />
bulletins for Hawaii, and ad<br />
interim for: Indian Ocean,<br />
and Caribbean. Note SMS<br />
service is available for some<br />
Pacific, Asian, and African<br />
countries.<br />
47
48<br />
Type of event Source Geographic Output Website Description<br />
Coverage<br />
Volcanic Eruptions<br />
HKO, Hong Kong Tsunami information http://www.hko.gov. HKO tsunami warning system<br />
Hong Kong (recorded sea level hk/gts/equake/ consists in monitoring the<br />
Observatory change, seismic tsunami_mon_e.htm warning messages issued by<br />
parameters) the Pacific Tsunami <strong>Warning</strong><br />
Centre (PTWC). In addition<br />
to it the sea water levels<br />
recorded by tide gauges in<br />
Hong Kong are observed and<br />
monitored. In the event of a<br />
tsunamigenic earthquake<br />
affecting Hong Kong, the HKO<br />
will issue a tsunami warning<br />
to the public. The maximum<br />
sea level change recorded in<br />
the past years has been 0.3 m.<br />
JMA, Japan Japan Tsunami warnings http://www.jma.go. When an earthquake occurs<br />
Meteorological and advisories jp/en/tsunami/ with potential of generating<br />
Agency tsunamis, JMA issues tsunami<br />
forecasts within 3 minutes<br />
after the occurrence of the<br />
earthquake. In case tsunamis<br />
are originated by seismic<br />
events far from Japan,<br />
JMA takes a coordinated<br />
action with the Pacific<br />
Tsunami <strong>Warning</strong> Center<br />
(PTWC) in Hawaii and issues<br />
forecasts for the long-<br />
propagating tsunamis.<br />
Global Global Reports and warnings http://www.volcano. The Global Volcanism Program<br />
Volcanism si.edu/reports/usgs/ is a joint collaborative effort<br />
Program between Smithsonian<br />
(USGS, U.S. and USGS. Weekly and<br />
Geological monthly bulletins are released<br />
Survey and on the website. Volcanic<br />
Smithsonian activity information is<br />
Institution) collected from worldwide<br />
volcanic observatories<br />
participating to the Global<br />
Volcanism Program.<br />
Comments: Not all volcanic<br />
activities are reported on the<br />
website, only when changes in<br />
volcanic activity occur.
Type of event Source Geographic Output Website Description<br />
Coverage<br />
North and South America<br />
MVO, Carribean, Reports and warnings http://www.mvo.ms/ MVO monitors volcanic<br />
Monserrat Monserrat activity through by<br />
Volcano continuously monitoring<br />
Observatory the seismic activity associated<br />
with the volcano. The seismic<br />
network has been upgraded<br />
to include 10 broadband, high<br />
dynamic range instruments<br />
with fully digital telemetry.<br />
The signals are received at the<br />
MVO and daily or monthly<br />
reports on volcano activity,<br />
and hazard assessment are<br />
released. Comments:<br />
Frequency of these reports<br />
depends on the level of<br />
activity of the volcano.<br />
University of America, Reports and warnings http://www.uwiseismic The Seismic Research Unit has<br />
West Indies West Indies .com/General.aspx established a monitoring<br />
Seismic Research ?id=46 network and warning system<br />
Unit specifically for Kick ‘em Jenny,<br />
a submarine volcano located<br />
near Grenada island. The main<br />
purpose of this is to provide<br />
warning to shipping in the<br />
vicinity.<br />
Observatorio Mexico Reports and warnings http://www.colima- Reports are released on a daily<br />
Vulcanologico estado.gob.mx/ basis together with pictures<br />
Universidad de seguridad/indvolcan from the volcano de fuego in<br />
Colima .php Colima. Comments: The<br />
webpage is available only in<br />
Spanish.<br />
Instituto Guatemala Reports and warnings http://www.insivumeh. Instituto Nacional de<br />
Nacional de gob.gt/principal/ Sismologia, Vulcanologia,<br />
Sismologia, alertas.htm Meteorologia y Hidrologia<br />
Vulcanologia, releases daily bulletins of<br />
Meteorologia http://www.insivumeh. volcanic activity and special<br />
y Hidrologia gob.gt/geofisica/ bulletins are available in case<br />
INSIVUMEH especial.htm of an emergency. Comments:<br />
The webpage is available only<br />
http://www.insivumeh. in Spanish<br />
gob.gt/geofisica/<br />
boletin%20formato<br />
.htm<br />
Servicio El Salvador Reports and warnings http://www.snet. Servicio Nacional de Estudios<br />
Nacional de gob.sv/ver/ Territoriales (SNET) provides<br />
Estudios vulcanologia/ special bulletins on volcanic<br />
Territoriales informes+especiales/ activity, available on the<br />
(SNET) website. Comments: The<br />
Ministerio De webpage is available only in<br />
Medio Ambiente Spanish<br />
y Recursos<br />
Naturales<br />
49
50<br />
Type of event Source Geographic Output Website Description<br />
Coverage<br />
Instituto Nicaragua Reports and warnings http://www.ineter Instituto Nicaraguense<br />
Nicaraguense .gob.ni/ de Estudios Territoriales<br />
de Estudios (INETER) website provides<br />
Territoriales access to volcanic activity<br />
(INETER) information, condensed into<br />
Volcanology short reports. Live webcam<br />
Department images are also available.<br />
Comments: The webpage is<br />
available only in Spanish<br />
Observatorio Costa Rica Reports and <strong>Warning</strong>s http://www.ovsicori. Observatorio Vulcanológico y<br />
Vulcanológico una.ac.cr/ Sismológico de Costa Rica<br />
y Sismológico provides online access to<br />
de Costa Rica news reports on volcanic<br />
Universidad activity of volcanoes in Costa<br />
Nacional Rica. Comments: The webpage<br />
(OVSICORI-UNA) is available only in Spanish<br />
Instituto de Colombia Reports and <strong>Warning</strong>s http://www.ingeominas Instituto de Investigaciones<br />
Investigaciones .gov.co/Observatorios- en Geociencias provides daily<br />
en Geociencias, Vulcanologicos.aspx bulletins of volcanic activity<br />
Mineria y for Colombia, available on the<br />
Quimica website. Comments: The<br />
(INGEOMINAS) webpage is available only in<br />
Spanish<br />
Mount Erebus Mount Temperature, wind http://erebus.nmt.edu/ Mount Erebus Volcano<br />
Volcano Erebus, Speed, deformation, Observatory provides<br />
Observatory Antarctica humidity information on temperature,<br />
Department of wind speed, deformation, and<br />
Earth & humidity and other<br />
Environmental information of Mount<br />
Science Erebus volcano. Last 2 days<br />
New Mexico and 30 days graphs are<br />
Institute of also available.<br />
Mining and<br />
Technology<br />
Japan Japan Reports and <strong>Warning</strong>s http://www.jma.go. The Japan Meteorological<br />
Meteorological jp/en/volcano/ Agency provides online access<br />
Agency to volcanic activity reports and<br />
color coded advisories, as well<br />
as forecasts. Ash monitoring<br />
and alerts for aviation is also<br />
available on the website.<br />
Comments: Reports are<br />
updated weekly.<br />
Institute of New Reports and <strong>Warning</strong>s http://geonet.org.nz/ In New Zealand volcano<br />
Geological & Zealand volcano/ surveillance is undertaken by<br />
Nuclear the GeoNet project in<br />
Sciences Ltd collaboration with two<br />
GeoNet Project Regional Councils who<br />
operate volcano-seismic<br />
networks. GeoNet project of<br />
the Institute of Geological &<br />
Nuclear Sciences (GNS) issues<br />
alert bulletins for public,<br />
media and research.
Type of event Source Geographic Output Website Description<br />
Coverage<br />
Landslides<br />
Droughts<br />
Philippine Philippines Reports and <strong>Warning</strong>s http://www.phivolcs Philippine Institute of<br />
Institute of .dost.gov.ph/index.php Volcanology and Seismology<br />
Volcanology ?option=com_content maintains and operates<br />
and &view=category&id= volcano systems for<br />
Seismology 70&Itemid=500008 monitoring and forecasting<br />
purposes. The institute<br />
assesses volcanic activity and<br />
then provides volcanic<br />
activities alerts to the public,<br />
and to local and international<br />
scientific communities. For<br />
each volcano is also available<br />
an archive of past advisories.<br />
International Global Map and reports http://icl.iplhq.org/ The International Consortium<br />
Consortium of landslides on Landslides (ICL) created at<br />
on Landslides Recent landslides: the Kyoto Symposium in<br />
http://landslides.usgs. January 2002 is an<br />
gov/recent/ International nongovernmental<br />
and nonprofit<br />
scientific organization,<br />
which is supported by several<br />
international organizations as<br />
UNESCO, WMO, FAO, UN/ISDR<br />
etc. ICL website provides a link<br />
to worldwide landslides<br />
information, thorugh USGS<br />
website. Comments: ICL does<br />
not provide forecasts on<br />
landslides.<br />
BENFIELD Global Monthly maps on http://drought.mssl.ucl. The Global Drought Monitor<br />
HAZARD drought current ac.uk/drought.html? provides maps and short<br />
RESEARCH conditions map=%2Fwww%2F reports on countries facing<br />
CENTRE drought%2Fweb_ exceptional drought<br />
pages%2Fdrought. conditions. The information<br />
map&program=%2 is updated on a monthly basis.<br />
Fcgi-bin%2Fmapserv Hydrological drought<br />
&root=%2Fwww% conditions are displayed<br />
2Fdrought2%2F& based on two drought indices<br />
map_web_image called the Standardised<br />
path=%2Ftmp%2F& Precipitation Index (SPI) and<br />
map_web_imageurl the Palmer Drought Severity<br />
=%2Ftmp%2F&map Index (PDSI). Comments: The<br />
_web_template=% Global Drought Monitor<br />
2Fdrought.html provides an overall drought<br />
picture with ~100 Km spatial<br />
scale, local conditions may<br />
erroneously represented.<br />
Drought forecasts are not<br />
provided. For this reason<br />
droughts early warning is not<br />
possible.<br />
51
52<br />
Type of event Source Geographic Output Website Description<br />
Coverage<br />
FAO, Food and Global Reports, e-mails http://www.fao.org/ GIEWS monitors the food<br />
Agriculture and map of giews/english/ supply and demand, provides<br />
Organization, countries facing index.htm emergency response in case<br />
Global food insecurity. of human or natural induced<br />
Information http://www.fao.org/ disasters, informing policy<br />
and <strong>Early</strong> giews/english/ makers with periodical<br />
<strong>Warning</strong> giews_en.pdf reports, available through<br />
System on GIEWS webpage and an<br />
Food and e-mail service. Comments:<br />
Agriculture Reports are not specifically<br />
(GIEWS) focused on drought<br />
conditions and are released<br />
monthly or less frequently.<br />
U.S. Drought U.S. Maps on drought, http://drought.unl.edu/ North America Drought<br />
Monitor (a current condition MonitoringTools/ Monitor provides weekly<br />
collaboration maps and forecast USDroughtMonitor.aspx drought maps which<br />
between USDA, drought products integrate multiple indices,<br />
NOAA, Climate http://droughtmonitor. satellite data products and<br />
Prediction unl.edu/ experts’ opinions. Several<br />
Center and forecast products are also<br />
National http://www.cpc.ncep provided, such as: climate<br />
Drought .noaa.gov/products/ outlooks, seasonal drought<br />
Mitigation expert_assessment/ outlook, streamflow forecast<br />
Center at seasonal_drought.html maps, forecast Palmer<br />
University drought severity index, soil<br />
of Nebraska) moisture forecast maps.<br />
Comments: Advantages<br />
are represented by the<br />
availability of both drought<br />
current conditions and<br />
forecast maps. The<br />
disadvantage is represented<br />
by a reduced geographical<br />
coverage, maps are limited<br />
only to U.S.<br />
FEWS, Famine South, East Reports on food http://www.fews.net/ FEWS NET is a collaborative<br />
<strong>Early</strong> <strong>Warning</strong> and West insecurity effort of USGS, USAID, NASA,<br />
System Africa, and NOAA. FEWS net reports<br />
Central on food insecurity conditions<br />
America, and issues watches and<br />
Caribbean, warnings to decision makers,<br />
Central Asia which are also available on the<br />
and Middle website. Comments: FEWS<br />
East informs on current situation<br />
of countries facing food<br />
insecurity and is not<br />
specifically focused on<br />
droughts.<br />
EC-JRC, Europe Maps of soil moisture http://desert.jrc.ec. JRC’s Action DESERT is<br />
European europa.eu/action/php/ developing a European<br />
Commission index.php?action=view Drought Observatory (EDO)<br />
Joint Research &id=201 for drought forecasting,<br />
Center Institute assessment and monitoring.<br />
for Environment Currently, EC-JRC provides<br />
and Sustainability publicly available daily soil<br />
moisture maps of Europe;<br />
precipitation, vegetation<br />
response and others, through<br />
a portal. Comment: The<br />
Drought Observatory is still<br />
under development.
Type of event Source Geographic Output Website Description<br />
Coverage<br />
Floods<br />
BCC, Beijing China Daily maps on http://bcc.cma.gov Beijing Climate Center (BCC)<br />
Climate droughts current .cn/en/ monitors drought conditions<br />
Center of conditions for China. Drought report<br />
the China and a map on current drought<br />
Meteorological conditions are produced<br />
Administration daily and made available on<br />
their website, based on<br />
precipitation and soil<br />
moisture monitoring from an<br />
agricultural meteorological<br />
station network and remote-<br />
sensing-based monitoring<br />
from CMA’s National Satellite<br />
Meteorological Center.<br />
Comment: Forecasts are not<br />
provided.<br />
Dartmouth Global Map of current floods http://flood The Dartmouth Flood<br />
Flood observatory.colorado Observatory detects, maps,<br />
Observatory .edu/ and measures major flood<br />
events world-wide using<br />
http://flood satellite remote sensing.<br />
observatory.colorado Maps, predictions, estimated<br />
.edu/Archives/index discharge and severity of the<br />
.html flood are provided for each<br />
event. Comments: Flood<br />
information is provided for<br />
current floods, but forecasts<br />
are not available.<br />
IFnet Global Precipitation amount http://www. IFnet, through the Global<br />
maps and flood reports internationalflood Flood Alert System (GFAS)<br />
network.org/ uses global satellite<br />
03_f_info.html precipitation estimates for<br />
flood forecasting and<br />
http://gfas. warning. GFAS converts the<br />
internationalflood satellite precipitation<br />
network.org/ estimates from NASA into<br />
gfas-web/ global rainfall maps, and<br />
precipitation probability<br />
estimates. Comments: IFnet is<br />
running on a trial basis.<br />
Europe<br />
EFAS, Europe Information on http://efas-is.jrc.ec. Launched in 2003, EFAS has<br />
European ongoing floods europa.eu/ been working on an<br />
Flood Alert and forecasts experimental basis since 2005,<br />
System with the plan to be fully<br />
operational in 2012. The EFAS<br />
provides early flood warnings<br />
to national members and the<br />
European Commissionin order<br />
to mitigate flood impact on<br />
population. Comments: EFAS<br />
is working on experimental<br />
basis.<br />
53
54<br />
Type of event Source Geographic Output Website Description<br />
Coverage<br />
North and South America<br />
NOAA U.S. River observations River gauges: NOAA provides river’s level<br />
and forecasts http://water.weather measurements from river<br />
.gov/ahps/ gauges, it provides also other<br />
information on current river<br />
conditions, and forecasts.<br />
Severe Weather, Storms Cyclones, Hurricanes<br />
WMO, World Global Maps of tropical http://severe. World Weather Watch,<br />
Meteorological cyclones, heavy worldweather.org/ operated by WMO,<br />
Organization rain/snow, provide global collection,<br />
thunderstorms, World Weather analysis and distribution of<br />
cloudiness and rain Watch (WWW): weather observations,<br />
http://www.wmo. forecasts and warnings.<br />
ch/pages/prog/ WWW is an operational<br />
www/ ; http:// framework of coordinated<br />
www.worldweather national systems, operated<br />
.org/ by national governments.<br />
website. The WMO Tropical<br />
World Meteorological Cyclone Program, part of<br />
Organization Tropical WWW, has established<br />
Cyclone Programme: tropical cyclone committees<br />
http://www.wmo.ch/ that extend across the<br />
pages/prog/www/ regional bodies (Regional<br />
tcp/index_en.html Specialized Meteorological<br />
Centres (RSMC) which,<br />
together with National<br />
Meteorological and<br />
Hydrological Services<br />
(NMHSs), monitor tropical<br />
cyclones globally and issue<br />
official warnings to the<br />
Regional Meteorological<br />
Services of countries at risk.<br />
This information is publicly<br />
available on WMO website<br />
through warnings and maps.<br />
National Eastern Maps actual and http://www.nhc. National Hurricane Center-<br />
Hurricane Pacific predicted tracks. noaa.gov/ NOAA provides and online<br />
Center-NOAA and Atlantic Values of time, access to maps of hurricanes<br />
location, speed, (location and tracks) and<br />
wind. Wind speed advisories are issued. A new<br />
probabilities. product released by National<br />
Email service. Hurricane Center-NOAA is the<br />
wind speed probability<br />
information. NHC’s tropical<br />
cyclone text products are<br />
available by email.<br />
University of Global Maps actual and http://www.solar.ifa. University of Hawaii provides<br />
Hawaii predicted tracks. hawaii.edu/Tropical/ online access to maps of<br />
Values of time, tropical.html tropical storms together with<br />
location, speed, wind. values of time, location, speed<br />
and wind together with strike<br />
probabilities. This information<br />
is collected from several<br />
sources.
Type of event Source Geographic Output Website Description<br />
Coverage<br />
Epidemics<br />
Asia<br />
Hong Kong Hong Kong, Maps of tropical http://www.hko.gov. Whenever a tropical cyclone<br />
Observatory Asia cyclones and <strong>Warning</strong>s hk/informtc/ warning signal is issued,<br />
informtc.htm bulletins are issued on the<br />
website for distribution to<br />
the mass media and for<br />
immediate broadcast by radio<br />
and television stations. The<br />
Hong Kong Observatory also<br />
operates an automatic<br />
telephone answering service<br />
“Dial-a-weather” to provide<br />
similar information.<br />
WHO, World Global Alerts to international http://www.who.int/ WHO through The Global<br />
Health community on threat csr/outbreaknetwork/ Outbreak Alert and Response<br />
Organization of outbreaks and online en/ Network provides real-time<br />
disease outbreak news. information and dissemination<br />
Disease outbreak on disease outbreaks, that<br />
news: http://www. are of international<br />
who.int/csr/don/en/ importance. The Network<br />
provides an operational<br />
framework to link this<br />
expertise and skill to keep the<br />
international community<br />
constantly alert to the threat<br />
of outbreaks and ready to<br />
respond.<br />
European Centre Europe Online disease http://www.ecdc. The ECDC works in<br />
for Disease outbreak news. europa.eu/en/Pages/ partnership with national<br />
Prevention and home.aspx health protection bodies<br />
Control, ECDC across Europe to strengthen<br />
and develop continent-wide<br />
disease surveillance and early<br />
warning systems. Currently,<br />
ECDC provides online access<br />
to authoritative scientific<br />
reports about the risks posed<br />
by new and emerging<br />
infectious diseases.<br />
Comments: News information<br />
is restricted to Europe.<br />
U.S. Centre U.S. Online disease http://www.cdc.gov/ Department of Helath and<br />
for Disease outbreak news outbreaks/index.html Human Services, Centre for<br />
Control, CDC and e-mail alerts Disease Control provides<br />
information on disease,<br />
agents and other threats<br />
reporting online the key facts,<br />
prevention measures and<br />
current situation. Comments:<br />
News information is mainly<br />
focused on U.S.<br />
55
56<br />
Type of event Source Geographic Output Website Description<br />
Coverage<br />
Avian Flu<br />
Animal Diseases<br />
Malaria<br />
WHO Global Online disease http://www.who.int/ The system supports disease<br />
outbreak news csr/disease/avian_ tracking, sharing information<br />
influenza/en/ and aid operations. Avian<br />
influenza news are published<br />
online into short reports.<br />
FAO, OIE Global maps and short outbreak http://www.glews.net/ Since July 2006, the Global<br />
and WHO reports online <strong>Early</strong> <strong>Warning</strong> and Response<br />
System for Major Animal<br />
Diseases, including Zoonoses<br />
(GLEWS) monitors outbreaks<br />
of major animal diseases,<br />
including zoonoses,<br />
worldwide.<br />
IRI Africa Map of malaria risk http://iridl.ldeo. IRI provides rainfall anomalies<br />
columbia.edu/ which it may provide insights<br />
maproom/.Health/ on malaria risk. The map is<br />
.Regional/.Africa/ produced on a biweekly basis.<br />
.Malaria/.MEWS/ Comments: The malaria risk<br />
map is based purely on<br />
climatic constraints to malaria<br />
transmission, and does not<br />
account for areas in the<br />
northern and southern<br />
margins of the African<br />
continent where control has<br />
eliminated malaria risk. Alerts<br />
service is not provided.<br />
Wellcome Trust, Global Maps http://www.map. Malaria Atlas Project (MAP)<br />
the Global Fund ox.ac.uk/ provides malaria map<br />
to Fight AIDS, products to all users under<br />
Tuberculosis and the Creative Commons<br />
Malaria, the Attribution 3.0 Unported<br />
University of License and can be<br />
Oxford-Li Ka downloaded from the MAP<br />
Shing Foundation site.<br />
Global Health<br />
Programme and<br />
others
Type of event Source Geographic Output Website Description<br />
Coverage<br />
Famine<br />
FEWS, Famine South, East Reports on food http://www.fews.net/ FEWS NET is a collaborative<br />
<strong>Early</strong> <strong>Warning</strong> and West insecurity effort of USGS, USAID, NASA,<br />
System Africa, and NOAA. FEWS NET reports<br />
Central on food insecurity conditions<br />
America, and issues watches and<br />
Caribbean, warnings to decision makers,<br />
Central Asia which are also available on the<br />
and Middle website. Comments: FEWS<br />
East informs on current situation of<br />
countries facing food<br />
insecurity but it does not<br />
report forecasts. For this<br />
reason early warning is not<br />
possible.<br />
FAO, Food Global Reports, e-mails and http://www.fao.org/ GIEWS monitors the food<br />
and map of countries facing giews/english/ supply and demand, provides<br />
Agriculture food insecurity. index.htm emergency response in case<br />
Organization, of human or natural induced<br />
Global http://www.fao.org/ disasters, informing policy<br />
Information giews/english/ makers with periodical<br />
and <strong>Early</strong> giews_en.pdf reports, available through<br />
<strong>Warning</strong> GIEWS webpage and an<br />
System on e-mail service. Comments:<br />
Food and Reports are released monthly<br />
Agriculture or less frequently.<br />
(GIEWS)<br />
WFP, World Global Emergency reports, http://www.wfp.org/ On WFP website information<br />
Food briefing notes, food-security on current situation of food<br />
Program photo galleries. crisis worldwide is available<br />
http://www.wfp.org/ through briefing notes,<br />
food-security/ reports and photo galleries.<br />
assessment-bank The Vulnerability Analysis and<br />
Mapping Branch (VAM)<br />
provides WFP decision makers<br />
with the information<br />
necessary to design and<br />
implement its operations.<br />
The role of VAM is, therefore,<br />
to identify populations that<br />
not only require food<br />
assistance, but also how WFP<br />
support can be tailored to<br />
make a difference in peoples<br />
lives and their livelihoods.<br />
Comments: Reports on<br />
countries facing food<br />
insecurity. In the VAM website<br />
information is not updated<br />
frequently, some reports are 2<br />
years old.<br />
Food Security East Africa Maps and monthly http://www.disaster FSNWG supported by the EC<br />
and Nutrition updates riskreduction.net/ provides a platform for DRR in<br />
Working Group the Region. It provides on its<br />
(FSNWG) website maps and updates on<br />
food insecurity in the Region.<br />
57
This glossary is compiled from citations in different<br />
chapters, and draws from glossaries and other resources<br />
available: United Nations Environment Programme (<strong>UNEP</strong>)<br />
Global Environment Outlook, <strong>UNEP</strong> list of acronyms and<br />
glossary terms, UN ISDR Terminology on Disaster Risk<br />
Reduction, University of Princeton, University of Naples<br />
“Federico II”, OASIS Standards, National Oceanic and<br />
Atmospheric Organization (NOAA), U.S. Environmental<br />
Protection Agency (EPA), United Nations Framework<br />
Convention for Climate Change (UNFCCC), United Nations<br />
Convention to Combat Desertification (UNCCD), Convention<br />
on Biological Diversity (CBD), UN-Habitat.<br />
Adaptation<br />
(1) Actions taken to help communities and ecosystems cope<br />
with changing climate conditions (UNFCCC). (2) Genetically<br />
determined characteristic that enhances the ability of an<br />
organism to cope with its environment (CBD).<br />
Aerosols<br />
A collection of airborne solid or liquid particles, with a<br />
typical size between 0.01 and 10 μm, that reside in the<br />
atmosphere for at least several hours. Aerosols may be of<br />
either natural or anthropogenic origin.<br />
Air quality<br />
Smog is the product of human and natural activities such as<br />
industry, transportation, wild-fires, volcanic eruptions, etc.<br />
and can have serious effects on human health and<br />
the environment.<br />
U.S. EPA uses and Air Quality Index (AQI) which is<br />
calculated on five major air pollutants regulated by the<br />
Clean Air Act: ground-level ozone, particle pollution (also<br />
known as particulate matter), carbon monoxide, sulfur<br />
dioxide, and nitrogen dioxide. For each of these pollutants,<br />
EPA has established national air quality standards to protect<br />
public health .Ground-level ozone and airborne particles are<br />
the two pollutants that pose the greatest threat to human<br />
health in this country.<br />
Biodiversity<br />
The variety of life on Earth, including diversity at the genetic<br />
level, among species and among ecosystems and habitats.<br />
It includes diversity in abundance, distribution and in<br />
behaviour. Biodiversity also incorporates human cultural<br />
diversity, which can both be affected by the same drivers as<br />
biodiversity, and itself has impacts on the diversity of genes,<br />
other species and ecosystems.<br />
Biofuels<br />
Fuel produced from dry organic matter or combustible oils<br />
from plants, such as alcohol from fermented sugar, black<br />
liquor from the paper manufacturing process, wood and<br />
soybean oil.<br />
58<br />
Glossary<br />
Biomass<br />
Organic material, both above ground and below ground,<br />
and both living and dead, such as trees, crops, grasses, tree<br />
litter and roots.<br />
Capacity<br />
The combination of all the strengths, attributes and<br />
resources available within a community, society or<br />
organization that can be used to achieve agreed goals.<br />
Comment: Capacity may include infrastructure and<br />
physical means, institutions, societal coping abilities, as well<br />
as human knowledge, skills and collective attributes such as<br />
social relationships, leadership and management. Capacity<br />
also may be described as capability. Capacity assessment is<br />
a term for the process by which the capacity of a group is<br />
reviewed against desired goals, and the capacity gaps are<br />
identified for further action.<br />
Capacity building<br />
Process of developing the technical skills, institutional<br />
capability, and personnel.<br />
Climate change<br />
Change of climate, which is attributed directly or indirectly<br />
to human activity that alters the composition of the global<br />
atmosphere and which is in addition to natural climate<br />
variability observed over comparable time periods.<br />
Climate Variability<br />
Variations in the mean state and other statistics (such as<br />
standard deviations and the occurrence of extremes) of the<br />
climate on all temporal and spatial scales beyond that of<br />
individual weather events. Variability may be due to natural<br />
internal processes in the climate system (internal variability),<br />
or to variations in natural or anthropogenic external forcing<br />
(external variability).<br />
Common Alerting Protocol<br />
The Common Alerting Protocol (CAP) provides an open,<br />
non-proprietary digital message format for all types of<br />
alerts and notifications. It does not address any particular<br />
application or telecommunications method. The CAP format<br />
is compatible with emerging techniques, such as Web<br />
services, as well as existing formats including the Specific<br />
Area Message Encoding (SAME) used for the United States’<br />
National Oceanic and Atmospheric Administration (NOAA)<br />
Weather Radio and the Emergency Alert System (EAS).<br />
Cost-Benefit Analysis<br />
A technique designed to determine the feasibility of a<br />
project or plan by quantifying its costs and benefits.
Cyclone<br />
An atmospheric closed circulation rotating counterclockwise<br />
in the Northern Hemisphere and clockwise in the<br />
Southern Hemisphere.<br />
Deforestation<br />
The direct human-induced conversion of forested land to<br />
non-forested land.<br />
Desertification<br />
Degradation of land in arid, semi-arid and dry sub-humid<br />
areas, resulting from various factors, including climatic<br />
variations and human activities.<br />
Disaster<br />
A serious disruption of the functioning of a community or<br />
a society involving widespread human, material, economic<br />
or environmental losses and impacts, which exceeds the<br />
ability of the affected community or society to cope using<br />
its own resources.<br />
Comment: Disasters are often described as a result<br />
of the combination of: the exposure to a hazard; the<br />
conditions of vulnerability that are present; and insufficient<br />
capacity or measures to reduce or cope with the potential<br />
negative consequences. Disaster impacts may include<br />
loss of life, injury, disease and other negative effects on<br />
human physical, mental and social well-being, together<br />
with damage to property, destruction of assets, loss of<br />
services, social and economic disruption and environmental<br />
degradation.<br />
Disaster risk<br />
The potential disaster losses, in lives, health status,<br />
livelihoods, assets and services, which could occur to a<br />
particular community or a society over some specified<br />
future time period.<br />
Comment: The definition of disaster risk reflects the<br />
concept of disasters as the outcome of continuously<br />
present conditions of risk. Disaster risk comprises different<br />
types of potential losses which are often difficult to<br />
quantify. Nevertheless, with knowledge of the prevailing<br />
hazards and the patterns of population and socio-economic<br />
development, disaster risks can be assessed and mapped, in<br />
broad terms at least.<br />
Disaster risk reduction<br />
The concept and practice of reducing disaster risks through<br />
systematic efforts to analyse and manage the causal<br />
factors of disasters, including through reduced exposure to<br />
hazards, lessened vulnerability of people and property, wise<br />
management of land and the environment, and improved<br />
preparedness for adverse events.<br />
Comment: A comprehensive approach to reduce disaster<br />
risks is set out in the United Nations-endorsed Hyogo<br />
Framework for Action, adopted in 2005, whose expected<br />
outcome is “The substantial reduction of disaster losses, in<br />
lives and the social, economic and environmental assets<br />
of communities and countries.” The International Strategy<br />
for Disaster Reduction (ISDR) system provides a vehicle<br />
for cooperation among Governments, organisations and<br />
civil society actors to assist in the implementation of the<br />
Framework. Note that while the term “disaster reduction” is<br />
sometimes used, the term “disaster risk reduction” provides<br />
a better recognition of the ongoing nature of disaster risks<br />
and the ongoing potential to reduce these risks.<br />
Droughts<br />
A period of abnormally dry weather sufficiently prolonged<br />
for the lack of water to cause serious hydrologic imbalance<br />
in the affected area.<br />
<strong>Early</strong> warning system<br />
The set of capacities needed to generate and disseminate<br />
timely and meaningful warning information to enable<br />
individuals, communities and organizations threatened by a<br />
hazard to prepare and to act appropriately and in sufficient<br />
time to reduce the possibility of harm or loss.<br />
Comment: This definition encompasses the range<br />
of factors necessary to achieve effective responses<br />
to warnings. A people-centred early warning system<br />
necessarily comprises four key elements: knowledge of the<br />
risks; monitoring, analysis and forecasting of the hazards;<br />
communication or dissemination of alerts and warnings;<br />
and local capabilities to respond to the warnings received.<br />
The expression “end-to-end warning system” is also used<br />
to emphasize that warning systems need to span all steps<br />
from hazard detection through to community response.<br />
Earth observation<br />
Earth Observation, through measuring and monitoring,<br />
provides an insight and understanding into Earth’s complex<br />
processes and changes. EO include measurements that<br />
can be made directly or by sensors in-situ or remotely<br />
(i.e. satellite remote sensing, aerial surveys, land or<br />
ocean-based monitoring systems, Figure 3), to provide key<br />
information to models or other tools to support decision<br />
making processes.<br />
Earthquakes<br />
Earthquakes are due to a sudden release of stresses<br />
accumulated around the faults in the Earth’s crust. This<br />
energy is released through seismic waves that travel from<br />
the origin zone, which cause the ground to shake. Severe<br />
earthquakes can affect buildings and populations. The level<br />
of damage depends on many factors such as intensity of<br />
the earthquake, depth, vulnerability of the structures, and<br />
distance from the earthquake origin.<br />
Ecosystem<br />
Dynamic complex of plant, animal, microorganism<br />
communities and their non-living environment,<br />
interacting as a functional unit. Ecosystems are<br />
irrespective of political boundaries.<br />
59
El Niño-southern oscillation<br />
A complex interaction of the tropical Pacific Ocean and<br />
the global atmosphere that results in irregularly occurring<br />
episodes of changed ocean and weather patterns in many<br />
parts of the world, often with significant impacts over many<br />
months, such as altered marine habitats, rainfall changes,<br />
floods, droughts, and changes in storm patterns.<br />
Comment: The El Niño part of the El Niño-Southern<br />
Oscillation (ENSO) phenomenon refers to the well-aboveaverage<br />
ocean temperatures that occur along the coasts<br />
of Ecuador, Peru and northern Chile and across the eastern<br />
equatorial Pacific Ocean, while La Niña part refers to the<br />
opposite circumstances when well-below-average ocean<br />
temperatures occur. The Southern Oscillation refers to the<br />
accompanying changes in the global air pressure patterns<br />
that are associated with the changed weather patterns<br />
experienced in different parts of the world.<br />
Emergency management<br />
The organization and management of resources and<br />
responsibilities for addressing all aspects of emergencies, in<br />
particular preparedness, response and initial recovery steps.<br />
Comment: A crisis or emergency is a threatening<br />
condition that requires urgent action. Effective emergency<br />
action can avoid the escalation of an event into a<br />
disaster. Emergency management involves plans and<br />
institutional arrangements to engage and guide the<br />
efforts of government, non-government, voluntary and<br />
private agencies in comprehensive and coordinated ways<br />
to respond to the entire spectrum of emergency needs.<br />
The expression “disaster management” is sometimes used<br />
instead of emergency management.<br />
Extensible Markup Language<br />
A markup language that defines a set of rules for encoding<br />
documents in a format that is both human-readable and<br />
machine-readable.<br />
E-waste<br />
A generic term encompassing various forms of electrical<br />
and electronic equipment that has ceased to be of value<br />
and is disposed of. A practical definition of e-waste is “any<br />
electrically powered appliance that fails to satisfy the<br />
current owner for its originally intended purpose.”<br />
False Alarm<br />
In the context of <strong>Early</strong> <strong>Warning</strong> <strong>Systems</strong>, a false alarm is<br />
defined as the situation in which an alarm is activated when<br />
it should not have been.<br />
Fine Particle<br />
Particulate matter suspended in the atmosphere less than<br />
2.5 μm in size (PM2.5).<br />
60<br />
Floods<br />
An overflow of water onto normally dry land. The<br />
inundation of a normally dry area caused by rising water in<br />
an existing waterway, such as a river, stream, or drainage<br />
ditch. Ponding of water at or near the point where the rain<br />
fell. Flooding is a longer term event than flash flooding: it<br />
may last days or weeks. Floods are often triggered by severe<br />
storms, tropical cyclones, and tornadoes.<br />
Food security<br />
When all people at all times have access to sufficient, safe,<br />
nutritious food to maintain a healthy and active life.<br />
Forecast<br />
Definite statement or statistical estimate of the likely<br />
occurrence of a future event or conditions for a specific area.<br />
Comment: In meteorology a forecast refers to a future<br />
condition, whereas a warning refers to a potentially<br />
dangerous future condition.<br />
Forest<br />
Land spanning more than 0.5 hectares with trees higher<br />
than 5 metres and a canopy cover of more than 10 per cent,<br />
or trees able to reach these thresholds in situ. It does not<br />
include land that is predominantly under agricultural or<br />
urban land use.<br />
Gaussian distribution<br />
The Gaussian (normal) distribution was historically called<br />
the law of errors. It was used by Gauss to model errors<br />
in astronomical observations, which is why it is usually<br />
referred to as the Gaussian distribution.<br />
Geological hazard<br />
Geological process or phenomenon that may cause loss of<br />
life, injury or other health impacts, property damage, loss of<br />
livelihoods and services, social and economic disruption, or<br />
environmental damage.<br />
Comment: Geological hazards include internal earth<br />
processes, such as earthquakes, volcanic activity and<br />
emissions, and related geophysical processes such as<br />
mass movements, landslides, rockslides, surface collapses,<br />
and debris or mud flows. Hydrometeorological factors<br />
are important contributors to some of these processes.<br />
Tsunamis are difficult to categorize; although they are<br />
triggered by undersea earthquakes and other geological<br />
events, they are essentially an oceanic process that is<br />
manifested as a coastal water-related hazard. Within this<br />
report, tsunamis are included in the geological<br />
hazards group.<br />
Geographic Information System<br />
A computerized system organizing data sets through<br />
a geographical referencing of all data included in<br />
its collections.
Greenhouse gases<br />
Atmospheric gases that trap the heat and are responsible<br />
for warming the earth and climate change. The major<br />
greenhouse gases are: carbon dioxide (CO ), methane<br />
2<br />
(CH ) and nitrous oxide (N 0). Less prevalent but very<br />
4 2<br />
powerful greenhouse gases are hydrofluorocarbons<br />
(HFCs), perfluorocarbons (PFCs) and sulphur hexafluoride<br />
(SF6). Those gases are regulated under the UN Framework<br />
Convention on Climate Change (UNFCCC) and the Kyoto<br />
Protocol. Some greenhouse gases are also regulated under<br />
the Montreal Protocol for their effects on the ozone layer.<br />
Habitat<br />
(1) Place or type of site where an organism or population<br />
naturally occurs (CBD). (2) Shorthand for UN-Habitat.<br />
Hazard<br />
A dangerous phenomenon, substance, human activity or<br />
condition that may cause loss of life, injury or other health<br />
impacts, property damage, loss of livelihoods and services,<br />
social and economic disruption, or environmental damage.<br />
Comment: The hazards of concern to disaster risk<br />
reduction as stated in footnote 3 of the Hyogo Framework<br />
are “… hazards of natural origin and related environmental<br />
and technological hazards and risks.” Such hazards arise<br />
from a variety of geological, meteorological, hydrological,<br />
oceanic, biological, and technological sources, sometimes<br />
acting in combination. In technical settings, hazards<br />
are described quantitatively by the likely frequency of<br />
occurrence of different intensities for different areas, as<br />
determined from historical data or scientific analysis.<br />
Hotspot<br />
(1) Area particularly rich in total numbers of species<br />
(biodiversity hotspot). (2) Area of especially high<br />
concentrations of pollutants.<br />
Human Health<br />
A state of complete physical, mental and social well-being,<br />
and not merely the absence of disease or infirmity.<br />
Hurricane/Typhoon<br />
A tropical cyclone in which the maximum sustained surface<br />
wind (using the U.S. 1-minute average) is 64 kt (74 mph or<br />
119 km/hr) or more. The term hurricane is used for Northern<br />
Hemisphere tropical cyclones east of the International<br />
Dateline to the Greenwich Meridian. The term typhoon is<br />
used for Pacific tropical cyclones north of the Equator west<br />
of the International Dateline.<br />
Hydrometeorological hazard<br />
Process or phenomenon of atmospheric, hydrological<br />
or oceanographic nature that may cause loss of life,<br />
injury or other health impacts, property damage, loss of<br />
livelihoods and services, social and economic disruption, or<br />
environmental damage.<br />
Comment: Hydrometeorological hazards include<br />
tropical cyclones (also known as typhoons and hurricanes),<br />
thunderstorms, hailstorms, tornados, blizzards, heavy<br />
snowfall, avalanches, coastal storm surges, floods<br />
including flash floods, drought, heatwaves and cold spells.<br />
Hydrometeorological conditions also can be a factor in<br />
other hazards such as landslides, wildland fires, locust<br />
plagues, epidemics, and in the transport and dispersal of<br />
toxic substances and volcanic eruption material. Within this<br />
report, droughts have been addressed separately.<br />
Land Cover<br />
The physical coverage of land, usually expressed in terms<br />
of vegetation cover or lack of it. Influenced by but not<br />
synonymous with land use.<br />
Land Degradation<br />
The loss of biological or economic productivity and<br />
complexity in croplands, pastures and woodlands. It is due<br />
mainly to climate variability and unsustainable<br />
human activity.<br />
Landslides<br />
Landslides are displacements of earth, rock, and debris<br />
caused by heavy rains, floods, earthquakes, volcanoes, and<br />
wildfires.<br />
Land Use<br />
The human use of land for a certain purpose. Influenced by,<br />
but not synonymous with, land cover.<br />
Missed Alarm<br />
In the context of <strong>Early</strong> <strong>Warning</strong> <strong>Systems</strong>, a missed alarm is<br />
defined as the situation in which an alarm is not activated<br />
when it should have been.<br />
Mitigation<br />
The lessening or limitation of the adverse impacts of<br />
hazards and related disasters.<br />
Comment: The adverse impacts of hazards often cannot<br />
be prevented fully, but their scale or severity can be<br />
substantially lessened by various strategies and actions.<br />
Mitigation measures encompass engineering techniques<br />
and hazard-resistant construction as well as improved<br />
environmental policies and public awareness. It should be<br />
noted that in climate change policy, “mitigation” is defined<br />
differently, being the term used for the reduction<br />
of greenhouse gas emissions that are the source of<br />
climate change.<br />
61
Natural hazard<br />
Natural process or phenomenon that may cause loss of life,<br />
injury or other health impacts, property damage, loss of<br />
livelihoods and services, social and economic disruption, or<br />
environmental damage.<br />
Comment: Natural hazards are a sub-set of all hazards.<br />
The term is used to describe actual hazard events as well<br />
as the latent hazard conditions that may give rise to future<br />
events. Natural hazard events can be characterized by their<br />
magnitude or intensity, speed of onset, duration, and area<br />
of extent. For example, earthquakes have short durations<br />
and usually affect a relatively small region, whereas<br />
droughts are slow to develop and fade away and often<br />
affect large regions. In some cases hazards may be coupled,<br />
as in the flood caused by a hurricane or the tsunami that is<br />
created by an earthquake.<br />
Pollutant<br />
Any substance that causes harm to the environment when<br />
it mixes with soil, water or air.<br />
Pollution<br />
The presence of minerals, chemicals or physical properties<br />
at levels that exceed the values deemed to define a<br />
boundary between “good or acceptable” and “poor or<br />
unacceptable” quality, which is a function of the specific<br />
pollutant.<br />
Prediction<br />
The act of attempting to produce a description of the<br />
expected future, or the description itself, such as “it will be<br />
30 degrees tomorrow, so we will go to the beach.”<br />
Preparedness<br />
The knowledge and capacities developed by governments,<br />
professional response and recovery organizations,<br />
communities and individuals to effectively anticipate,<br />
respond to, and recover from, the impacts of likely,<br />
imminent or current hazard events or conditions.<br />
Comment: Preparedness action is carried out within<br />
the context of disaster risk management and aims to build<br />
the capacities needed to efficiently manage all types of<br />
emergencies and achieve orderly transitions from response<br />
through to sustained recovery. Preparedness is based<br />
on a sound analysis of disaster risks and good linkages<br />
with early warning systems, and includes such activities<br />
as contingency planning, stockpiling of equipment<br />
and supplies, the development of arrangements for<br />
coordination, evacuation and public information, and<br />
associated training and field exercises. These must be<br />
supported by formal institutional, legal and budgetary<br />
capacities. The related term “readiness” describes the ability<br />
to quickly and appropriately respond when required.<br />
Prevention<br />
The outright avoidance of adverse impacts of hazards and<br />
related disasters.<br />
62<br />
Comment: Prevention (i.e. disaster prevention) expresses<br />
the concept and intention to completely avoid potential<br />
adverse impacts through action taken in advance. Examples<br />
include dams or embankments that eliminate flood risks,<br />
land-use regulations that do not permit any settlement<br />
in high risk zones, and seismic engineering designs that<br />
ensure the survival and function of a critical building in<br />
any likely earthquake. Very often the complete avoidance<br />
of losses is not feasible and the task transforms to that of<br />
mitigation. Partly for this reason, the terms prevention and<br />
mitigation are sometimes used interchangeably in casual<br />
use.<br />
Probability of missed alarm<br />
In the context of <strong>Early</strong> <strong>Warning</strong> systems, the probability<br />
of missed alarm is the probability of having threshold<br />
exceedance but no alarm activation.<br />
Probability of false alarm<br />
In the context of <strong>Early</strong> <strong>Warning</strong> systems, the probability<br />
of false alarm is the probability of having no threshold<br />
exceedance but alarm activation.<br />
Really Simple Syndication<br />
Really Simple Syndication is a family of web feed formats<br />
used to publish frequently updated works—such as<br />
blog entries, news headlines, audio, and video—in a<br />
standardized format.<br />
Recovery<br />
The restoration, and improvement where appropriate,<br />
of facilities, livelihoods and living conditions of disasteraffected<br />
communities, including efforts to reduce disaster<br />
risk factors.<br />
Comment: The recovery task of rehabilitation and<br />
reconstruction begins soon after the emergency phase has<br />
ended, and should be based on pre-existing strategies and<br />
policies that facilitate clear institutional responsibilities<br />
for recovery action and enable public participation.<br />
Recovery programmes, coupled with the heightened<br />
public awareness and engagement after a disaster, afford<br />
a valuable opportunity to develop and implement disaster<br />
risk reduction measures and to apply the “build back better”<br />
principle.<br />
Response<br />
The provision of emergency services and public assistance<br />
during or immediately after a disaster in order to save lives,<br />
reduce health impacts, ensure public safety and meet the<br />
basic subsistence needs of the people affected.<br />
Comment: Disaster response is predominantly focused<br />
on immediate and short-term needs and is sometimes<br />
called “disaster relief”. The division between this response<br />
stage and the subsequent recovery stage is not clear-cut.<br />
Some response actions, such as the supply of temporary<br />
housing and water supplies, may extend well into the<br />
recovery stage.
Risk<br />
The combination of the probability of an event and its<br />
negative consequences.<br />
Comment: This definition closely follows the definition<br />
of the ISO/IEC Guide 73. The word “risk” has two distinctive<br />
connotations: in popular usage the emphasis is usually<br />
placed on the concept of chance or possibility, such as in<br />
“the risk of an accident”; whereas in technical settings the<br />
emphasis is usually placed on the consequences, in terms<br />
of “potential losses” for some particular cause, place and<br />
period. It can be noted that people do not necessarily share<br />
the same perceptions of the significance and underlying<br />
causes of different risks.<br />
Risk assessment<br />
A methodology to determine the nature and extent of risk<br />
by analysing potential hazards and evaluating existing<br />
conditions of vulnerability that together could potentially<br />
harm exposed people, property, services, livelihoods and<br />
the environment on which they depend.<br />
Comment: Risk assessments (and associated risk<br />
mapping) include: a review of the technical characteristics<br />
of hazards such as their location, intensity, frequency and<br />
probability; the analysis of exposure and vulnerability<br />
including the physical social, health, economic and<br />
environmental dimensions; and the evaluation of the<br />
effectiveness of prevailing and alternative coping capacities<br />
in respect to likely risk scenarios. This series of activities is<br />
sometimes known as a risk analysis process.<br />
Sustainable development<br />
Development that meets the needs of the present without<br />
compromising the ability of future generations to meet<br />
their own needs.<br />
Comment: This definition coined by the 1987<br />
Brundtland Commission is very succinct but it leaves<br />
unanswered many questions regarding the meaning of<br />
the word development and the social, economic and<br />
environmental processes involved. Disaster risk is associated<br />
with unsustainable elements of development such as<br />
environmental degradation, while conversely disaster risk<br />
reduction can contribute to the achievement of sustainable<br />
development, through reduced losses and improved<br />
development practices.<br />
Technological hazards<br />
A hazard originating from technological or industrial<br />
conditions, including accidents, dangerous procedures,<br />
infrastructure failures or specific human activities, that may<br />
cause loss of life, injury, illness or other health impacts,<br />
property damage, loss of livelihoods and services, social and<br />
economic disruption, or environmental damage.<br />
Comment: Examples of technological hazards include<br />
industrial pollution, nuclear radiation, toxic wastes, dam<br />
failures, transport accidents, factory explosions, fires, and<br />
chemical spills. Technological hazards also may arise directly<br />
as a result of the impacts of a natural hazard event.<br />
Tsunami<br />
A tsunami is a series of ocean waves generated by<br />
sudden displacements in the sea floor, landslides,<br />
or volcanic activity.<br />
Volcanic eruptions<br />
Volcanic eruptions may be mild, releasing steam and gases<br />
or lava flows, or they can be violent explosions that release<br />
ashes and gases into the atmosphere.<br />
Vulnerability<br />
The characteristics and circumstances of a community,<br />
system or asset that make it susceptible to the damaging<br />
effects of a hazard.<br />
Comment: There are many aspects of vulnerability,<br />
arising from various physical, social, economic, and<br />
environmental factors. Examples may include poor design<br />
and construction of buildings, inadequate protection of<br />
assets, lack of public information and awareness, limited<br />
official recognition of risks and preparedness measures,<br />
and disregard for wise environmental management.<br />
Vulnerability varies significantly within a community<br />
and over time. This definition identifies vulnerability as a<br />
characteristic of the element of interest (community, system<br />
or asset) which is independent of its exposure. However,<br />
in common use the word is often used more broadly to<br />
include the element’s exposure.<br />
Water Quality<br />
The chemical, physical and biological characteristics<br />
of water, usually in respect to its suitability for a<br />
particular purpose.<br />
Wild-fires<br />
Wild-fires may be natural processes, human induced<br />
for agriculture purposes, or just the result of human<br />
negligence. Wild-fires pose a threat to lives and properties<br />
and are often connected to secondary effects such as<br />
landslides, erosion, and changes in water quality.<br />
63