Uganda Atlas of Our Changing Environment - GRID-Arendal
Uganda Atlas of Our Changing Environment - GRID-Arendal
Uganda Atlas of Our Changing Environment - GRID-Arendal

You also want an ePaper? Increase the reach of your titles
YUMPU automatically turns print PDFs into web optimized ePapers that Google loves.
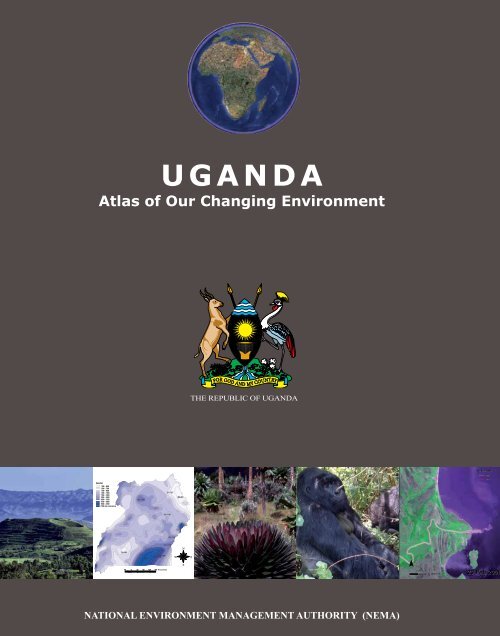
U G A N D A<br />
<strong>Atlas</strong> <strong>of</strong> <strong>Our</strong> <strong>Changing</strong> <strong>Environment</strong><br />
Kilometres<br />
THE REPUBLIC OF UGANDA<br />
NATIONAL ENVIRONMENT MANAGEMENT AUTHORITY (NEMA)
National <strong>Environment</strong> Management Authority y<br />
E N S U R I N G S U S TA I N A B L E D E V E L O P ME N T<br />
THE REPUBLIC OF UGANDA<br />
U G A N D A<br />
<strong>Atlas</strong> <strong>of</strong> <strong>Our</strong> <strong>Changing</strong> <strong>Environment</strong>
© 2009, National Enviornment Management Authority (NEMA)<br />
ISBN:<br />
Job Number:<br />
This publication may be reproduced in whole or in part and in any form for educational or nonpr<strong>of</strong>it<br />
purposes without special permission from the copyright holder, provided acknowledgement<br />
<strong>of</strong> the source is made. This publication should not be used for commercial purposes whatsoever<br />
without prior permission in writing from National <strong>Environment</strong> Management Authority.<br />
National <strong>Environment</strong> Management Authority (NEMA)<br />
NEMA House Plot 17/19/21 Jinja Road<br />
P. O Box 22255 Kampala <strong>Uganda</strong><br />
Tel: +256 41 25 10 64<br />
Fax: +256 41 25 75 21<br />
E-mail: info@nemaug.org<br />
http://www.nemaug.org/<br />
For bibliographic and reference purposes this publication should be referred to as:<br />
NEMA (2009), “<strong>Uganda</strong>: <strong>Atlas</strong> <strong>of</strong> <strong>Our</strong> <strong>Changing</strong> <strong>Environment</strong>.”<br />
National <strong>Environment</strong> Management Authority (NEMA)<br />
P. O Box 22255 Kampala <strong>Uganda</strong><br />
This book is available on www.nemaug.org<br />
Printed by UNEP-<strong>GRID</strong> <strong>Arendal</strong>, Norway<br />
The funding support for this <strong>Atlas</strong> was provided by UNEP-<strong>GRID</strong> <strong>Arendal</strong>, Norway.<br />
The United States Geological Survey (USGS) Earth Resources Observation and Science (EROS)<br />
Center, and the host <strong>of</strong> UNEP/<strong>GRID</strong> - Sioux Falls, provided support needed for some <strong>of</strong> the<br />
visiting scientists.<br />
Appreciation is also extended to the United States Department <strong>of</strong> State, the National Aeronautics<br />
and Space Administration (NASA), the US National Geospatial-Intelligence Agency (NGA),<br />
Planet Action Initiative, ©CNES 2008, Distribution Spot Image S.A., France, and Google Earth<br />
for access to satellite data.<br />
DISCLAIMER<br />
The views expressed in this publication are not necessarily those <strong>of</strong> the National <strong>Environment</strong>al<br />
Management Authority (NEMA). Mention <strong>of</strong> any company or product in this report does not<br />
imply endorsement by NEMA. Use <strong>of</strong> information and products from this publication for<br />
publicity or advertising is not permitted. Trademark names and symbols are used in an editorial<br />
fashion with no intention <strong>of</strong> infringement on trademark or copyright laws.<br />
We regret any errors or omissions that may have been unknowingly made.
Table <strong>of</strong> Contents<br />
Foreword ................................................................................................................................................iv<br />
Acknowledgement .....................................................................................................................................v<br />
Chapter 1: <strong>Uganda</strong>’s Geography.....................................................................1<br />
Relief ..................................................................................................................................1<br />
Geology.......................................................................................................................................2<br />
Climate.......................................................................................................................................4<br />
Rainfall distribution........................................................................................................................6<br />
Climatic zones........................................................................................................................8<br />
Zone I Lake Victoria Basin ..................................................................................................9<br />
Zone II Karamoja.............................................................................................................9<br />
Zone III Western <strong>Uganda</strong> ...................................................................................................9<br />
Zone IV Acholi-Kyoga .......................................................................................................9<br />
Zone V Southern <strong>Uganda</strong> ...................................................................................................9<br />
Zone VI Mount Elgon ........................................................................................................9<br />
Water Resources ................................................................................................................... ......10<br />
Water levels in major lakes ..................................................................................................... 11<br />
River basins .........................................................................................................................14<br />
Drainage ........................................................................................................................... 16<br />
Ground Water ...................................................................................................................... 18<br />
Land cover ......................................................................................................................... 20<br />
Land use ............................................................................................................................ 22<br />
Wetlands .................................................................................................................................. 24<br />
Ramsar Convention ............................................................................................................... 26<br />
Management ....................................................................................................................... 27<br />
Importance - uses ................................................................................................................. 28<br />
Threats ............................................................................................................................. 30<br />
Interventions ...................................................................................................................... 31<br />
Forests ..................................................................................................................................... 35<br />
Forest reserves .................................................................................................................... 35<br />
Forests .............................................................................................................................. 36<br />
Conservation Areas .............................................................................................................. .38<br />
Protected areas.............................................................................................................38<br />
Wildlife ......................................................................................................................39<br />
Soils ........................................................................................................................................ 44<br />
Classification and nomenclature............................................................................................... .44<br />
Agro-ecological zones ........................................................................................................... .45<br />
Oil prospecting in the Albertine Graben ............................................................................................. 49<br />
Energy ................. ................................................................................................................... 50<br />
Hydro-electric power ............................................................................................................. 50<br />
Sources <strong>of</strong> energy ................................................................................................................. 50<br />
Industry ................. .................................................................................................................. 53<br />
Science and technology ................. ............................................................................................... 55<br />
i
Chapter 2: <strong>Uganda</strong>’s <strong>Changing</strong> <strong>Environment</strong>...................................................57<br />
ii<br />
Increase in Agriculture .................................................................................................................. 57<br />
Kiruhura ............................................................................................................................ 58<br />
Karamoja ........................................................................................................................... 60<br />
Kibimba Rice Scheme............................................................................................................. 62<br />
Deforestation ............................................................................................................................. 64<br />
Mabira Forest Reserve ............................................................................................................ 64<br />
Nakasongola ....................................................................................................................... 68<br />
Budongo Forest Reserve ........................................................................................................ 70<br />
Decreased fire fronts ..................................................................................................... 72<br />
Katugo Forest Reserve ........................................................................................................... 74<br />
Mwenge and Mafuga Forest reserves ........................................................................................... 76<br />
Pader Refugee Camp ............................................................................................................. 78<br />
Kooki Hills area .................................................................................................................... 80<br />
Origin <strong>of</strong> lake Kijanebalola and River Rwizi –Bukora system ....................................................... 84<br />
Mount Elgon National Park ....................................................................................................... 86<br />
Wetlands degradation ................................................................................................................... 90<br />
Lake Wamala ...................................................................................................................... 90<br />
Wetlands degradation .................................................................................................... 90<br />
Lake Bunyonyi – Iyamuliro wetland ............................................................................................ 92<br />
Lake Bunyonyi ..................................................................................................................... 94<br />
Lake Mutanda ...................................................................................................................... 96<br />
Laropi-Moyo lakes ................................................................................................................100<br />
Teso region flooding ....................................................................................................................104<br />
Kampala ..............................................................................................................................106<br />
Urbanization and industrialization ............................................................................................106<br />
Kampala’s changing environment .............................................................................................108<br />
Impact <strong>of</strong> the changing environment ........................................................................................126<br />
Water quality .....................................................................................................................127<br />
Positive impacts Kampala’s changing environment .........................................................................128<br />
Chapter 3: Transboundary and Cross-border <strong>Environment</strong>al Issues in <strong>Uganda</strong>........133<br />
Mt. Rwenzori ............................................................................................................................136<br />
Glaciers, Global warming, disappearing, ice caps, reduced stream water. ............................................136<br />
Mt. Rwenzori ............................................................................................................................138<br />
Eroded river banks <strong>of</strong> river Semliki. ..........................................................................................138<br />
Expansion <strong>of</strong> shoreline to increased siltation <strong>of</strong> Lake Albert .............................................................139<br />
<strong>Changing</strong> river course <strong>of</strong> the River Semliki. .................................................................................140<br />
Kagera River .............................................................................................................................142<br />
Siltation <strong>of</strong> Lake Victoria .......................................................................................................142<br />
Lake Victoria…....................................................................................................................144<br />
Lake Kyoga ..............................................................................................................................146<br />
Sudds and blockage <strong>of</strong> the River Nile on Lake Kyoga .......................................................................148<br />
Deforestation <strong>of</strong> Kasyoha-Kitomi Forest Reserves .................................................................................150<br />
Impact <strong>of</strong> refugee settlements in West Nile ........................................................................................152<br />
Rhino Refugee camp .............................................................................................................152
Chapter 4: Tracking <strong>Environment</strong>al Sustainability...........................................155<br />
<strong>Uganda</strong>’s economy ......................................................................................................................156<br />
<strong>Uganda</strong>’s MDG status ...................................................................................................................157<br />
Millenium Development Goals ........................................................................................................158<br />
MDG 7: Ensure <strong>Environment</strong>al Sustainability ................................................................................160<br />
Green House Gas Emissions ...........................................................................................................161<br />
<strong>Environment</strong>al sustainability at regional level .....................................................................................163<br />
Population Growth ......................................................................................................................167<br />
Literacy rate .............................................................................................................................168<br />
Rural Migration ..........................................................................................................................169<br />
Tourism and <strong>Environment</strong> ..............................................................................................................170<br />
Science and technology ................................................................................................................171<br />
Land use and landcover ................................................................................................................172<br />
Forest loss ..............................................................................................................................173<br />
Forest reserves ..........................................................................................................................174<br />
Forests by district ......................................................................................................................175<br />
Fisheries ............................................................................................................................…177<br />
Latrine coverage ......................................................................................................................…178<br />
Access to energy .....................................................................................................................…179<br />
Energy for cooking ....................................................................................................................…180<br />
Per capita arable land by region .....................................................................................................181<br />
Arable land ...........................................................................................................................….182<br />
Chapter 5: Key findings and Recommendations.............................................183<br />
Special features .........................................................................................................................186<br />
Wildlife ............................................................................................................................187<br />
Biodiversity .......................................................................................................................189<br />
World <strong>Environment</strong> Day celebrations .........................................................................................191<br />
Areas <strong>of</strong> interest ...............................................................................................................…192<br />
Impacts on our environment .................................................................................................…195<br />
Places <strong>of</strong> worship ..............................................................................................................…196<br />
Cultural aspects ................................................................................................................…197<br />
Traditional aspects ............................................................................................................…198<br />
Unique innovations and appearances .......................................................................................…199<br />
Crater lakes in <strong>Uganda</strong> .................................................................................................................200<br />
Editorial and Production Team .....................................................................................................................201<br />
Acknowledgements ..............................................................................................................................201<br />
Acronyms ..............................................................................................................................202<br />
References ..............................................................................................................................203<br />
Index ..............................................................................................................................204<br />
iii
Foreword<br />
Hon. Maria Mutagamba<br />
MINISTER OF WATER AND ENVIRONMENT<br />
THE REPUBLIC OF UGANDA<br />
iv<br />
<strong>Uganda</strong> is a landlocked country in Eastern Africa. <strong>Our</strong> country is rich in natural<br />
resources and in the recent years we have been blessed with the discovery <strong>of</strong> oil in<br />
the Albertine Graben. It is now common knowledge that development <strong>of</strong> any society<br />
should not be at the cost <strong>of</strong> future generations. Many people especially in rural areas,<br />
are dependent on natural resources for their livelihood, and hence mainstreaming the<br />
sustainable use <strong>of</strong> these resources into Government plans and programs at all levels<br />
has been a priority <strong>of</strong> the NRM Government since it came to power in 1986. This <strong>Atlas</strong><br />
seeks to highlight changes that have arisen from the effects <strong>of</strong> local activities and<br />
global phenomena. It also demonstrates the capacity <strong>Uganda</strong> has built over the last<br />
twelve years in using new technologies to provide information to aid decision making<br />
processes. Tracking environmental changes is not new because warnings have been<br />
issued bi-ennially in the National State <strong>of</strong> <strong>Environment</strong> Reports (NSOER) since 1994.<br />
However, the uniqueness <strong>of</strong> this publication is the evidence based information from<br />
multi-temporal satellite images, ground photographs and graphics to confirm some <strong>of</strong><br />
the negative and positive changes in our environment.<br />
This <strong>Atlas</strong> presents some positive changes in some areas which decision makers and<br />
other readers will find useful. However, allow me to highlight some key findings which<br />
need to be integrated in development plans in order to reverse the negative effects.<br />
The siltation <strong>of</strong> our lakes due to uncontrolled activities on land especially for Lakes<br />
Albert and Victoria needs urgent attention. The shrinkage in area <strong>of</strong> some lakes<br />
especially for Wamala affecting the fish catch requires urgent intervention measures.<br />
Loss <strong>of</strong> woody biomass due to charcoal burning and enchroachment <strong>of</strong> forested<br />
ecosystems especially in Nakasongola, Nakaseke and Kiboga Districts will have big<br />
consequences on the water regime and needs urgent intervention at both national and<br />
local government levels. Finally unplanned settlements in drainage channels especially<br />
in urban areas resulting in floods should be halted immediately.<br />
I hope that this <strong>Atlas</strong> will make all the people <strong>of</strong> <strong>Uganda</strong> believe in the wealth <strong>of</strong><br />
our natural resources and also threats that we face as a country because <strong>of</strong> human<br />
activities. There is a saying that “seeing is believing” and this <strong>Atlas</strong> provides visual<br />
information <strong>of</strong> our changing environment.<br />
I wish you all good reading.
Acknowledgement<br />
The National <strong>Environment</strong> Management Authority is pleased to present the atlas<br />
for <strong>Uganda</strong>’s changing environment. This publication uses remotely sensed data,<br />
ground photographs and graphics to provide evidence on both positive and negative<br />
environmental changes over the years.<br />
I sincerely thank the Government Departments and all Local Governments under<br />
the umbrella <strong>of</strong> the <strong>Environment</strong> Information Network (EIN) for contributing data<br />
and committing time to produce this atlas. This has demonstrated the level <strong>of</strong><br />
collaboration that exists and capacity built among institutions in <strong>Uganda</strong>. This<br />
collaboration is a good building block for enhanced environmental management in the<br />
country.<br />
Special thanks go to UNEP-<strong>GRID</strong> <strong>Arendal</strong> in Norway who provided the main finances<br />
and technical support that enabled preparation <strong>of</strong> this <strong>Atlas</strong>. I also wish to extend my<br />
gratitude to the United Nations <strong>Environment</strong> Programme (UNEP) <strong>of</strong>fice in Nairobi and<br />
Sioux Falls (USA) who provided financial, technical support and satellite imagery for<br />
this atlas. The Regional Centre for Mapping <strong>of</strong> Resources for Development (RCMRD) in<br />
Nairobi is recognized and appreciated for providing the useful satellite images.<br />
Finally, I do appreciate the commitment <strong>of</strong> my staff who were involved in the technical<br />
preparation, review and production <strong>of</strong> this invaluable resource material. I can only<br />
urge them to continue with the good work.<br />
This publication should serve as a tool for informing decision making processes<br />
in <strong>Uganda</strong>.<br />
Aryamanya-Mugisha, Henry (Ph.D)<br />
Executive Director<br />
NATIONAL ENVIRONMENT MANAGEMENT<br />
AUTHORITy (NEMA)<br />
UGANDA<br />
v
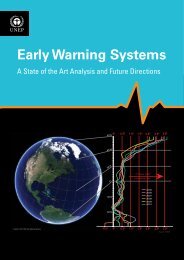
Sunset over Europe and Africa<br />
A digital composite made by several Earth-orbiting satellites and ocean-faring ships, this image simulates the sun setting over Europe and<br />
Africa. The night side <strong>of</strong> the image, taken by DMSP satellites, is dotted with bright city lights and lighted road networks such as Paris,<br />
Barcelona, and cities in Holland.<br />
The daylight side is composed <strong>of</strong> land images taken from the MODIS instruments on NASA’s Terra satellite. In the daylight side, the vegetation<br />
shows green, non-vegetated areas are tan, and ice is white. The topography <strong>of</strong> the ocean floor is also visible with the Madeira, Canary, and<br />
Cape Verde islands showing clearly in the blue <strong>of</strong> the Atlantic Ocean.<br />
The image taken by the crew on board the Columbia during its last mission before it crashed in space on the 01st February, 2003 at 4:36 pm<br />
shows Europe and Africa when the sun is setting. Half <strong>of</strong> the picture is in night and the bright dots you see are the lights in cities. The top part<br />
<strong>of</strong> Africa is the Sahara desert. Lights are already on in cities in Holland, Paris, and Barcelona, and it is still daylight in London, Lisbon, and<br />
Madrid.<br />
The sun is still shining on the Straight <strong>of</strong> Gibraltar, and the Mediterranean Sea is already in darkness. In the middle <strong>of</strong> the Atlantic Ocean you<br />
can see the Azores Islands; below them to the right are the Madeira Islands; a bit below are the Canary Islands; and further south, close to the<br />
farthest western point <strong>of</strong> Africa, the Cape Verde Islands. The Sahara is huge and can be seen clearly both during daytime and night. To the left,<br />
on top, is Greenland, totally frozen.<br />
vi<br />
NASA 01st February, 2003
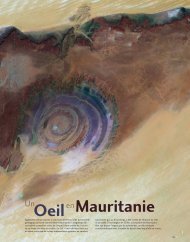
Lobelia sp in the Rwenzori mountains, Kasese District, Western <strong>Uganda</strong><br />
vii<br />
<strong>Uganda</strong> Wildlife Authority (UWA) 2008
The beautiful ridges landscape in Kigezi highlands overlooking Lake Bunyonyi in Kabale District, Western <strong>Uganda</strong><br />
viii
ix<br />
NEMA 2008
x<br />
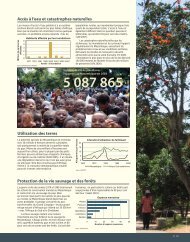
Display <strong>of</strong> Jupiter, Venus and the moon triangle over <strong>Uganda</strong> on 1 st December 2008<br />
Source: Wekesa George (S4. Seeta High School, Mukono Campus) Mikono District, <strong>Uganda</strong> 2008<br />
A Rare Meeting: Jupiter, Venus and the Moon<br />
On 1st December 2008, the night-time skies over <strong>Uganda</strong> witnessed the seemingly meeting <strong>of</strong> three <strong>of</strong><br />
four solar system’s best known celestial objects. The moon, brightest <strong>of</strong> the three objects in the above<br />
photo, was 405 600 km away from Earth. Venus, to the left <strong>of</strong> the moon, was the second brightest object<br />
in the sky and 151 million kilometres away. Jupiter, the largest planet in the solar system, was a dimmer<br />
third and 869 kilometres away.<br />
While the three celestial objects do come together from time to time, they are <strong>of</strong>ten too close to the<br />
sun or unite at a time when they are not so visible. The next time the three will be as close and visible,<br />
will be 18th November 2052.<br />
Wekesa George (S4. Seeta High School, Mukono Campus) Mikono District, <strong>Uganda</strong> 2008
The Pearl <strong>of</strong> Africa<br />
Chapter 1<br />
T h e G e o g r a p h y o f U g a n d a<br />
Legend<br />
Relief(m)<br />
Value<br />
High : 16622.570313<br />
High 16,623<br />
Low : 1263.843750<br />
Low 1,264<br />
Figure 1: <strong>Uganda</strong>’s Relief<br />
0<br />
25<br />
50 100 150 200<br />
Kilometres<br />
250<br />
1<br />
National Forestry Authority (NFA) 2008
Figure 2: The Geology <strong>of</strong> <strong>Uganda</strong><br />
2<br />
Geology<br />
)<br />
Kilometres<br />
<strong>Atlas</strong> <strong>of</strong> <strong>Uganda</strong>, 1967
Sunset over Lake Albert in Western <strong>Uganda</strong><br />
<strong>Uganda</strong> lies astride the equator in the eastern<br />
region <strong>of</strong> Africa and is located on the raised part<br />
<strong>of</strong> the African plateau. <strong>Uganda</strong> is a landlocked<br />
country in East Africa and borders Kenya to the<br />
east, Sudan to the north, Tanzania to the south, the<br />
Democratic Republic <strong>of</strong> Congo to the west and Rwanda<br />
in the south-west. It lies within the latitude <strong>of</strong> 4°12’N<br />
and 1°29’S, longitude <strong>of</strong> 29°34’E and 35°0’W. The total<br />
surface area is 241,551 km² <strong>of</strong> which 199,807 km² fall<br />
under land and 41,743 km² under water and swamps.<br />
The annual temperature and rainfall range between<br />
12°C to 32°C and 800 to 1,700 mm, respectively.<br />
<strong>Uganda</strong>’s landscape has a rich diversity <strong>of</strong> relief features<br />
with great contrasts bearing significant influence on the<br />
physical and biological environments.<br />
The contrasts range from the great East African rift<br />
valley with the lowest elevation <strong>of</strong> about 620 m above<br />
mean sea level while the highest is about 5,111 m on<br />
Magherita peak in the Rwenzori Mountains.<br />
The largest part <strong>of</strong> the country lies between 900-1,500<br />
m but comprises <strong>of</strong> distinct landscape levels generally<br />
made up <strong>of</strong> plains, plateaus, and mountains.<br />
These landscapes are a product <strong>of</strong> different cycles <strong>of</strong><br />
erosion, and tectonic and volcanic activities that took<br />
place on the African plateau - surface. The African<br />
surface developed upon complex underlying geological<br />
structures <strong>of</strong> ancient basement rocks which are some <strong>of</strong><br />
the oldest on earth (pre-Cambrian age), estimated to be<br />
between 3000 - 6000 million years <strong>of</strong> age.<br />
The different landscapes bear great influence both<br />
direct and indirect, on the physical, biological, and<br />
human environments.<br />
For example, <strong>Uganda</strong> has rich and diverse climatic<br />
conditions, ecosystems, and other natural resources<br />
which include fresh water lakes, rivers, wetlands,<br />
fisheries, forests, wildlife, minerals, and soils that<br />
support different agricultural systems. Gifted by nature,<br />
the country was once referred to by Sir Winston Churchill<br />
as the ‘Pearl <strong>of</strong> Africa’.<br />
3<br />
John Gibbons: <strong>Uganda</strong> At A Glance 2002
<strong>Uganda</strong> experiences moderate temperatures<br />
throughout the year because <strong>of</strong> its location astride<br />
the equator and on a raised African plateau. The<br />
highest temperatures <strong>of</strong> over 30 0 C are experienced in the<br />
north and northeast <strong>of</strong> the country while temperatures<br />
as low as 4º C are experienced in the highlands <strong>of</strong> the<br />
southwest. Temperatures below 0ºC are registered on<br />
the high mountains <strong>of</strong> Rwenzori and Elgon. The Rwenzori<br />
mountains have a permanent ice cap whose size is<br />
currently reducing, presumably due to global warming<br />
(<strong>Uganda</strong> Met. Department, 2000; UBOS Statistical<br />
Abstracts, 2006).<br />
The high temperature records mean there is high<br />
potential for water evaporation, which in turn affects<br />
the water balance that influences the productivity <strong>of</strong><br />
the environment, including agriculture, the back bone<br />
<strong>of</strong> <strong>Uganda</strong>’s economy. Potential evaporation in excess <strong>of</strong><br />
rainfall leads to water deficit and vice versa.<br />
Temperature and rainfall are the most important<br />
parameters <strong>of</strong> climate in <strong>Uganda</strong>; temperatures are an<br />
important factor influencing rainfall and moisture, and in<br />
general play a major role in the determination <strong>of</strong> agroecological<br />
zones <strong>of</strong> the country.<br />
Most areas experience high potential for water<br />
evaporation in excess <strong>of</strong> rainfall. Therefore, sustainable<br />
management <strong>of</strong> water resources is needed. Water balance<br />
analysis in <strong>Uganda</strong> indicates that both areas <strong>of</strong> water<br />
surplus and water deficit occur. Water surplus occurs<br />
only around the high rainfall and low temperature areas<br />
<strong>of</strong> Mt. Rwenzori and Mt. Elgon. The northern shores <strong>of</strong><br />
Lake Victoria show a slight surplus or an almost even<br />
balance. Elsewhere, water deficits <strong>of</strong> varying degrees<br />
occur, generally increasing from south-west to north-east<br />
(Langlands 1974).<br />
Because <strong>of</strong> its location around the equator, <strong>Uganda</strong><br />
experiences equal hours <strong>of</strong> day light and night throughout<br />
the year, indicating that the country receives high solar<br />
radiation. However, periods <strong>of</strong> sunshine vary slightly<br />
during the day due to variations in cloud cover. The<br />
periods <strong>of</strong> high sunshine in the country are associated<br />
with lower relative humidity and a higher potential<br />
for evaporation. For example, the Lake Victoria basin<br />
experiences relatively low amounts <strong>of</strong> sunshine due to<br />
the usually cloudy skies while the south western highlands<br />
experience the lowest amounts <strong>of</strong> sunshine due to the<br />
unusually high cloud cover and prolonged light rains.<br />
4<br />
Climate<br />
Favourable climate in Manafwa District: Young men carry maize<br />
to a grinding mill at the nearby market<br />
NEMA 2008
Heavy rains in a Kampala surbub (December 2008) cause traffic jams, filth, diseases and incoveniences to road users and commercial establishments.<br />
Inset: L-R: Floods in Bwaise-Kalerwe, Kampala (2007); women and children struggle to cross flooded Aswa river in northern <strong>Uganda</strong>; floods in Kyambogo, Kampala (2005)<br />
Sunshine is an important environmental resource usually<br />
taken for granted in the country. Recently, through<br />
successful technological applications, solar energy<br />
has proved to be an important source <strong>of</strong> energy and is<br />
progressively being exploited by many to meet their<br />
energy needs.<br />
Likewise, because <strong>of</strong> its equatorial position, high rainfall,<br />
and numerous lakes, the relative humidity is high in most<br />
parts <strong>of</strong> the country throughout the year especially in the<br />
southern and central parts <strong>of</strong> <strong>Uganda</strong>.<br />
There are, however, spatial and temporal variations in<br />
humidity which are largely a reflection <strong>of</strong> rainfall and<br />
temperature variations.<br />
NEMA 2008<br />
NEMA 2007<br />
<strong>Uganda</strong> experiences low wind speeds due to the lack<br />
<strong>of</strong> long wind-fetch environmental conditions such as<br />
expanses <strong>of</strong> flat lands and water bodies. The location<br />
<strong>of</strong> the country in the continental interior and the highly<br />
contrasting local relief features obstruct the development<br />
<strong>of</strong> high wind speeds. Consequently, the potential for<br />
development <strong>of</strong> wind-based energy in the country is<br />
limited, though still a possibility.<br />
Although windspeeds <strong>of</strong> as low as 3m/sec can be used to<br />
generate energy for pumping water, utilisation <strong>of</strong> wind for<br />
energy generation involves initial high investment costs.<br />
However, this is a feasible innovation in irrigation and<br />
livestock agriculture and ideally suited for dry land areas<br />
such as Karamoja region and the rest <strong>of</strong> the cattle corridor.<br />
5<br />
NEMA 2008<br />
NEMA 2005
Rainfall distribution<br />
Figure 3: <strong>Uganda</strong>’s Rainfall<br />
6<br />
Kilometres<br />
<strong>Atlas</strong> <strong>of</strong> <strong>Uganda</strong> 1967
Climate disaster: Cattle trapped in a flooded Teso seasonal wetland after heavy rains. The wetland had been encroached on by massive rice growing (2007)<br />
<strong>Uganda</strong>’s rainfall and climatic patterns are<br />
influenced by variations in altitude, the Inter-<br />
Tropical Convergence Zone (ITCZ), and the<br />
air currents such as the South-East and North-East<br />
monsoons. In general, most parts <strong>of</strong> the country<br />
experience fairly well marked rainy and dry seasons.<br />
Furthermore, in areas adjacent to large water bodies<br />
such as Lake Victoria, maritime conditions tend to<br />
modify climate while in mountainous and highlands,<br />
climate is modified orographically (relief). The rainfall<br />
amounts vary over the country’s regions.<br />
Areas around Lake Victoria receive the highest annual<br />
rainfall averages <strong>of</strong> between 1200-2000 mm. The<br />
Karamoja region in the north-eastern part <strong>of</strong> the country<br />
is characterized by an intense hot and dry season lasting<br />
from November to March. This is followed by a single rain<br />
reason that begins from April and ends around August.<br />
This region receives the lowest average annual rainfall in<br />
the range <strong>of</strong> 300-625 mm. The rainfall peaks in May and<br />
July while the driest months are December and January<br />
that are characterized by extensive burning <strong>of</strong> the<br />
dominantly shrub vegetation. In the western region the<br />
mean annual rainfall is between 875-1000 mm. However,<br />
on the higher plateaus <strong>of</strong> the region, the rainfall is over<br />
1250 mm.<br />
<strong>Uganda</strong> is divided into the following six climatic zones,<br />
mainly based on rainfall patterns (Figure 4).<br />
Floods caused by heavy rains in Aswa county (2007)<br />
7<br />
NEMA 2007<br />
NEMA 2007
Zone 1: Lake Victoria Basin<br />
Zone 2: Karamoja<br />
Zone 3: Western <strong>Uganda</strong><br />
8<br />
Climatic zones<br />
Figure 4: Climatic zones <strong>of</strong> <strong>Uganda</strong><br />
Zone 4: Acholi-Kyoga<br />
Zone 5: Southern <strong>Uganda</strong><br />
Zone 6: Mount Elgon<br />
<strong>Atlas</strong> <strong>of</strong> <strong>Uganda</strong>, 1967
Zone I Lake Victoria Basin<br />
This zone is located around Lake Victoria and extends for a distance varying between<br />
48-64 km inland from the lake shore. Rainfall varies from 1250 mm to over 2000 mm per<br />
annum. Rainfall is received throughout the year with two rainfall peaks in April-May<br />
and October-November; and two relatively low rainfall periods between December-<br />
March and June-July. The rainfall peaks are associated with the onset <strong>of</strong> southeast<br />
and northeast monsoon winds. Temperature, humidity, and wind patterns in this<br />
zone display comparatively small variations throughout the year.<br />
Zone II Karamoja<br />
This zone is characterized by a long and hot dry season lasting from November to<br />
March. It is the driest and hottest part <strong>of</strong> the country. There is a single rainy season<br />
from April to August. Average annual rainfall is between 300 mm and 600 mm,<br />
declining from west to east <strong>of</strong> the zone.<br />
Zone III Western <strong>Uganda</strong><br />
This zone forms a relatively narrow belt along the entire western extremities <strong>of</strong><br />
the country. The eastern limits <strong>of</strong> the zone are, however, difficult to determine.<br />
It includes the highland area <strong>of</strong> West Nile region, the escapement <strong>of</strong> the Albertine<br />
rift valley, the rift valley, the South Western highland region, and the mountains<br />
<strong>of</strong> Rwenzori and Muhavura. On the plateau, escarpment, and in the highlands<br />
rainfall is about 1250 mm, while in the mountains it increases to over 2000 mm.<br />
Generally, rainfall increases with altitude in the entire zone. The rift valley<br />
section experiences low rainfall, with averages <strong>of</strong> less than 875 mm. Temperature<br />
conditions vary widely from cold in the mountains, cool in the highlands to hot on<br />
the rift valley floor.<br />
Zone IV Acholi-Kyoga<br />
The zone includes much <strong>of</strong> the northern and part <strong>of</strong> eastern <strong>Uganda</strong>. The average<br />
rainfall is from 1250 mm to 1500 mm and mainly occurs between April and October<br />
(Wet season). The dry period usually extends from November to March. Rainfall is<br />
mainly convectional, characterized by afternoon and evening occurrences.<br />
Zone V Southern <strong>Uganda</strong><br />
This zone extends from eastern to south-western <strong>Uganda</strong>, up to Rakai District. It<br />
experiences double maxima rainfall patterns with averages ranging from 875 mm<br />
to 1125 mm. The rainy seasons occur between April-May and September-November.<br />
The zone experiences two dry seasons, from June to July and December to January.<br />
The rainfall patterns in this zone are largely influenced by the maritime Lake Victoria<br />
conditions and the Inter-tropical Convergence Zone (ITCZ). The rainfall is dominated<br />
by thunderstorms <strong>of</strong> convectional nature.<br />
Zone VI Mount Elgon<br />
This zone experiences the main rains from March to September but with a sharp<br />
dry spell in June, and with a dry period from December to February. The rainfall<br />
patterns are influenced by both the orographic effects <strong>of</strong> the mountains and the<br />
proximity to Lake Victoria, through increasing total rainfall and decreasing the<br />
severity <strong>of</strong> the dry period. On the mountain foot hills and slopes, rainfall decreases<br />
from south (1250-1500 mm) to north (1000 mm) with the northern slopes falling<br />
within the rain shadow <strong>of</strong> the mountain.<br />
Human settlements along the shores <strong>of</strong> Lake Victoria in Bugiri District.<br />
The trees planted by communities did not effectively ameliorate<br />
the effects <strong>of</strong> climatic extremes in the area as the regulations on<br />
managememt <strong>of</strong> the catchment zone were not adhered to (2005)<br />
Dried Mubuku River during the dry season, Kasese District. In<br />
the background: Mt. Rwenzori ranges (2008)<br />
Maritime climatically influenced Lake Victoria plains at<br />
Kakira in Jinja District (2008)<br />
Heavy rainfall triggered landslides on Mt. Elgon at Busayi<br />
Bududa in November 1997; it destroyed 97 houses.<br />
9<br />
NEMA 2005<br />
NEMA 2008<br />
NEMA 2008<br />
NEMA 2008
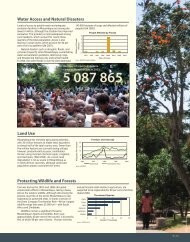
A degraded lake-shore catchment zone on Lake Albert, Nebbi District (2006)<br />
<strong>Uganda</strong> is well endowed with water resources<br />
which consist <strong>of</strong> open water bodies (lakes and<br />
rivers), wetlands, groundwater, and rain water.<br />
Of the 241,500 km 2 total area <strong>of</strong> the country, fresh water<br />
lakes occupy 36,280 km 2 (15%), while 5,180 km 2 (2.2%)<br />
are covered by permanent wetlands. Lake Victoria is the<br />
largest lake in <strong>Uganda</strong> and the world’s second largest<br />
fresh water lake. Several lakes are shared between<br />
<strong>Uganda</strong> and the neighbouring countries, while others are<br />
entirely located within the country.<br />
This water is used in several ways: domestic consumption<br />
in rural and urban areas, for industry, agriculture,<br />
wildlife, transport and power generation. In addition,<br />
the open water bodies and wetlands are home to rich<br />
biodiversity including fisheries resources.<br />
Furthermore, wetlands which occupy the transition<br />
between open water bodies and terrestrial eco-systems<br />
perform important regulatory functions such as filtration<br />
<strong>of</strong> pollutants from the mainland.<br />
Water resources in <strong>Uganda</strong> are maintained through a<br />
dynamic balance between precipitation, evaporation and<br />
evapo-transpiration from open water, swamps and land in<br />
general. For example, <strong>of</strong> the estimated 118 billion cubic<br />
metres <strong>of</strong> water entering Lake Victoria from rivers and<br />
streams, 94.5 billion cubic metres (80%) evaporates, leaving<br />
only 23.5 cubic metres (20%) to flow into River Nile.<br />
The actual evaporation ranges from 45% in dry areas to<br />
about 92% in humid areas.<br />
10<br />
Water Resources<br />
NEMA 2008<br />
Children at a hand-wash safe water point, Kamuli District (2006)<br />
NEMA 2006<br />
NEMA 2005<br />
NEMA 2006<br />
Simwondwa 2006
Water levels in major lakes<br />
Lake Bunyonyi in Kabale District, Western <strong>Uganda</strong> (2008). The lake catchments are well managed.<br />
Water levels<br />
From 1948 Lake Edward highest water levels ever<br />
recorded is 2.68 meters in May 1978 and the lowest is<br />
0.91 meters in July 2000. This is a difference <strong>of</strong> 1.77<br />
meters between the highest and lowest water levels ever<br />
recorded on the lake. The lowest water levels can be<br />
attributed to the drought conditions from 1999 (La Niña).<br />
From 1945 Lake George highest water level ever<br />
recorded is 5.19 meters in May 2002 and the lowest is<br />
4.08 meters in march 1974. This is a difference <strong>of</strong> 1.11<br />
meters between the highest and the lowest water levels<br />
ever recorded.<br />
Major Lakes Catchment Areas<br />
Nearly the entire country lies within the River Nile Basin<br />
save for a small portion in the north east that drains into<br />
Lake Turkana.<br />
Most <strong>of</strong> the Lakes in <strong>Uganda</strong> may be classified as shallow;<br />
for example Victoria the largest lake has an average<br />
depth <strong>of</strong> only 82 m, while some <strong>of</strong> the lakes like Kyoga<br />
have average depths <strong>of</strong> less than 10m. The lakes, Edward<br />
and Albert and the volcanic lava dammed Lake Bunyonyi,<br />
have the greatest depths presumably due to deeper<br />
depressions created by intense warping and later filled<br />
with water.<br />
Figure 5: Lake Edward<br />
Figure 6: Lake George<br />
Lake Edward Water Levels (metres)<br />
Lake George Water Levels (metres)<br />
The varying depths have an important bearing on the<br />
water storage capacity <strong>of</strong> the lakes and sensitivity to<br />
reduction in storage due to the increasing problem <strong>of</strong><br />
silting as a result <strong>of</strong> environmental change.<br />
<strong>Uganda</strong> is well endowed with drainage systems, with a<br />
large number <strong>of</strong> rivers and streams draining from eight<br />
river basins into River Nile.<br />
UBOS 2008<br />
UBOS 2008<br />
11<br />
NEMA 2008
Lake Water Levels<br />
Lake Victoria highest water level ever<br />
recorded is 13.34 meters in May 1964 and<br />
the lowest is 10.46 meters in October 2006;<br />
a difference <strong>of</strong> 2.88 meters.<br />
The highest water level was attributed to<br />
heavy rains (El Niño) that occurred in 1963,<br />
while the lowest level can be attributed to<br />
drought conditions over the lake basin (La<br />
Niña) from 1999.<br />
From 1948 L. Albert highest water level<br />
recorded is 14.16 meters in June 1963 and<br />
the lowest is 9.61 meters in March 1951; a<br />
different <strong>of</strong> 4.55 meters.<br />
The highest level was attributed to the<br />
1963 heavy rains (El Niño)<br />
12<br />
14<br />
13<br />
12<br />
11<br />
10<br />
9<br />
8<br />
Source: DWRM, MWE<br />
15<br />
14<br />
13<br />
12<br />
11<br />
10<br />
9<br />
Source: DWRM, MWE<br />
Lake Victoria Water levels at Jinja Pier (metres)<br />
Lake Victoria Water Levels, at Jinja Pier (metres)<br />
Nov-47 Oct-54 Aug-61 Jun-68 Apr-75 Feb-82 Dec-88 Oct-95 Sep-02 Jul-09<br />
Lake Albert Water levels at Butiaba (metres)<br />
Lake Albert water Levels, at Butiaba (metres)<br />
8<br />
Jul-46 Apr-55 Jan-64 Oct-72 Aug-81 May-90 Feb-99 Nov-07
14<br />
13<br />
12<br />
11<br />
10<br />
9<br />
6.5<br />
6.0<br />
5.5<br />
5.0<br />
4.5<br />
4.0<br />
3.5<br />
3.0<br />
2.5<br />
Source: DWRM, MWE<br />
Lake Wamala Lake Wamala Water Water levels Level (metres)<br />
2.0<br />
Oct-95 Mar-97 Jul-98 Dec-99 Apr-01 Sep-02 Jan-04 May-05 Oct-06 Feb-08 Jul-09<br />
Source: DWRM, MWE<br />
Lake Kyoga lake Kyoga Water levels Levels, at at Bugondo (metres)<br />
8<br />
Apr-49 Dec-62 Aug-76 May-90 Jan-04<br />
13
14<br />
River Basins, Lakes and Wetlands<br />
Figure 7: River Basins in <strong>Uganda</strong><br />
Major basins<br />
Rivers and lakes<br />
<strong>Uganda</strong>_boundary<br />
Directorate <strong>of</strong> Water Resources Management, 2008<br />
NEMA 2008
Aerial view <strong>of</strong> the River Nile at Moyo, West Nile region (2008)<br />
Silted streams in Dufile (Laropi) sub-catchment that empties into the River Nile<br />
Edema Maurice<br />
15<br />
Edema Marice 2008<br />
Edema Maurice
Figure 8: <strong>Uganda</strong>’s water potential<br />
16<br />
Drainage<br />
NEMA 2008<br />
Kilometres<br />
Directorate <strong>of</strong> Water Resources Management, 2008
Water transport at Port Bell on Lake Victoria. In the recent past, the port area has been infested with an algae bloom suspected to be a result <strong>of</strong><br />
increased pollution from Kampala City in the immediate hinterland, through Nakivubo Channel, making the water dirty and smelly.<br />
The drainage system <strong>of</strong> <strong>Uganda</strong> portrays a dense texture<br />
and is highly complex, especially in the western parts<br />
<strong>of</strong> the country. It is mainly influenced by landscape<br />
structure, as a result <strong>of</strong> the initial uplift <strong>of</strong> the African<br />
surface in this eastern part <strong>of</strong> the continent; and then<br />
the tectonic and volcanic activities that took place<br />
during the later geological times. As result <strong>of</strong> initial<br />
uplift <strong>of</strong> the African surface (plateau) the <strong>Uganda</strong> part<br />
<strong>of</strong> the plateau is thought to have experienced gradual<br />
tilt westwards. Consequently, most rivers were drained<br />
westwards into the River Congo in Central Africa. Later,<br />
with the formation <strong>of</strong> the uplifted shoulder <strong>of</strong> the<br />
Western Rift Valley, the rivers became reversed to flow<br />
along their courses into a down-warped axis to form lakes<br />
Victoria and Kyoga.<br />
Many rivers flow through valleys with an imperceptible<br />
break in swamps from which water flows out in each<br />
direction.<br />
Many <strong>of</strong> the rivers, especially those <strong>of</strong> the west, flow<br />
sluggishly in unusually wide valleys. The rivers <strong>of</strong> eastern<br />
<strong>Uganda</strong> generally flow in the old courses and in their<br />
original direction. The rivers <strong>of</strong> the rift escarpment became<br />
rejuvenated along their lines and flow in their original<br />
direction. Another effect on drainage is the formation<br />
<strong>of</strong> mountains from which arise, a clear radial pattern <strong>of</strong><br />
drainage systems. The mountains serve as an important<br />
water tower and perennial source <strong>of</strong> water for the<br />
surrounding areas and beyond.<br />
The combination <strong>of</strong> structure and rich drainage system<br />
has made <strong>Uganda</strong>’s rivers to possess high potential<br />
for hydro-electric power production, as most <strong>of</strong> them<br />
pass through a series <strong>of</strong> falls and rapids. This provides<br />
opportunities for environmental sustainability and<br />
development since hydro power is a clean and cheap<br />
energy. Additionally, it is a potential substitute to some<br />
<strong>of</strong> the fossil fuel and fuel-wood energy sources to meet<br />
needs in the country.<br />
17<br />
NEMA 2008
The water problem in Kamuli District, Eastern <strong>Uganda</strong> makes harnessing<br />
<strong>of</strong> ground water the best option: children collect water from a community<br />
ground water pump (borehole).<br />
Although exploitation <strong>of</strong> surface water resources still accounts<br />
for more than 50% <strong>of</strong> the population needs, ground water<br />
resources are increasingly becoming important. However, its<br />
full potential is yet to be established, and it is believed that<br />
its development will go a long way in meeting the projected<br />
increased demand in future.<br />
Ground water potential in the country is mainly determined<br />
by the geology and rainfall in a given area. Generally, areas<br />
underlain by fine grain rocks and soils have low ground water<br />
potential because <strong>of</strong> limited infiltration compared to those with<br />
coarse grain rocks and sandy soils. Similarly, low rainfall areas<br />
have low ground water because <strong>of</strong> low infiltration.<br />
The geology <strong>of</strong> <strong>Uganda</strong> is not especially rich in ground water<br />
because <strong>of</strong> lack <strong>of</strong> true aquifers. Ground water is <strong>of</strong>ten readily<br />
available from fissures in the Gneissic Complex at about 100<br />
m depth. The bulk <strong>of</strong> <strong>Uganda</strong> is under-lain by this Gneissic<br />
Complex which is <strong>of</strong> pre- Cambrian age. In the limited area <strong>of</strong><br />
the country where ground water resources have been exploited,<br />
there is evidence <strong>of</strong> gradual decrease in the level <strong>of</strong> ground<br />
water which has been attributed to abstraction in access <strong>of</strong><br />
yield. There is need for surveying and mapping <strong>of</strong> ground water<br />
resources potential in the country and assessing the sensitivity<br />
<strong>of</strong> this resource to excessive abstraction.<br />
18<br />
Ground water<br />
Credit.........<br />
Simondwa 2006<br />
Children access water from a protected spring in<br />
Bugiri District (2005)<br />
Communities in Northern <strong>Uganda</strong> access<br />
unsafe surface water for domestic use (2005)
NEMA 2005<br />
NEMA 2005<br />
NEMA 2005<br />
Soroti Catholic Diocese Integrated Development Organisation (SOCADIDO) displays a borehole and its benefits during<br />
World <strong>Environment</strong> Day celebrations (2006) in Kumi District.<br />
<strong>Environment</strong>al Education/Education for Sustainable Development. Children involvement in environment management:<br />
A pupil’s drawing produced during the World <strong>Environment</strong> Day (2003) <strong>Uganda</strong> Primary Schools Art competitions under<br />
the theme “Water, we all need it, save and conserve it”.<br />
33<br />
19<br />
NEMA 2006<br />
Credit.......................<br />
NEMA 2003
Figure 9: <strong>Uganda</strong>’s Land Cover Classification<br />
Land constitutes the main resource capital that is<br />
available to the people <strong>of</strong> <strong>Uganda</strong>. Specifically, land<br />
supports agriculture on which the country depends<br />
as an engine for economic growth and as a basis for<br />
rural livelihoods. The total area <strong>of</strong> <strong>Uganda</strong> is estimated<br />
at about 241,551 km 2 , consisting <strong>of</strong> subsistence and<br />
commercial farmland, grassland, woodland, water<br />
bodies, bushlands, tropical high forest (THF)–normal and<br />
degraded, and others such as plantations and built-up<br />
20<br />
Land cover / Land use<br />
Legend<br />
CLASS<br />
Deciduous Decidous plantations plantaions<br />
Coniferous Needle leaved forest<br />
THF wheel well weel stocked<br />
THF low stocked<br />
Woodland<br />
Bush<br />
Grassland<br />
Wetland<br />
Subsistence<br />
Large scale farmland<br />
Built up area<br />
Open water<br />
Impediments<br />
0 35 70 140 210 280<br />
Kilometres<br />
350<br />
areas. Land is therefore central to people’s livelihoods<br />
and development, since it is the basis for all activities in<br />
the country.<br />
Land in <strong>Uganda</strong> is distributed between families, gender,<br />
tribes, clans and economic classes, as well as between<br />
private and public ownership. This mosaic has affected<br />
the distribution <strong>of</strong> land and associated resources as<br />
well as their management practices since it is the most<br />
important factor <strong>of</strong> production in the country today.<br />
National Forestry Authority (NFA) 2008<br />
NEMA 2006
Cattle grazing in demarcated paddocks to ensure sustainbale landuse in Ntungamo District, Western <strong>Uganda</strong> (2008)<br />
According to Article 237 <strong>of</strong> the Constitution <strong>of</strong> the<br />
Republic <strong>of</strong> <strong>Uganda</strong> 1995, land belongs to the citizens<br />
<strong>of</strong> the country under the following tenure systems:<br />
customary, <strong>of</strong> the different types <strong>of</strong> ownership,<br />
utilization, freehold, mailo, and leasehold and the<br />
various degrees (GoU, 1995).<br />
As a result <strong>of</strong> the different ownership types, utilisation<br />
and management systems, the ability <strong>of</strong> <strong>Uganda</strong>’s land<br />
to support plant and animal life, preserve terrestrial<br />
biodiversity and regulate hydrological cycles and<br />
other ecosystem services has been affected to various<br />
degrees, especially under freehold land tenure. The<br />
various activities on land have resulted in reductions<br />
in productive capacities, leading to land degradation<br />
(NSOER. 2002)<br />
21<br />
NEMA 2008
Terraced gardens and intensive tree planting on farm plot boundaries and on<br />
marginal slopes in Kabale District, Western <strong>Uganda</strong> (2008). Kigezi highland is<br />
a productive region renowned for a temperate-like cool climate that support<br />
horticultural agriculture.<br />
Tororo Rock, a unique ecosystem in Tororo District, Eastern <strong>Uganda</strong> protected by<br />
the Local authorities (2007). Tororo is on the eastern border with Western Kenya.<br />
Clearing <strong>of</strong> forest in Mukono District, Central <strong>Uganda</strong> (2004). Most <strong>of</strong> the forest<br />
cover on private land in Mukono has been depleted for brickmaking and charcoal<br />
burning.<br />
22<br />
Land use<br />
NEMA 2008<br />
NEMA 2007<br />
NEMA 2004<br />
Mt. Rwenzori ranges in Kasese District , South-Western <strong>Uganda</strong> (2007).<br />
Intensive human activities on the ruggesd mountain slopes have led to<br />
destruction <strong>of</strong> vegetation cover and accelerated erosion.<br />
NEMA sensitising communities in Ibanda District, Western <strong>Uganda</strong> on<br />
restoration and conseravtion <strong>of</strong> fragile ecosystems, including bare<br />
hills through afforestation and terracing (2006)<br />
Degraded rangeland ecosystems: a boy tends cattle in poor pastures<br />
chocked with bushes dominated by thorny speciec (inset) in the<br />
cattle corridor drylands <strong>of</strong> Nakasongola District (2008)<br />
NEMA 2007<br />
NEMA 2006<br />
NEMA 2008
Bush burning in Karamoja plains, North Eastern <strong>Uganda</strong> (2008). Karamoja is a dry pastoral-nomadic region that is facing<br />
problems <strong>of</strong> land degradation and severe shortages <strong>of</strong> pasture and water. Inset: Karamoja lean cattle and sorghum garden.<br />
Kapchorwa terrain on the slopes <strong>of</strong> Mt. Elgon in Kapchorwa District, Eastern<br />
<strong>Uganda</strong> (2008). Kapchorwa suffers from recent deforestation that sparked <strong>of</strong>f<br />
severe soil erosion and land degradation.<br />
Drylands <strong>of</strong> Nakasongola in the cattle corridor (2008). The trees known for<br />
producing strong charcoal and firewood were recently depleted mainly for<br />
commercial charcoal burning.<br />
NEMA 2008<br />
NEMA 2008<br />
NEMA 2008<br />
Karamoja lean cattle and sorghum garden<br />
Pine trees planted by Kaharo Friends <strong>of</strong> the <strong>Environment</strong> Association in Kabale<br />
District, under the NEMA Districts Micro Projects Support Programme (2007).<br />
L-R: Mr. Paul Sabiti, District <strong>Environment</strong> Officer, Kabale, poses with the<br />
Chairman <strong>of</strong> the Association in front <strong>of</strong> the pine trees.<br />
Innovations in improved land productivity and nutrition: ‘Basket gardening’<br />
is commonly used by communities as ‘back-yard gardening’ as well as an<br />
alternative to land scarcity situations to ensure sustainable nutrition.<br />
23<br />
NEMA 2008<br />
NEMA 2008 NEMA 2008<br />
NEMA 2001
22<br />
Wetlands: about 33,000 km 2 ; 13% <strong>of</strong> country’s total area<br />
Figure 10: Distribution <strong>of</strong> wetlands in <strong>Uganda</strong><br />
24<br />
Kilometres
A vibrant papyrus wetland in Gaba, Kampala District (2005)<br />
<strong>Uganda</strong> has extensive wetland coverage, although<br />
the information about the exact size and<br />
distribution is yet to be established. Current<br />
estimates put the total area <strong>of</strong> wetlands at about<br />
33,000 Km 2 covering about 13% <strong>of</strong> the country’s total<br />
area. The wide coverage <strong>of</strong> wetlands in the country is<br />
influenced by a number <strong>of</strong> physical factors, especially<br />
the incidence <strong>of</strong> high rainfall and the nature <strong>of</strong> the<br />
landscape dominated by flat low land surfaces and,<br />
depressions which arose from past geological episodes<br />
leading to leveling <strong>of</strong> the African surface and later<br />
the teriary period tectonic activities associated with<br />
warping.<br />
There is extensive occurrence <strong>of</strong> wetlands around most<br />
<strong>of</strong> <strong>Uganda</strong>’s lakes and along most <strong>of</strong> the rivers especially<br />
the drowned river valleys that were affected by warping.<br />
23<br />
NEMA 2005<br />
25
Name <strong>of</strong> Ramsar site Year <strong>of</strong> Site Area Conservation<br />
designation No. (Ha.) importance<br />
Lake George System 4/03/1988 394 15,000 Flora and Fauna<br />
Lake Nabugabo Wetland System 11/02/2004 1373 22,000 Bird and Acquatic<br />
Sango Bay-Musambwa Island-Kagera 16/09/2005 1641 6,053 Flora and Bird<br />
Lake Mburo-Nakivali Wetlands System 22/09/2005 1634 25,572 Flora and Fauna<br />
Lake Opeta Wetland System 17/09/2005 1636 68,913 Bird<br />
Mabamba Bay Wetlands System 18/09/2005 1638 2,424 Bird<br />
Nabajjuzi Wetlands System 20/09/2005 1639 54,229 Bird<br />
Lake Bisina Wetland System 15/09/2005 1633 91,150 Bird and Fauna<br />
Lake Nakuwa Wetland System 16/09/2005 1635 108 Bird<br />
Lutembe Bay Wetland System 18/09/2005 1637 20,163 Bird<br />
Murchison Falls Wetlands System 20/09/2005 1640 22,400 Flora and Fauna<br />
Rwenzori Mountains Proposed 22,400 Flora and Fauna<br />
Total area <strong>of</strong> Ramsar site<br />
Figure 10: Ramsar sites in <strong>Uganda</strong><br />
307,756<br />
The Ramsar Convention, also known as the Conservation<br />
on Wetlands, is an international treaty on conservation<br />
and wise use <strong>of</strong> wetlands. <strong>Uganda</strong>, which joined the<br />
Convention in 1988, now has 11 Ramsar sites covering a<br />
surface area <strong>of</strong> 354,803 hectares. An additional site with a<br />
surface area <strong>of</strong> 22,400 hectares, named Rwenzori has been<br />
proposed for designation (Fig. 10). Globally, the Convention’s<br />
153 Contracting Parties have designated 1626 Ramsar sites,<br />
covering 145,594,013 hectares.<br />
The Convention on Wetlands, signed in Ramsar, Iran, in 1971,<br />
is an intergovernmental treaty which provides the framework<br />
for national action and international cooperation for the<br />
conservation and wise use <strong>of</strong> wetlands and their resources.<br />
26<br />
Ramsar Convention<br />
Figure 11: Locations <strong>of</strong> the Ramsar sites in <strong>Uganda</strong><br />
Guide to Ramsar sites: Mabamba Ramsar site,<br />
Mpigi District (2006)<br />
<strong>Uganda</strong> has provided an enabling environment for<br />
the conservation <strong>of</strong> wetlands through formulation<br />
<strong>of</strong> appropriate policies, legislation and a ten-year<br />
strategic plan (2000-2010). However, the country<br />
still requires more efforts in fostering sustainable<br />
use <strong>of</strong> wetlands as well as monitoring and research<br />
to inform the implementation <strong>of</strong> the convention.<br />
To date the country has implemented several<br />
provisions <strong>of</strong> the Ramsar Convention which includes;<br />
• Establishment <strong>of</strong> Wetlands Department in the<br />
Ministry <strong>of</strong> Water and <strong>Environment</strong> and existence<br />
<strong>of</strong> wetlands management institutions at both<br />
national and district levels<br />
• Development <strong>of</strong> the National Wetlands Policy to<br />
support wetlands conservation<br />
• Incorporation <strong>of</strong> a section on wetlands in<br />
the National <strong>Environment</strong> Act, Cap 153,<br />
and development <strong>of</strong> <strong>Environment</strong> Management<br />
Regulations (2000) thereunder, to specifically<br />
address wetlands management<br />
• Incorporation <strong>of</strong> several clauses related to<br />
wetlands in several national legislations such as<br />
the Local Government Act (1997) and Land Act<br />
(1998)<br />
• Preparation <strong>of</strong> Seventeen (17) guidelines for<br />
wetland policy implementation<br />
• Awareness creation<br />
• Launching and implementation <strong>of</strong> a 10-year<br />
Wetlands Strategic Plan<br />
The Government is encouraging national and local<br />
governments and non governmental institutions to<br />
design and adopt wise use <strong>of</strong> wetlands with full participation <strong>of</strong><br />
the local communities.<br />
Challenges <strong>of</strong> Ramsar sites management in <strong>Uganda</strong><br />
A number <strong>of</strong> challenges still remain to realise fully the ability<br />
to, and benefits <strong>of</strong>, implementing the Convention which<br />
include, among others:<br />
• Computing land use changes e.g oil exploration in<br />
Murchison Falls<br />
• Government <strong>of</strong> <strong>Uganda</strong> still has the challenge <strong>of</strong><br />
clearly demonstrating the benefits <strong>of</strong> the Ramsar<br />
sites to the stakeholders especially the surrounding<br />
local communities.<br />
However, there are already visible benefits from these sites<br />
through increased tourism presumably resulting from the<br />
international publicity that attracts tourists to <strong>Uganda</strong> who<br />
make the sites as one <strong>of</strong> their destination.
Credit.........................<br />
Credit......................<br />
Wetland management<br />
Hon. Maria Mutagamba, Minister <strong>of</strong><br />
Water and <strong>Environment</strong><br />
<strong>Uganda</strong> Wins Wetland Management Award (21/10/06)<br />
<strong>Uganda</strong> has scooped an award for best African country in sustainable management <strong>of</strong> wetlands.<br />
<strong>Environment</strong> minister Maria Mutagamba received the award from African Union representative<br />
Dr. Abou Bamba at a conference for the African Ministers’ Council on Water (AMCOW) at Speke<br />
Resort Munyonyo on Thursday.<br />
She handed over the award to the First Lady, Mrs. Janet Museveni, who presided over the function.<br />
Mutagamba said <strong>Uganda</strong> was the only country in Africa with a Wetlands Inspection Division in addition to<br />
the 10 internationally recognised Ramsar sites.<br />
She said <strong>Uganda</strong> was the only country in Africa which had hosted the Ramsar convention and the only<br />
country in Africa, which had held the presidency for the Ramsar convention.<br />
<strong>Uganda</strong> hosted the convention last year in August 2006 at Munyonyo, Kampala.<br />
“<strong>Our</strong> recognition on wetlands management was not by chance. There are a lot <strong>of</strong> things <strong>Uganda</strong> has done for sustainable management <strong>of</strong><br />
wetlands,” she said. Mutagamba added that <strong>Uganda</strong> had good policies on wetlands compared to other African countries.<br />
She said due to increased industrialisation, population and environmental degradation, water levels for lakes and rivers were falling, causing<br />
what she termed as water stress.<br />
She cited Mali, where she said a bottle <strong>of</strong> water is more expensive than a bottle <strong>of</strong> whiskey. She attributed depreciation <strong>of</strong> lake levels to the<br />
rising temperatures as a result <strong>of</strong> global warming and evaporation.<br />
German Ambassador Dr. Alexander Muehlen said when one first comes to <strong>Uganda</strong>, the impression is that there is sufficient water for<br />
everybody.<br />
© New Vision Newspaper, 2007<br />
Below: Migratory birds at Lutembe Ramsar site on Lake Victoria<br />
27
Wetlands: importance and uses<br />
28<br />
<strong>Uganda</strong>’s wetlands can be categorized as papyrus<br />
swamp, swamp forests, lacustrine (lake edge),<br />
riverine, flood plains and damboos. These can<br />
be further categorized into permanent and<br />
seasonal wetlands. The most common type <strong>of</strong><br />
wetland is papyrus swamp dominated by Cyperus<br />
papyrus. A bout 69% <strong>of</strong> the total area under<br />
wetlands is impeded drainage while seasonal<br />
swamps and swamp forests constitute 30% and 1 %<br />
respectively.<br />
Wetlands in <strong>Uganda</strong> perform important chemical,<br />
hydrological, ecological and socio-economic<br />
functions. The major functions and values include;<br />
source <strong>of</strong> products such as water, fish, forage and<br />
grazing resources, wood fuel, building and craft<br />
materials, sand, clay and medicines; provision<br />
<strong>of</strong> services such as purification <strong>of</strong> water through<br />
filtering <strong>of</strong> both silt, and industrial and domestic<br />
effluent; regulate water flow and enhance ground<br />
water recharge; moderation <strong>of</strong> climate; retention<br />
<strong>of</strong> carbon; and provide landscape aesthetic<br />
resources for recreation and eco- tourism.<br />
Further more, wetlands have important attributes<br />
including habitat for aquatic life, biodiversity<br />
and genetic resources conservation. Therefore, a<br />
large proportion <strong>of</strong> <strong>Uganda</strong>’s population directly<br />
or indirectly depends on wetlands for their<br />
livelihoods.<br />
<strong>Uganda</strong>’s wetlands are faced with a number <strong>of</strong><br />
threats <strong>of</strong> degradation especially resulting from<br />
population pressure and economic development.<br />
Wetlands throughout the country are increasingly<br />
being encroached upon and reclaimed mainly<br />
for agriculture and settlements. Specifically,<br />
the main human activities that are leading to<br />
degradation <strong>of</strong> wetlands include drainage for<br />
agricultural purposes, sand and clay mining,<br />
over-harvesting <strong>of</strong> biomass, dumping <strong>of</strong> solid<br />
waste and pollution through release <strong>of</strong> industrial<br />
effluent and domestic waste. The impact <strong>of</strong> all<br />
these is far reaching, and is already threatening<br />
the integrity and sustainability <strong>of</strong> these vital<br />
resources. The current and potential impacts<br />
include increased floods, shortage <strong>of</strong> building and<br />
crafts materials, reduction in fish productivity<br />
(for example, disappearance <strong>of</strong> mud fish) decline<br />
in water quantity and quality, reduced ground<br />
water recharge and decline in the water table as<br />
exemplified by the disappearance <strong>of</strong> water springs.<br />
Baskets made out <strong>of</strong> papyrus reeds<br />
Kyojja Wetland<br />
Managmenet Association<br />
<strong>of</strong>fices in Masaka District.<br />
The building is made <strong>of</strong><br />
wetland products (2005).<br />
The Association manages<br />
Kyojja wetland to ensure<br />
its sustainability and<br />
improved livelihoods.<br />
23<br />
NEMA 2005<br />
NEMA 2008
Wetlands<br />
Poster on Poverty Eradication by the Wetland Management Department,<br />
Ministry <strong>of</strong> Water and <strong>Environment</strong> (2007)<br />
Display <strong>of</strong> crafts and wetland products during the Commonwealth Heads <strong>of</strong><br />
Government Meeting (CHOGM) Exhibitions 2007 in Kampala<br />
Children fishing in a wetland in Iganga District<br />
Wetland Management Department,(2007)<br />
NEMA 2007<br />
Mud fish (Mamba) display during Wetlands Day Celebrations 2007 held at<br />
Mabamba, Mpigi District<br />
Civil Society Organisations (CSOs) collaboration in national programmes<br />
and activities: Wetlands products (mats, baskets, bags and other crafts)<br />
display by MFACOI an NGO from Kamuli District, during exhibitions to<br />
mark World <strong>Environment</strong> Day Celebrations 2007 at Nkaiga, Kasese District.<br />
29<br />
NEMA 2008<br />
NEMA 2007<br />
NEMA 2007
Wetlands: threats<br />
Indiscriminate dumping <strong>of</strong> solid waste in a papyrus swamp along Kireka valley (left) and on the shores <strong>of</strong> Lake Victoria in a Kampala surbub (right).<br />
Dumping <strong>of</strong> solid wastes in wetlands is a common practice in urban areas. Depositing substances in a wetland is a prohibited activity under the<br />
<strong>Environment</strong> Law (National <strong>Environment</strong> Act, Cap 153).<br />
Prohibited: Dumping medical waste in a wetland in Adjumani District (2008) Brickmaking is one <strong>of</strong> the regulated activities in a wetland (2007)<br />
30<br />
NEMA 2007<br />
NEMA 2008<br />
NEMA 2006<br />
NEMA 2007<br />
NEMA 2007<br />
NEMA 2007
Wetlands: education and interventions<br />
School field visit to Kinawataka wetland: Pupils <strong>of</strong> Kiswa Primary School,<br />
Kampala District, learn about regulated activities in a wetland (2006)<br />
Recovery <strong>of</strong> Nakayiba wetland in Masaka Municipality one year after restoration (2006)<br />
NEMA 2006<br />
<strong>Environment</strong>al Education: Pupils learn about wetlands in rural Kangulumira,<br />
Kayunga District (2005)<br />
31<br />
NEMA 2006<br />
NEMA 2005<br />
NEMA 2006
Wetlands: interventions<br />
Wetland restoration in progress: Demolition <strong>of</strong> illegal structures in the Nsooba-Lubigi wetland, a surbub on the outskirts <strong>of</strong> Kampala City (2009).<br />
Enforcement has been intensified in the wake <strong>of</strong> increased wetland degradation in Kampala and other parts <strong>of</strong> the country.<br />
32<br />
NEMA 2009<br />
NEMA 2007
Hon. Jennifer Namuyangu, Minister <strong>of</strong> State for Water (front-right) prepares to plant a tree to mark World Wetlands Day celebrations held<br />
at Sezibwa Falls, Mukono District February 2008. Mr. Paul Mafabi (second from left), Commissioner for Wetlands explains to the Minister.<br />
33<br />
NEMA 2008
Plant a tree for the future: A girl plants a tree during national celebrations to mark World <strong>Environment</strong><br />
Day, 5 June 2006 in Kumi District under the theme “Protect Drylands against Desertification”<br />
34<br />
NEMA 2006
Forests: Forest Reserves<br />
Legend<br />
CLASS<br />
Coniferous Needle leaved forest<br />
THF weel well stocked<br />
THF low stocked<br />
Woodland<br />
Figure 11: Forest Reserves in <strong>Uganda</strong><br />
0 30 60 120 180 240<br />
Kilometres<br />
300<br />
35<br />
NEMA 2006<br />
National Forestry Authority (NFA) 2008
An early morning ride through a cool and refreshing Mabira (natural) forest along the Kampala-Jinja Highway (2008)<br />
Forest resources in <strong>Uganda</strong> comprise <strong>of</strong> both<br />
natural forests and plantations. Natural forests<br />
include tropical high forests and woodlands while<br />
plantations comprise both pines and hardwoods. Forests<br />
and woodlands cover approximately 4.9 million hectares<br />
which is approximately 20% <strong>of</strong> the total country area. Of<br />
these, 924,000 ha are tropical high forests, 3,974,102 ha<br />
are woodlands while 35,066 ha are forest plantations.<br />
Forests in <strong>Uganda</strong> occur as gazetted areas (forest<br />
reserves), other protected areas (national parks) and<br />
as forests on private land. Forests and woodlands are<br />
estimated to have covered about 10,800,000 ha (45%)<br />
<strong>of</strong> <strong>Uganda</strong>’s surface area in around 1890. Since then,<br />
the size <strong>of</strong> the forest estate has drastically shrunk. For<br />
example, at the beginning <strong>of</strong> the 20th century, <strong>Uganda</strong>’s<br />
tropical high forests covered 3,090,000 ha or 12% <strong>of</strong> the<br />
country’s area. Over the years the forests have been<br />
gradually cleared and today estimates indicate reduction<br />
to about 730,000 ha, which is only (3%) <strong>of</strong> <strong>Uganda</strong>’s area.<br />
36<br />
Forests<br />
Since the colonial era in <strong>Uganda</strong>, gazettement <strong>of</strong><br />
forest resources has been undertaken under three<br />
main categories which still form the back borne <strong>of</strong><br />
the current gazettement plans. The aim is to ensure<br />
continuous supply <strong>of</strong> forest goods and services to the<br />
people <strong>of</strong> <strong>Uganda</strong> in perpetuity. The categories therefore<br />
include supply <strong>of</strong> goods especially hardwood timber;<br />
protection <strong>of</strong> water catchments and control <strong>of</strong> erosion;<br />
and increased production <strong>of</strong> forest goods through<br />
establishment <strong>of</strong> forest plantations. Presently, most <strong>of</strong><br />
the forest cover under protection is located on the upper<br />
slopes <strong>of</strong> mountains and highlands. Besides biodiversity<br />
conservation, the forests in these highland areas are<br />
for protection <strong>of</strong> important water catchments and for<br />
erosion control. In other parts <strong>of</strong> the country, forests<br />
were gazetted primarily for biodiversity conservation and<br />
supply <strong>of</strong> timber.<br />
NEMA 2009
Budongo forest at “Mailo kumi”, along the Masindi – Paraa Road<br />
via Kichumbanyobo Gate (2002)<br />
Generally forest resources in <strong>Uganda</strong> <strong>of</strong>fer a wide<br />
range <strong>of</strong> non- timber products and services; they<br />
provide various ecological functions such as watershed<br />
protection, erosion control, wind breaks, climate<br />
amelioration and carbon sequestration. <strong>Uganda</strong>’s forests<br />
are a habitat to a diverse range <strong>of</strong> animal and plant<br />
species that are a potential for eco-tourism attraction.<br />
Some <strong>of</strong> these species are endemic; others are rare<br />
or threatened, while others are important as national<br />
heritage. <strong>Uganda</strong>’s tropical high forests in particular are<br />
one <strong>of</strong> the most diverse ecosystems in the tropical world.<br />
About 20,000 plant species are known to exist. Due to<br />
their diversity in food and habitat, <strong>Uganda</strong>’s forests<br />
are also rich in bird life. For example, over 1,000 bird<br />
species have been listed in the country <strong>of</strong> which 33%<br />
are entirely found in forest areas. Also <strong>Uganda</strong>’s forests<br />
Oliver Van straaten<br />
Katuugo Forest Reserve planted by National Forestry Authority (NFA),<br />
Nakasongola District (2008)<br />
support such rare species as the mountain gorilla (Gorilla<br />
gorrilla berengei), found in Bwindi impenetrable and<br />
Mgahinga forests <strong>of</strong> which only about 600 are known<br />
to exist in the whole world, with this part <strong>of</strong> the world<br />
being their only habitat.<br />
There are numerous threats to forests and consequently,<br />
the rapid shrinkage <strong>of</strong> forest estate and demise <strong>of</strong> the<br />
forest resources in <strong>Uganda</strong>. These include among others:<br />
rapid population growth leading to increased demand<br />
for land, food and energy, and hence rapid clearance <strong>of</strong><br />
forests; unsustainable harvesting <strong>of</strong> the forest products<br />
and the degradation <strong>of</strong> the resource base; encroachment<br />
on gazetted forest reserves by surrounding communities;<br />
and urbanization, and industrial growth which are<br />
particularly putting pressure on peri- urban forests.<br />
37<br />
NEMA 2009
Conservation areas: Protected areas<br />
Figure 12: Protected areas in <strong>Uganda</strong><br />
38<br />
0 35 70 140 210 280<br />
Kilometres<br />
350<br />
Legend<br />
Protected areas<br />
GAZTYPE<br />
Central Forest Reserves<br />
Departmental Joint Management<br />
National Parks<br />
CLASS<br />
Needle Coniferous leaved forest<br />
THF weel well stocked<br />
THF low stocked<br />
Woodland<br />
<strong>Uganda</strong> Wildlife Authority (UWA) 2008
Conservation areas: Wildlife<br />
Gorillas in Bwindi Impenetrable National Park (2008)<br />
<strong>Uganda</strong> is rich in wildlife resources that are located<br />
in both gazettted areas and on private lands.<br />
In addition to forest reserves, <strong>Uganda</strong> has four<br />
types <strong>of</strong> wildlife protected areas namely national parks,<br />
wildlife reserves, wildlife sanctuaries, and community<br />
wildlife areas; classified according to the degree <strong>of</strong><br />
protection accorded. These areas are entirely for<br />
conservation <strong>of</strong> wildlife. There are six forest national<br />
parks namely Mgahinga, Bwindi impenetrable, Kibale,<br />
Semliki, Rwenzori Mountains and Mt. Elgon.<br />
There are also four savannah ecosystem national parks<br />
namely Lake Mburo, Queen Elizabeth, Murchison Falls,<br />
and Kidepo.<br />
Bwindi Impenetrable National Park<br />
The National parks occupy a total area <strong>of</strong> 11,150 km 2<br />
(4% <strong>of</strong> the country’s area). There are also ten wildlife<br />
reserves which occupy 8,760 km 2 (3.6% <strong>of</strong> the country’s<br />
area) <strong>of</strong> the country’s area, and consist primarily <strong>of</strong><br />
grassland with patches <strong>of</strong> dry woodland and scrubland.<br />
In addition, there are seven wildlife sanctuaries and<br />
thirteen community wildlife areas. Overall, protected<br />
<strong>Uganda</strong> Wildlife Authority (UWA) 2008<br />
57%<br />
Area (sq. km)<br />
wildlife areas occupy about 20% <strong>of</strong> the area <strong>of</strong> <strong>Uganda</strong>,<br />
which is quite a significant proportion.<br />
<strong>Uganda</strong> boasts <strong>of</strong> a diversity <strong>of</strong> wildlife both flora and<br />
fauna species; which are mainly due to a diversity <strong>of</strong><br />
landscapes that lead to different ecosystems ranging<br />
from mountain, tropical forests to savannah grasslands.<br />
The conservation areas habour species <strong>of</strong> both national<br />
and global importance.<br />
The main economic benefit from the wildlife estate has<br />
been revenue earnings from tourism. The other benefits<br />
include cultural and scientific. The conservation <strong>of</strong><br />
<strong>Uganda</strong>’s wildlife resources also has benefits <strong>of</strong> global<br />
significance. Sustainable use <strong>of</strong> these conservation areas<br />
faces many challenges such as increased population<br />
pressure leading to competition for land resources,<br />
and conflict between humans and wildlife. Wildlife<br />
conservation in <strong>Uganda</strong> faces a number <strong>of</strong> threats which<br />
include encroachment on the conservation areas for<br />
agriculture and settlements, poaching, destruction <strong>of</strong><br />
wildlife considered to be vermin.<br />
2%<br />
23%<br />
18%<br />
National Parks<br />
Wildlife reserves<br />
Wildlife sanctuaries<br />
Community wildlife areas<br />
Proportional area coverage <strong>of</strong> each <strong>of</strong> the<br />
conservation categories<br />
39
The Delta in Murchison Falls National Park, Amuru District (2008)<br />
he Delta in MFNP<br />
Pelicans in Queen Elizabeth National Park, Kasese District (2008)<br />
40<br />
<strong>Uganda</strong> Wildlife Authority (UWA) 2008<br />
<strong>Uganda</strong> Wildlife Authority (UWA) 2008
An elephant in Queen Elizabeth National Park, Kasese District (2008)<br />
paya Hotspring in Semulki National Park<br />
Climbing lions in Ishasha, Kanungu District Western <strong>Uganda</strong><br />
<strong>Uganda</strong> Wildlife Authority (UWA) 2008<br />
Grey crowned cranes (2008)<br />
41<br />
<strong>Uganda</strong> Wildlife Authority (UWA) 2008<br />
<strong>Uganda</strong> Wildlife Authority (UWA) 2008
Kabwoya Wildlife Reserve<br />
Map <strong>of</strong> Kabwoya Wildlife Reserve and Kaiso-Tonya Community Wildlife Area.<br />
Source: <strong>Uganda</strong> Wildlife Authority 2007.<br />
42<br />
Kabwoya Wildlife Reserve is part <strong>of</strong><br />
the Albertine Graben which is rich in<br />
biological species and oil. The map<br />
(opposite page) shows species richness.<br />
Oil exploration in the Albertine Graben<br />
<strong>Uganda</strong> Wildlife Authority (UWA) 2007<br />
PEPD 2008
Species Richness in the Albertine Graben<br />
International boundary<br />
Counties<br />
Very low<br />
Low<br />
Medium<br />
High<br />
Very high<br />
43
Figure 13: The major soils <strong>of</strong> <strong>Uganda</strong><br />
General Status<br />
Apart from the volcanic soils in the East and South West,<br />
most soils in <strong>Uganda</strong> are older than 500 million years and<br />
are in their final stage <strong>of</strong> weathering with little mineral<br />
reserves remaining. The predominant minerals in the<br />
soils are quartz and kaolinite that do not directly supply<br />
nutrients to soils.<br />
The soils are acidic and <strong>of</strong> low fertility with low Cation<br />
Exchange Capacity (CEC). Nutrients such as phosphorus<br />
occur in inorganic and organic forms that are not readily<br />
44<br />
Soils: General status<br />
Soils<br />
Acric Ferralsols<br />
Arenosols<br />
Calcisols<br />
Dystric Regosols<br />
Eutric Regosols<br />
Gleysols<br />
Histosols<br />
Leptic/Skeletic Andosols<br />
Leptosols<br />
Lixic Ferralsols<br />
Lumsols<br />
Melanic Andosols<br />
Nitisols<br />
Petric Plinthosols<br />
Planosols<br />
Vertisols<br />
40 0 40 80 120<br />
Kilometres<br />
available to crops. Phosphorus is fixed by oxides <strong>of</strong> iron<br />
and aluminum. Nitrogen that is low in most mineral<br />
soils can only be naturally supplied to the soil from the<br />
atmosphere by symbiotic biological fixation and slowly<br />
from organic matter. Potassium, another essential<br />
element, is also limiting in these soils because there are<br />
no primary minerals that can supply it. Also, due to the<br />
low CEC, inorganic cations are easily leached out <strong>of</strong> the<br />
root-zone <strong>of</strong> most crops.<br />
National Agricultural Research Laboratories 2008
Soils: Changes . Classification and Nomenclature<br />
Soils Types<br />
Soil Type Sub Type Area (Km 2 )<br />
Andosols Leptic/Skeletic 5,751<br />
Table 4: Soil Types and Productivity status in <strong>Uganda</strong><br />
Changes<br />
Melanic 63<br />
Arenosols 5,579<br />
Calcisols 204<br />
Ferralsols Acric 43,180<br />
Lixic 24,392<br />
Gleysols 24,019<br />
Histosols 580<br />
Leptosols 22,086<br />
Luvisols 5,275<br />
Nitisols 3,907<br />
Planosols 1,735<br />
Plinthosols Petric 35,205<br />
Regosols Dystric 5,072<br />
Eutric 8,085<br />
Vertisols 19,066<br />
Over the years, food production has been characterized<br />
by subsistence farming. A subsistence production<br />
system usually focuses on maximizing short term pr<strong>of</strong>it<br />
which promotes consuming and depleting natural stocks<br />
<strong>of</strong> plant nutrients. Such a farming system has resulted<br />
in soil fertility degradation through nutrient mining.<br />
In the past, when <strong>Uganda</strong>’s population was still low,<br />
lost soil fertility was restored through long periods <strong>of</strong><br />
fallows. With an average land holding <strong>of</strong> about 2 ha<br />
per household today, fallows are no longer practical.<br />
Research has demonstrated that fertilizer inputs and<br />
appropriate land management practices are important<br />
components <strong>of</strong> technology required to maintain or<br />
improve soil fertility in <strong>Uganda</strong> (P. Ndeki et al).<br />
Severe soil erosion on Mt. Elgon slopes in Kapchorwa District, resulting from<br />
loss <strong>of</strong> vegetation cover and leading to heavy siltation <strong>of</strong> River Ngenge (2005)<br />
Classification and Nomenclature<br />
The major criteria in soil classification are the physical<br />
and chemical characteristics. Physical characteristics<br />
include factors such as parent rock, texture, structure,<br />
location, depth, colour, and topography, while chemical<br />
characteristics include pH, base composition, base<br />
saturation, and Cation Exchange Capacity (CEC). Going by<br />
those criteria, 13 major classes (some with sub classes)<br />
have been identified at national level (see Table 4).<br />
The earlier nomenclature <strong>of</strong> soils in <strong>Uganda</strong> was based on<br />
the catena system, in which units were assigned names <strong>of</strong><br />
the most prominent town or centre in the area. This <strong>Atlas</strong><br />
however uses reclassified soils based on the standard FAO<br />
nomenclature.<br />
The high productivity soils cover only 8% <strong>of</strong> the area <strong>of</strong><br />
<strong>Uganda</strong>. This is indeed a small area. Therefore, moderate<br />
and fair productivity categories form the bulk <strong>of</strong> the<br />
soils and must be effectively managed in order to sustain<br />
<strong>Uganda</strong>’s agriculture. Furthermore, through intensive<br />
but sustainable agricultural practices, yields on low<br />
productivity soils can be enhanced.<br />
45<br />
NEMA 2005
Soils: Agro-Ecological Zones<br />
Agro-Ecological Zones<br />
Figure 14: Agro-ecological zones <strong>of</strong> <strong>Uganda</strong><br />
Agro-Ecological Zones<br />
Agro-ecological Zoning (AEZ) refers to the division <strong>of</strong> an area <strong>of</strong> land into smaller units which have similar<br />
characteristics related to land suitability, potential production and environmental sensitivity (see Figures 15a and 15b).<br />
An Agro-ecological Zone is a land resource mapping unit, defined in terms <strong>of</strong> climate, landform and soils, and/or land<br />
cover, and having a specific range <strong>of</strong> potentials and constraints for land use. The priority given to each <strong>of</strong> these factors<br />
may vary from region to region. The country has been delineated into 14 Agro-Ecological Zones (Wortman and Eledu<br />
(1999).<br />
46<br />
National Agricultural Research Laboratories 2008
Agro-Ecological Rainfall Minimum Altitude Dominant Soils Farming system Photograph<br />
Zone (mm) Temp 0 C (M)<br />
1 West Nile Farmlands 900-1500 10 800-1800 Acric Ferralsols (696) Annual crops<br />
Leptosols (2470) and cattle<br />
Petric Plinthosols (1157)<br />
2 Northwestern 700-1700 10 500-1500 Acric Ferralsols (3043) Annual crops<br />
Farmlands-Wooded Arenosols (2260) and cattle<br />
Savannah Calcisols (116)<br />
Gleysols (51)<br />
Leptosols (11238)<br />
Lixic Ferralsols (1588)<br />
Petric Plinthosols (567)<br />
Vertisols (1560)<br />
3 Northern Moist 700-1700 15 1000-1200 Acric Ferralsols (5580) Annual crops<br />
Farmlands Arenosols (285) and cattle<br />
Eutric Regosols (961)<br />
Gleysols (3113)<br />
Leptosols (1614)<br />
Lixic Ferralsols (982)<br />
Petric Plinthosols (10689)<br />
Vertisols (2718)<br />
4 Northeastern-Central 700-1500 15 900-2500 Arenosols (1120) Annual crops<br />
Grass-Bush-Farmlands Eutric Regosols (4023) and cattle<br />
Gleysols (1217)<br />
Leptosols (3971)<br />
Lixic Ferralsols (2577)<br />
Petric Plinthosols (3883)<br />
Vertisols (2058)<br />
5 Northeastern 300-1300 12 900-3000 Acric Ferralsols (424) Mainly pastoral<br />
Semi-arid Short Arenosols (127) with a few<br />
Grass Plain Eutric Regosols (2,661) annual crops<br />
Gleysols (3,409)<br />
Leptosols (2,721)<br />
Lixic Ferralsols (5,354)<br />
Luvisols (1,481)<br />
Nitisols (283)<br />
Petric Plinthosols (1,028)<br />
Vertisols (12,001)<br />
6 Western Mid-Altitude 500-1700 10 700-1600 Acric Ferralsols (10706) Banana, millet,<br />
Farmlands and Arenosols (50) cotton, c<strong>of</strong>fee,<br />
Semliki Flats Calcisols (89) and cattle<br />
Dystric Regosols (1369)<br />
Gleysols (1907)<br />
Leptic/Skeletic<br />
Andosols (1167)<br />
Leptosols (178)<br />
Lixic Ferralsols (181)<br />
Luvisols (771)<br />
Petric Plinthosols (978)<br />
Vertisols (595)<br />
7 Central Wooded 700-1300 15 900-1300 Acric Ferralsols (1591) Banana, millet,<br />
Savannah Arenosols (375) cotton, c<strong>of</strong>fee,<br />
Gleysols (3398) and cattle<br />
Leptosols (6)<br />
Petric Plinthosols (5751)<br />
Figure 15a: Table showing Agro-ecological zones <strong>of</strong> <strong>Uganda</strong> (continued to next page)<br />
47
48<br />
Agro-Ecological Rainfall Minimum Altitude Dominant Soils Farming system Photograph<br />
Zone (mm) Temp 0 C (M)<br />
8 Southern and Eastern 700-1700 15 900-1300 Acric Ferralsols (1364) Banana, millet, cotton,<br />
Lake Kyoga Basin Arenosols (27) cattle, and a few<br />
Gleysols (3972) annual crops<br />
Leptosols (1)<br />
Lixic Ferralsols (71)<br />
Petric Plinthosols (7895)<br />
Vertisols (42)<br />
9 Mount Elgon 900 – over 7.5 1000-4000 Acric Ferralsols (62) Intensive banana and<br />
Farmlands 2100 Gleysols (81) c<strong>of</strong>fee, forest(higher<br />
Lixic Ferralsols (461) altitudes), and a<br />
Luvisols (52) few annual crops<br />
Nitisols (1846)<br />
Petric Plinthosols (189)<br />
Vertisols (28)<br />
10 Western Medium- 500 - >2100 7.5 600-4500 Acric Ferralsols (840) Banana, c<strong>of</strong>fee,<br />
High Farmlands Dystric Regosols (81) cattle, and forest<br />
Histosols (93) (higher altitudes)<br />
Leptic/Skeletic<br />
Andosols (975)<br />
Lixic Ferralsols (43)<br />
Luvisols (701)<br />
Melanic Andosols (62)<br />
11 Southwestern Grass 300-1100 10 1100-2000 Acric Ferralsols (8365) Banana, c<strong>of</strong>fee, cattle,<br />
- Farmlands Dystric Regosols (2553) and some annual crops<br />
Eutric Regosols (436)<br />
Gleysols (2484)<br />
Leptosols (522)<br />
Lixic Ferralsols (4027)<br />
Planosols (32)<br />
12 Lake Victoria 700 - >2100 12.5 1100-2400 Acric Ferralsols (5554) Banana, c<strong>of</strong>fee, millet,<br />
Crescent & Arenosols (129) cotton, and annual crops<br />
Mbale Farmlands Gleysols (3869)<br />
Leptosols (230)<br />
Lixic Ferralsols (6452)<br />
Luvisols (59)<br />
Nitisols (1776)<br />
Petric Plinthosols (2561)<br />
Planosols (797)<br />
Vertisols (5)<br />
13 Ssese Islands 700 - >2100 15 1100-1300 Acric Ferralsols (47) Intensive banana, c<strong>of</strong>fee,<br />
Sango Plains Arenosols (237) and annual crops<br />
Gleysols (55)<br />
Leptosols (47)<br />
Lixic Ferralsols (346)<br />
Petric Plinthosols (476)<br />
Planosols (1003)<br />
14 Southwestern 700-2100 7.5 1100-4000 Acric Ferralsols (840) Annual crops<br />
Highlands Dystric Regosols (81) and Forest<br />
Histosols (93)<br />
Leptic/Skeletic<br />
Andosols (975)<br />
Lixic Ferralsols (43)<br />
Luvisols (701)<br />
Melanic Andosols (62)<br />
Lake 700 - >2100 17.5 1100 - - -<br />
Figure 15a: Table showing Agro-ecological zones in <strong>Uganda</strong> (continued from previous page)
Oil potential in the Albertine Graben<br />
Oil prospecting sites in Lake Albert (2008). The maps also show the sensitivity <strong>of</strong> the shoreline.<br />
49
Energy: Hydro electric power<br />
Above: Kampala at night<br />
Below: Owen Falls Hydro Electric Power dam at Jinja: Construction was completed in 1954.<br />
The dam is the source <strong>of</strong> hydro electric power for <strong>Uganda</strong> and neighbouring Kenya.<br />
50<br />
NEMA (2009)<br />
<strong>Uganda</strong> Museum (2009)
Kampala by night<br />
Energy: Upcoming Hydro power plants<br />
Bujagali Falls in Jinja District (2002): Construction <strong>of</strong> a second hydro electric plant, the Bujagali Hydropower Project is underway at the falls.<br />
Karuma falls in Masindi District (2007), site for a proposed new hydro electric power plant<br />
NEMA 2009<br />
51<br />
NEMA 2002<br />
NEMA 2008
Energy: different sources <strong>of</strong> energy<br />
Selling charcoal by the Nebbi-Arua highway (2008). There has been rampant<br />
depletion <strong>of</strong> tree cover in Arua District that borders the Sudan to the north<br />
and the Democratic Republic <strong>of</strong> Congo (DRC) to the west.<br />
Women participate in the Community Training <strong>of</strong> Trainers programme<br />
by NEMA in Arua District.<br />
52<br />
52<br />
Odipio Edward Adraku 2008<br />
NEMA 2001<br />
Solar power: Phone, battery and lantern charging in rural Wobutungulu by a solar<br />
project implemented by Joint Energy and <strong>Environment</strong> Projects (JEEP), a local NGO.<br />
Firewood is the main source <strong>of</strong> energy for domestic cooking across<br />
the country<br />
NEMA 2009<br />
Children <strong>of</strong> Bombo display fuel saving technologies: saw<br />
dust, charcoal briquettes and a charcoal stove during<br />
celebrations organised by ACEPA to celebrate World<br />
<strong>Environment</strong> Day 2009 in Bombo, Luwero District<br />
JEEP 2009<br />
NEMA 2005
Industry<br />
Hima Cement Factory, Kasese District in Western <strong>Uganda</strong> (2008)<br />
Effects <strong>of</strong> pollution (from cement dust) from Hima Cement factory in the<br />
neighbourhood before NEMA’s interevention (1996)<br />
NEMA 2008<br />
Impact <strong>of</strong> mining<br />
NEMA 1996<br />
Tororo Cement Factory, Tororo District in Eastern <strong>Uganda</strong> (2002)<br />
One year later in the same neighbourhood after Hima’s compliance<br />
to the intervention (1997)<br />
53<br />
NEMA 2002<br />
NEMA 1997
Kasese Cobalt<br />
Trail left by acidic waters from the cobalt stock pile left unprotected in the 1970s and 1980s. This area is currently<br />
under rehabilitation by the Kasese Cobalt Company.<br />
54<br />
Rwenzori Mountain ranges in the vicinity <strong>of</strong> Kasese Cobalt<br />
Kasese Cobalt 2005<br />
Image ©2009 Digital Globe<br />
NEMA 2007<br />
NEMA file photo (2008)
Science and Technology<br />
Makerere University Faculty <strong>of</strong> Computer and Information Technology<br />
NEMA 2008<br />
Telephone and internet subscribers 2003 - 2007<br />
<strong>Uganda</strong>’s new focus on science, technology<br />
and innovation is founded in the Poverty<br />
Eradication Action Plan (PEAP) and the<br />
National Development Plan (NDP) which together<br />
emphasize the need for increased investment in<br />
industrialization, research and development, and<br />
technology transfer for increased productivity and<br />
economic growth.<br />
The ‘Ivory Tower’: Makerere University Main Building, still going strong.<br />
55<br />
NEMA 2009<br />
<strong>Uganda</strong> Communication Commission in the NSOER<br />
2008 in the press
More pictures <strong>of</strong> Game parks /wildlife reserves – One large map with insets <strong>of</strong> photographs showing biodiversity<br />
Above: Kampala, <strong>Uganda</strong>’s capital city (2002). Inset: Kampala at dawn (2009).<br />
Below: River Nile at Owen Falls Dam, Jinja, source <strong>of</strong> Hydro-electric power<br />
<strong>Uganda</strong>’s and second largest town after Kampala (2008)<br />
56<br />
NEMA 2008 John Gibbons: <strong>Uganda</strong> At A Glance 2002
<strong>Uganda</strong>’s <strong>Changing</strong> <strong>Environment</strong><br />
Chapter 2<br />
U g a n d a ’ s C h a n g i n g E n v i r o n m e n t<br />
Part <strong>of</strong> the Northern By-pass under construction (2009)<br />
71<br />
57<br />
NEMA 2009
Kiruhura 1990<br />
58<br />
K I R U<br />
Kiruhura<br />
Increase in<br />
agriculture<br />
Kiruhura District was created in July 2005 by an Act <strong>of</strong> Parliament. The district that<br />
borders with seven districts lies in the cattle corridor in South-Western <strong>Uganda</strong>. The cattle<br />
corridor stretches from the Karamoja region, through Teso, into parts <strong>of</strong> Eastern <strong>Uganda</strong>,<br />
across the Lake Kyoga region, to Nakasongola and further down to Mbarara and Rakai. The<br />
communities <strong>of</strong> Kiruhura were pastoralists living nomadic life and the animals reared were<br />
NEMA file photo (2008)
K I R U<br />
cattle, goats, and sheep. However, over the years conditions have changed, and as land<br />
has become scarce, the people have settled down and taken on cultivation as an additional<br />
activity. Evidence <strong>of</strong> farming can be seen in the 1990’s satellite image and larger farming<br />
areas can be seen in the zoomed image <strong>of</strong> October 2003. The major cash crops are Banana<br />
and c<strong>of</strong>fee. Food crops include maize, millet, beans, potatoes and ground nuts.<br />
Mixed farming and permanent homesteads in Kiruhura<br />
59<br />
NEMA 2008
Karamoja<br />
60<br />
Karamoja<br />
Increase in<br />
agriculture<br />
Karamoja region comprises <strong>of</strong> the districts <strong>of</strong> Kaabong, Kotido, Moroto, Nakapiripirit<br />
and Abim. These form part <strong>of</strong> the cattle corridor and the farming systems are agropastrolism<br />
and the cereal-cotton-cattle farming systems. The satellite images <strong>of</strong><br />
September 1984 and August 2002 which is a harvest season show increase in areas
Karamoja 1986 .<br />
under agriculture. The main crops grown are cereals especially sorghum,<br />
cotton, cassava, maize, simsim, sunflower and groundnuts. Although there<br />
is an increase in agriculture frequent droughts have made these areas to<br />
be food insecure.<br />
61
62<br />
Kibimba<br />
Rice Scheme<br />
Ten years ago, <strong>Uganda</strong> was hardly known among rice producing countries, but recent<br />
successes in rice production have earned the country a respectable place among<br />
rice producers that it could quickly turn into the regional supplier <strong>of</strong> rice. <strong>Uganda</strong>’s<br />
total area under rice cultivation is now 300 per cent <strong>of</strong> what it was a decade ago.<br />
The area has increased from less than 60,000 hectares and is now about 180,000<br />
hectares, indicating a high rate uptake in rice production. As <strong>Uganda</strong> positions itself<br />
to be among the leading rice producers in the region, the general feeling among rice
producers is that the government must sustain the current level <strong>of</strong> support<br />
because the industry is not yet fully consolidated. With the continued<br />
support <strong>of</strong> the Agricultural Ministry and our government, <strong>Uganda</strong> will be<br />
able to also supply neighbouring countries, generating valuable foreign<br />
exchange and leading to greater food security for the East African region.<br />
The satellite images <strong>of</strong> 1973 and 1984 show Kibimba Rice Scheme in Bugiri<br />
District. The scheme was non-existent in 1973.<br />
Rice Harvester<br />
63
Mabira 2001<br />
Mabira forest 2001<br />
64<br />
Mabira<br />
Recovery <strong>of</strong><br />
forest<br />
Mabira forest was heavily encroached upon in the 1970s and early 1980s. In the 1990s,<br />
encroachers were evicted and the forest is now on the road to recovery.<br />
Note: Enclaves inside Mabira forests are not part <strong>of</strong> the reserve but public land.<br />
The 1974 image shows a dense forest with a few pockets <strong>of</strong> possible clearing. The<br />
ra
Mabira forest 2006<br />
Mabira 2006<br />
.<br />
Mabira forest 1986<br />
2001 image shows that a large part on the eastern side had been cleared<br />
and was recovering. Five years later in 2006, the image shows evidence <strong>of</strong><br />
a dense forest on its way to recovery.<br />
Mabira forest<br />
65
Part <strong>of</strong> the Mabira Tropical High Forest<br />
The Mabira forest reserve, on the shores <strong>of</strong> Lake Victoria<br />
hosts valuable wildlife, serves as a timber resource,<br />
provides ecosystem services for water balance, and the<br />
rainforest represents a tourist destination. Following<br />
a proposed plan for clearing a third <strong>of</strong> the reserve<br />
66<br />
for agricultural use, the values <strong>of</strong> the forest were<br />
calculated by local researchers (yakobo Moyini, 2008).<br />
This economic evaluation <strong>of</strong> the forest shows that from<br />
a short-term perspective, growing sugarcane would lead<br />
to more economic benefits than maintaining the forest
eserve, with a return <strong>of</strong> 3.6 million USD/year in contrast<br />
to 1.1 million USD/year for conservation. However, sugar<br />
cane production is only optimal during a short time span<br />
<strong>of</strong> five years. When comparing both land use alternatives<br />
over the lifetime <strong>of</strong> the timber stock <strong>of</strong> 60 years, the<br />
benefits from the forest, and the ecosystem services it<br />
provides, exceed those <strong>of</strong> sugarcane planting.<br />
67
Katuugo Forest 1990, Nakasongola District<br />
68<br />
Nakasongola<br />
Loss <strong>of</strong><br />
woodlands due to<br />
charcoal burning<br />
Desertification is a silent grabber <strong>of</strong> land. The existence <strong>of</strong> bare ground in Nakasongola<br />
District is a sign <strong>of</strong> serious land degradation. The areas worstaffected have become<br />
less productive and residents <strong>of</strong> Nakasongola attribute it to termites that forage on the<br />
vegetation (Stephen Muwaya, 2008). However, termites have devastated Nakasongola<br />
because the organic matter which they feed on has been destroyed (Swidiq Mugerwa,
Katuugo Forest 2007, Nakasongola District<br />
2008). Human activities such as overstocking, charcoal burning and bush burning<br />
are some <strong>of</strong> the contributors to this problem (Mpairwe, 2007). As a management<br />
tool, bush burning should only be done once in four years. Better land management<br />
practices, control <strong>of</strong> stock and enforcement <strong>of</strong> bye-laws would improve the situation.<br />
Bare ground and drought resistant thorny trees in Nakasongola NEMA 2008<br />
69
70<br />
Budongo<br />
Forest<br />
Reserve<br />
Decreased<br />
Fire fronts<br />
and increased<br />
vegetation<br />
I<br />
A study in the Budongo forest –Murchison falls National Park landscape shows that<br />
there has been both woody cover decrease and increase. In areas where there has<br />
been continuous burning, woody cover species have changed from those that are<br />
less resistant to fire to those that are more resistant. Signs <strong>of</strong> fire are evident in<br />
such landscapes (see pictures on next pages). In areas where there has been a higher<br />
control <strong>of</strong> burning, increase in woody cover has been observed.
I<br />
Large tree greater than 30cm<br />
dbh that had been destroyed<br />
by the recurrent fires on the<br />
southern bank <strong>of</strong> Murchison<br />
Falls National Park near<br />
Wairingo ranger post.<br />
For northern Budongo, increase in policing <strong>of</strong> the forest area and the presence <strong>of</strong><br />
the park entry gate at the southern end <strong>of</strong> the only through road has resulted in<br />
observable decrease in burning. The burning was mainly carried out by the local<br />
communities bordering the forest. Fire scars were evident on the 1973 image <strong>of</strong><br />
northern Budongo. There are no fire scars on the one <strong>of</strong> 2008 due to recovery.<br />
71
72<br />
Budongo fire fronts 2002<br />
Budongo<br />
Forest<br />
Reserve<br />
Decreased<br />
Fire fronts<br />
and increased<br />
vegetation<br />
Budongo fire fronts 1985<br />
Dr. Grace Nangendo (2008)<br />
Budongo fire fronts 1995<br />
Budongo fire fronts 2002<br />
The figures show Landsat satellite<br />
images taken in 1985, 1995 and 2002.<br />
All three images were taken in February<br />
<strong>of</strong> the respective years. Active fires with<br />
fire fronts are visible in the rift valley<br />
area and close to the escarpment.<br />
Fire scars are evident between main<br />
Budongo and Kaniyo Pabidi forested<br />
areas in 1985, but in 2002 there is less<br />
fire and more regrowth between the<br />
two forested areas. The regrowth is<br />
also evidenced in the photographic<br />
comparison shown on the opposite page.
Large trees greater than 30cm dbh that had been destroyed by the recurrent fires on the southern bank <strong>of</strong> Murchison Falls National Park near Wairingo ranger post.<br />
A campsite <strong>of</strong> a research team that was located at “Mailo kumi”, along the<br />
Masindi – Paraa Road via Kichumbanyobo gate, in 1974. Photograph was taken<br />
by Pr<strong>of</strong>essor Van Straaten who was then carrying out his PhD research.<br />
Pr<strong>of</strong>essor Van Straaten<br />
Photograph <strong>of</strong> the same location taken by Oliver Van straaten<br />
(son <strong>of</strong> Pr<strong>of</strong>. Van Straaten) 2002.<br />
73<br />
Oliver Van straaten
74<br />
Katuugo<br />
Forest<br />
Reserve<br />
Loss <strong>of</strong><br />
vegetation cover<br />
u g o<br />
u g o<br />
Since the 1940’s the <strong>Uganda</strong>n Government has promoted a policy <strong>of</strong> planting forests<br />
on gazetted land to supply cheap s<strong>of</strong>twoods for the country’s growing domestic<br />
demand. <strong>Uganda</strong>’s overall population growth rate <strong>of</strong> 2.6% and urban growth rate<br />
<strong>of</strong> 5.4% puts enormous pressure on these forests (Ministry <strong>of</strong> Finance, 2000). This<br />
pressure is likely to worsen because 6% <strong>of</strong> forest on private land and 6.1% <strong>of</strong> forest
u g o<br />
in protected areas has been lost since 1990 (NEMA, 2008).<br />
Katuugo, Mafuga and Mwenge Forest reserves are fplanted on gazetted<br />
land to supply cheap s<strong>of</strong>twoods for the country’s growing domestic wood<br />
demand. Mafuga in Kabale District covers an area <strong>of</strong> 3,699 ha and was<br />
gazetted in 1946.<br />
Katuugo Forest Reserve<br />
75<br />
NEMA 2008
76<br />
Mwenge -<br />
Mafuga<br />
Forest<br />
Reserves<br />
Lack <strong>of</strong> willingness<br />
to replant<br />
The main trees planted were Pine, Eucalyptus and other non-conifers in fire lines<br />
(Gombya, 2004). Katuugo in Nakasongola District was gazetted in 1963 and covers<br />
an area <strong>of</strong> 3,318 ha while Mwenge in Kabarole covers an area <strong>of</strong> 6,278 ha and was<br />
gazetted in 1948. The annual harvesting rate from these three reserves was 16.2 ha
and replanting was 0.3 ha because the concessionaires<br />
were not willing to replant. This means the level<br />
<strong>of</strong> management <strong>of</strong> these planted forest reserves is<br />
unsustainable (Gombya,2004).<br />
Pine trees<br />
Mwenge (top) Mafuga (bottom)<br />
Forest Reserves<br />
77
Rhino camp 1975<br />
78<br />
Pader Refugee<br />
camps<br />
Impact <strong>of</strong><br />
the war and<br />
concentration<br />
camps;<br />
vegetation loss<br />
From the Landsat color composite <strong>of</strong> 1990, most <strong>of</strong> the land in Pader District was<br />
under cultivation. However during the war all people moved into Internall Displaced<br />
People’s camps as seen on the Landsat TM image <strong>of</strong> 1995. The areas that used to be<br />
under agriculture regenerated into bush but there was more vegetation loss around
Rhino camp 2000<br />
Bush burning is very rampant in the month <strong>of</strong> January as evidenced in<br />
the satellite images <strong>of</strong> 1995 and 2009. If this is not regulated, it will<br />
result in land degradation and low productivity <strong>of</strong> soils.<br />
79
80<br />
Kooki Hills<br />
Area<br />
Degraded hills<br />
The Kooki Hills in Kooki County, Rakai District are part <strong>of</strong> the south-western<br />
highlands, although not as conspicuous. Their summits range from smooth rounded<br />
to flattish surfaces, with moderate to long steep flanking slopes, fluted by minor<br />
valleys and short pediments on the lower ends. In some cases hills occur singularly,<br />
while in other cases they occur as ridges (for example in Kibanda sub-county), with<br />
slope lengths <strong>of</strong> about 0.5 to 1.0km. Kooki hills are underlain by Karagwe-Ankolean
phyllite, mudstone and shale rock systems. The Karagwe-Ankolean phyllites<br />
cover a wide stretch (ridges, and represent the climax <strong>of</strong> the Kooki hills,<br />
presumably due to being more resistant than shale and mudstone. The<br />
climax is representative <strong>of</strong> Katabaluka and Katiarizo hills in Kibanda, which<br />
rise to 1,542 m and 1,540 m above sea level, respectively. These bare hills<br />
as seen in the image <strong>of</strong> 1984 are constantly burnt in the dry seasons.<br />
Bare hills in Kagamba sub county, Rakai District<br />
81
Kooki hills in Kibaale-Bukoora, Rakai District<br />
The degraded hills <strong>of</strong> Kooki in Rakai District<br />
The most common morphology <strong>of</strong> the hills comprise <strong>of</strong><br />
round to flat summits that abruptly descend on steep<br />
convex and straight slopes, ending in relatively gentle and<br />
moderately concave pediments. The pediment slopes show<br />
an abrupt steepening in their lower sections adjacent to<br />
valley floors which are <strong>of</strong>ten swampy.<br />
Gemorphologically, Kooki hills are thought to result<br />
from an upwarped Buganda plateau during early<br />
Tertiary, after a long quiescence from the Karoo era<br />
and subsequent reduction <strong>of</strong> the plateau landscape by<br />
denudation process to a very low relief, the African<br />
Surface in this Buganda part <strong>of</strong> <strong>Uganda</strong> which, therefore,<br />
is sometimes called Buganda surface. The uplift resulted in<br />
an elevated and dissected plateau consisting <strong>of</strong> a series <strong>of</strong><br />
flat-topped hills or their remnants and intervening valleys.<br />
Thus, the landscape was dissected by the rejuvenated<br />
drainage system, leading to a dissected plateau in form <strong>of</strong><br />
the present ridges and hills. In some cases, the Kooki hills<br />
are related to the Kigezi-Ankole surfaces (highlands), but<br />
generally, Rakai hills are regarded as an upwarping <strong>of</strong> the<br />
Buganda surface.<br />
82<br />
The soils in the Kooki area are dominantly <strong>of</strong> Ferralsols<br />
type and its associations. This is the most dominant<br />
soil type in <strong>Uganda</strong>, covering about 2/3 <strong>of</strong> the country.<br />
This is a class <strong>of</strong> soils considered to be the oldest on<br />
earth; the soils are characterized by low fertility levels<br />
and are deeply weathered and leached with little<br />
mineral reserves remaining. Generally, soil distribution<br />
varies with slope morphology, in that at the summits,<br />
moderately deep to shallow soils <strong>of</strong>ten occur; but on<br />
the steep convex and straight slopes, soils become very<br />
thin with depths varying from bare rocky or weathered<br />
regolith surfaces to only a few centimeters deep. Further<br />
down on the concave and pediment slopes, respectively,<br />
soil depths increase appreciably <strong>of</strong>ten reaching depths <strong>of</strong><br />
over 150 cm.<br />
On the hill summits and steep upper and middle slopes,<br />
the soils are Plinthic Ferralsols and Hyperskeletic<br />
Leptosols. These associations are dominantly shallow,<br />
loose and skeleteral, with high proneness to erosion.<br />
Most <strong>of</strong> the former summit laterite capping has been<br />
removed leaving behind disintegrating boulders and relics<br />
Rakai District Local Administration (2007)
Kooki hills in Kacheera sub county, Rakai District<br />
<strong>of</strong> deeply weathered regolith, on mudstones and shale<br />
rocks. Ferralic Acrisols (well drained) occur on the upland<br />
pediment slopes and support moderate crop production,<br />
while at the footslopes and valley bottoms, halpic luvisols<br />
are a common feature. In the valley bottoms and river<br />
valleys, a variation <strong>of</strong> deposition related soils occur, both<br />
arenosols and luvisols (for example, Ferralic arenosols,<br />
Halpic arenosols, Halpic gleysols and Arenic gleysols).<br />
Most <strong>of</strong> these soils are <strong>of</strong> medium productivity and tend<br />
to be <strong>of</strong> higher moisture content during the dry season.<br />
Kooki hills are located in the relatively dry zone <strong>of</strong><br />
<strong>Uganda</strong> (the cattle corridor) with climatic conditions<br />
classified as dry sub-humid to semi-arid. Rainfall<br />
records at Kibanda indicate that the area receives about<br />
880 mm annually (Climatology Statistics for East Africa<br />
Part II - <strong>Uganda</strong>; East Africa Meteorological Department,<br />
Nairobi 1975). Occasionally, the area experiences periods<br />
<strong>of</strong> prolonged droughts which sometimes lead to severe<br />
moisture deficit. During this dry season, extensive and<br />
uncontrolled bush burning, a traditional practice mainly<br />
used as a means <strong>of</strong> land clearing for agriculture and for<br />
rejuvenation <strong>of</strong> young and tender grasses for livestock<br />
grazing.<br />
Rakai has over 20,000 head <strong>of</strong> cattle. During the periods<br />
<strong>of</strong> drought and pasture and water deficits, about 70,000<br />
more heads <strong>of</strong> cattle come from other areas in search <strong>of</strong><br />
pasture and water leading to a swelling cattle population<br />
<strong>of</strong> over 90,000 which, in turn, put tremendous pressure on<br />
land, exacerbating the problem <strong>of</strong> overgrazing.<br />
A combination <strong>of</strong> low soil fertility and poor structure,<br />
steep slopes, low available plant moisture, as well as<br />
poor grazing and crop growing practices, is thought to<br />
be the main cause <strong>of</strong> extensive occurrence <strong>of</strong> patches <strong>of</strong><br />
bare ground on the Kooki hills. The rate <strong>of</strong> expansion <strong>of</strong><br />
these bare patches is reported to have recently increased<br />
dramatically, which indicates rapid environmental change<br />
in the area. Consequences <strong>of</strong> this process are far reaching,<br />
especially with regard to reduction <strong>of</strong> grazing land,<br />
increased run<strong>of</strong>f and erosion and, increased sedimentation<br />
problems in the valleys below and in water systems.<br />
With increased degradation to bare ground in upland<br />
areas, people are turning to the valley bottoms and dry<br />
plains, wetlands, river banks, and fragile ecosystems for<br />
both crop cultivation and grazing, leading to yet new<br />
threats <strong>of</strong> degradation and environmental change.<br />
83<br />
Rakai District Local Administration (2007)
Rainy season: Kooki hills in the background overlooking Lake Kijanebarola, Rakai District (NEMA 2008)<br />
Origin <strong>of</strong> Lake Kijanebarola and River Rwizi-Kibare-Bukora system<br />
During the formation <strong>of</strong> the Western Rift valley system,<br />
landscape was tilted eastwards which led to rivers and<br />
streams being reversed to flow through new routes<br />
on a down warped landscape and drowned valleys.<br />
Consequently, a fairly long river system <strong>of</strong> Rwizi-Kibare-<br />
Bukora developed. The system originates from its<br />
uppermost catchment in the south-western highlands <strong>of</strong><br />
Itojo, Rwampara, and Buhweju in Ntungamo, Mbarara and<br />
Bushenyi districts, respectively. Due to the down warping<br />
effects, depressions were formed along its course, which<br />
were filled with water both from the river flow and from<br />
micro-catchments to form lakes Kacheera, Mburo and<br />
Kijanebarola. On its long course from the highlands to<br />
Lake Victoria, the river flows out <strong>of</strong> lakes, Kacheera and<br />
Mburo, through Kanagisa wetlands - a poorly defined<br />
valley system with numerous shallow depressions choked<br />
by wetlands; and then into Kijanebalola, a rather streak<br />
valley that was filled by water from the river and flanking<br />
cathments to form the lake. From Lake Kejanebarola, the<br />
system changes into Kibare-Bukora Rivers, which drain<br />
the Kooki hills through the Sango Bay plains, and then into<br />
Lake Victoria via the western shores.<br />
The Lake Kijanebalola feature is itself a recent formation,<br />
which is a result <strong>of</strong> drowning <strong>of</strong> part <strong>of</strong> Rwizi-Kibare river<br />
course. It is a very shallow lake with an average depth <strong>of</strong><br />
84<br />
5 m; and occupies a wide and streak valley, covering a<br />
surface area <strong>of</strong> 35 km 2 and with a circumference <strong>of</strong> about<br />
88 km. The name <strong>of</strong> the lake itself implies that it was<br />
formed when people were there seeing. Although the age<br />
<strong>of</strong> the lake is not readily known, it is a recent formation<br />
and could be traced and estimated through both scientific<br />
and folklore means.<br />
The water catchments <strong>of</strong> the rivers and lakes are<br />
experiencing heavy population pressures, which become<br />
the key driver <strong>of</strong> environmental change in the area. Due<br />
to population pressure, land degradation has increased<br />
to unprecedented magnitudes, especially through loss <strong>of</strong><br />
vegetation cover and soil erosion. This is thought to have<br />
reduced the hydrological potential <strong>of</strong> the catchments and<br />
consequently the volumes <strong>of</strong> water flowing through the<br />
river to the lakes. In addition, heavy silting <strong>of</strong> the river<br />
valleys and the lakes has the effect <strong>of</strong> reduced the water<br />
holding capacity <strong>of</strong> these water systems; and worse still,<br />
the shallow nature <strong>of</strong> the lakes and the high potential<br />
evaporation rates in the area may augment the problem.<br />
<strong>Environment</strong>al change<br />
Of recent both the river system and the lakes through<br />
which it drains have experienced heavy silting and<br />
this has affected the water quality to the extent that<br />
Rakai District Local Administration (2007)
Execution <strong>of</strong> the Kibale-Bukora eco-system Restoration plan 2007, Rakai District.<br />
it requires heavy investment to make it suitable for<br />
domestic use. As such, the lake water is mainly used for<br />
livestock while the population prefer water from rivers,<br />
wetlands, shallow wells and bore holes, but these are not<br />
adequately available, leading to water shortage problems.<br />
Recent trends indicate continued shrinkage <strong>of</strong> the size<br />
<strong>of</strong> the lake, and numerous islands formerly non-existent<br />
are emerging, attributed to silting and reduction in the<br />
lake level. It is predicted that if this trend continues<br />
unchecked, and due to the eminent threats <strong>of</strong> climate<br />
change, the river flow may be demised and lakes dried,<br />
leading to a water crisis.<br />
A further and new dimension <strong>of</strong> environmental change<br />
is being experienced in the river valley and Lake<br />
Kijanebarola. Due to land degradation and productivity<br />
decline on land flanking the river, people have turned<br />
to the river banks and dry river beds, encroached on<br />
them and reclaimed them for crop cultivation, taking<br />
advantage <strong>of</strong> the relatively still fertile soils due to silt<br />
eroded from the hills and deposited in these valleys. The<br />
magnitude <strong>of</strong> the problem became so high that, in 2001<br />
government embarked on the development <strong>of</strong> a strategy<br />
and action plan to restore the degraded wetlands, river<br />
banks and lake shores in the area, by removing farmers<br />
and facilitating recovery <strong>of</strong> both vegetation and water<br />
eco-systems in these fragile areas. Execution <strong>of</strong> the action<br />
plan was undertaken in 2007, and within a period <strong>of</strong> just<br />
one year, impressive recovery has been realised especially<br />
with respect to aquatic vegetation and water levels which<br />
have improved significantly.<br />
Many people who have been to and still live on the shores<br />
<strong>of</strong> Lake Kijanebarola complain that the water causes<br />
their bodies to itch, when they bath it. The lake waters<br />
have developed a blue-greenish weed in powder form<br />
that is drawn in water from the lake for domestic use.<br />
The presence <strong>of</strong> this weed encourages accumulation <strong>of</strong><br />
bacterial communities, which in turn leads to depletion<br />
<strong>of</strong> oxygen in the water body. This may be what underlies<br />
the local belief that Lake Kijanebarola has no fish and its<br />
water causes itching to the body when used for bathing.<br />
The situation is made worse by the high rate <strong>of</strong> fungal<br />
infection in the district and the entire region. Unguided<br />
cultivation, reclamation <strong>of</strong> wetlands, river banks and lake<br />
shores, bush burning has resulted into the bare hills <strong>of</strong><br />
Kooki and “eutrophication” <strong>of</strong> lakes, and the attendant<br />
effects on human well-being.<br />
To the local communities, the blame is being directed to<br />
those people in positions <strong>of</strong> responsibility who have not<br />
made any serious efforts to halt these trends.<br />
85<br />
NEMA 2008
86<br />
Mt. Elgon<br />
National Park<br />
Conservation<br />
issues<br />
Budongo Forest 1974<br />
Mount Elgon has been controlled by the Forest Department since 1929. It became Mount<br />
Elgon Crown Forest in 1940, and a Forest Reserve in 1951. The main objective <strong>of</strong> the<br />
working plan for 1968-1978 (Synott, 1968) was to protect the forest, with secondary<br />
objectives <strong>of</strong> extraction <strong>of</strong> timber. Since the restoration <strong>of</strong> civil stability in <strong>Uganda</strong>, the<br />
government has been increasingly aware <strong>of</strong> the need to promote conservation, and in<br />
1988, a forest rehabilitation project was initiated on Mount Elgon.The upper reaches <strong>of</strong>
Mount Elgon received the protected status <strong>of</strong> a National Park in 1992. Prior to<br />
this, the area had been a Forest Reserve (gazetted in 1951) with objectives<br />
<strong>of</strong> forest protection and timber extraction (Synnott, 1968). The Mount Elgon<br />
Conservation and Development Project has been assisting the National Park<br />
authorities with forest and community issues since 1987.<br />
87
Dawn at the Mt. Elgon Ranges (2008)<br />
Mt. Elgon Benet Area<br />
The current aim <strong>of</strong> the project is to “promote community<br />
development and conserve Mount Elgon’s ecosystem<br />
for present and future use” using a “community<br />
based resource management approach” involving the<br />
participation and empowerment <strong>of</strong> local communities<br />
in the development process (MECDP, 1995). Working<br />
in conjunction with MENP, park regulations have been<br />
formulated with reference to the needs <strong>of</strong> local people<br />
and their resource use levels, and enforced in conjunction<br />
with a comprehensive extension programme. Collaborative<br />
management was piloted in two parishes, with the aim<br />
<strong>of</strong> extending it to all forest-adjacent parishes before the<br />
project ends in 2000.<br />
IUCN have commissioned a number <strong>of</strong> resource<br />
inventories and assessments. Katende et al. (1990)<br />
carried out a biodiversity inventory for woody perennials<br />
and birds. A Land Mapping and Biodiversity Survey <strong>of</strong><br />
Mount Elgon National Park was carried out in 1993 to<br />
assist the development <strong>of</strong> a long term management plan<br />
(van Heist, 1994). The survey described numerous aspects<br />
<strong>of</strong> the mountain with an emphasis on plant biodiversity. A<br />
“resource use assessment” was commissioned for the same<br />
purpose detailing resource use by people groups across the<br />
mountain through a series <strong>of</strong> semi-structured interviews<br />
and group discussions (Scott, 1994).<br />
88<br />
A number <strong>of</strong> forest dwellers still live in the park.<br />
They are primarily pastoralists, practising subsistence<br />
agriculture in gardens next to their houses. Prior to<br />
cultivation, the areas are burnt and cow dung is added<br />
to the soil to fertilise it. The gardens are then planted<br />
for two or three years. The high altitude prohibits the<br />
production <strong>of</strong> maize, but potatoes (Solanum tuberosum)<br />
and matoke (Musa sapientum) are widely grown. When<br />
the evictions occurred, many <strong>of</strong> these gardens and<br />
grazing areas around them were abandoned. Immediately<br />
after the 1990 evictions the forest was lacking the dense<br />
shrub layer characteristic <strong>of</strong> East African upper montane<br />
forests (Richards, 1996) and extensive areas <strong>of</strong> top-soil<br />
were exposed due to the activity <strong>of</strong> cattle (Katende,<br />
A. pers. comm.). The current pastoralists concentrate<br />
grazing activity on the Benet grasslands which meander<br />
through the forest at an altitude <strong>of</strong> approximately 2,500<br />
- 2,800 m. It is not certain whether the Benet grasslands<br />
have always been open grassy areas (van Heist, 1994)<br />
but they are maintained as artificial climax by heavy<br />
grazing. A number <strong>of</strong> cattle graze in the forest, but they<br />
are fewer in number than before the evictions. Although<br />
the Ndorobos live illegally in the area they are tolerated<br />
by the National Park authorites who are currently deciding<br />
whether to relocate them.<br />
NEMA 2008
Sunrise at the Mt. Elgon Ranges (2008)<br />
Mt. Elgon hills in Kapchorwa District (2008)<br />
NEMA 2008<br />
Donkeys are commonly used as a means <strong>of</strong> transporting produce and goods in the Mt. Elgon areas <strong>of</strong> Kapchorwa and Nbale Districts (2008)<br />
89<br />
NEMA 2008<br />
NEMA 2008<br />
NEMA file photo (2008)
90<br />
Lake Wamala<br />
Wetland<br />
degradation<br />
Lake Wamala is situated in Mityana District. The system receives numerous minor<br />
affluent watercourses and drains via the Kibimba River to the Katonga River. The<br />
Kibimba is almost permanently dry and only occasionally does it carry overspill from<br />
Lake Wamala, and when it does, this may not be sufficient to reach the Katonga. The<br />
Wamala Basin (2,654 km 2 ) is therefore usually quite separate from the Katonga Basin.<br />
Direct precipitation over the lake is estimated as 1,200 mm/yr and the largest inflow the
Mpamujugu, contributes 97 million m3/yr. The area <strong>of</strong> the lake has been<br />
shrinking over the years. The lake had an area <strong>of</strong> 164 km2 in 1990 and<br />
by 2000 the area had reduced to 87 km2 which is 50% reduction. The fish<br />
catch from Lake Wamala has declined since the lake was stocked in 1956<br />
and opened to fishing during the 1960s. <strong>Changing</strong> levels <strong>of</strong> the lake is a<br />
function <strong>of</strong> rainfall and not as a result <strong>of</strong> other environmental causes.<br />
91
92<br />
Lake<br />
Bunyonyi -<br />
Iyamuriro<br />
Wetland<br />
Effects <strong>of</strong> wetland<br />
degradation<br />
Kabale-Iyamuriro wetland depleted in one year<br />
By 1990 the Iyamuriro wetland was intact, performing hydrological and ecological<br />
functions. From the year 2005 to date, the whole eco-system has been converted to<br />
Agricultural cultivation land.<br />
NEMA 2007
Effects: • Loss <strong>of</strong> biodiversity including endemic birds e.g the Papyrus yellow warbler.<br />
This wetland is one <strong>of</strong> the Important Bird Areas (IBAs) in <strong>Uganda</strong>.<br />
• Change in micro-climate (fog and mist formation greatly altered)<br />
• Change in hydrology in the area. The conversion happened “instantly” and<br />
impacts are highly significant.<br />
.<br />
93
Aerial view <strong>of</strong> Kabale-Iyamuriro wetland<br />
Lake Bunyonyi<br />
The lake was formed due to a combination <strong>of</strong> intense<br />
rifting and back tilting <strong>of</strong> the landscape by earth<br />
movements that occurred in this area during the Tertiary<br />
times, in association with formation <strong>of</strong> the Western Rift<br />
valley in East Africa; and later the volcanic lava damming<br />
<strong>of</strong> rivers flowing on the raised and tilted landscape. As a<br />
result, Lake Bunyonyi occupies one <strong>of</strong> the deepest and<br />
long winding narrow valleys, characteristic <strong>of</strong> this Kigezi<br />
94<br />
region and a reminiscent <strong>of</strong> the intense Tertiary rifting<br />
in this part <strong>of</strong> the country. The entire lake is encircled<br />
by towering ridges and hills, with very steep slopes that<br />
abruptly drop to the very narrow lake shores. Water from<br />
rivers filled a drowned deep and moderately wide streak<br />
valley which was then dammed by lava to form one <strong>of</strong><br />
the deepest lakes in Africa. The lake covers an area <strong>of</strong> 46<br />
km 2 and has an average depth <strong>of</strong> 39m (Langlands 1974).<br />
Credit...................... NEMA 2007
Lake Bunyonyi, in Kabale District, Western <strong>Uganda</strong> (2008)<br />
The streak nature <strong>of</strong> the lake gives it a long shoreline<br />
relative to its size, with a circumference <strong>of</strong> 186 km<br />
(Langlands 1974). The lake gradient is tilted towards<br />
north-west, in accordance with the orientation <strong>of</strong> the<br />
former main valley, and the water in the lake is held<br />
back by a small band <strong>of</strong> lava flow near Muko. Water from<br />
the lake escapes through a breach in this lava band in<br />
form <strong>of</strong> a mini-rapid, and marks the beginning <strong>of</strong> a river<br />
flowing through the formerly vast and deep Iyamuriro<br />
wetland system into the Ruhuuma and from there<br />
through a narrow valley across the Kabale-Kisoro border<br />
into lake Mutanda in Kisoro District. Because <strong>of</strong> its great<br />
depth and narrow shores, and due to characteristically<br />
low temperatures <strong>of</strong> the highland region, the lake<br />
productivity in terms <strong>of</strong> fish is low.<br />
95<br />
NEMA 2008
96<br />
Lake<br />
Mutanda<br />
Rapid silting<br />
and wetland<br />
depletion<br />
Like Lake Bunyonyi, Lake Mutanda was formed due to river valley drowning and lava<br />
damming on the arena-like Kisoro plain; but the valley was not so deep in comparison with<br />
the case <strong>of</strong> Lake Bunyonyi, and hence, the resulting lake is not so deep. The lake covers 22<br />
km 2 in area, with an average depth <strong>of</strong> 22 m. The lake shore line is more regular and shorter<br />
compared to Lake Bunyoyi, with a circumference <strong>of</strong> only 60 km. The shallow nature <strong>of</strong> the<br />
lake puts it at a higher risk <strong>of</strong> demise through rapid silting compared to the deeper Lake
Bunyonyi. There are other lava dammed lakes in this same area <strong>of</strong> Kisoro<br />
District namely Murehe, Chahafi and Kayumba, but these are smaller and<br />
even shallower, and are at the verge <strong>of</strong> being killed by heavy silting. Out<br />
<strong>of</strong> Lake Mutanda, flows River Kaku, which crosses the <strong>Uganda</strong>-Democratic<br />
Republic <strong>of</strong> Congo (DRC) boundary to form part <strong>of</strong> the upper River Semliki<br />
system, a major tributary <strong>of</strong> the River Nile (Langlands 1974).<br />
97
Lake Mutanda: Heavily converted Gitundwe wetland in Nyundo and Nyakabande sub countries (2008)<br />
heavily Lake converted Mutanda Gitundwe wetland in Nyundo and Nya<br />
Source DSOER Kisoro 2008<br />
This emphasizes the local, regional and international<br />
importance <strong>of</strong> lakes Bunyonyi and Mutanda and, their<br />
catchments and the various wetland systems fringing these<br />
water systems, as one whole ecosystem whose degradation<br />
will have serious on-site and <strong>of</strong>f-site implications.<br />
<strong>Environment</strong>al Change and effects<br />
Population pressure on land and poor land management<br />
practices have led to clearance <strong>of</strong> every bit <strong>of</strong> vegetation<br />
cover in the lake catchments leading to grave accelerated<br />
erosion. In the past, efforts were made by Government to<br />
institute and enforce soil and water conservation measures,<br />
and by 1950s this region was graded to attained soil and<br />
water conservation standards, particularly bunding and<br />
terracing on farmlands, easily unsurpassed anywhere<br />
else in Africa. However, the ever mounting challenges <strong>of</strong><br />
rapid population growth coupled with later relaxation<br />
in enforcement <strong>of</strong> conservation measures has left the<br />
98<br />
lake catchments and the rest <strong>of</strong> the highland region in a<br />
desperate state, with conservation structures on farmlands<br />
and hillslopes in general disintegration from hyperaccelerated<br />
erosion (Bagoora, 1993).<br />
In the areas surrounding Lake Bunyonyi and Mutanda, the<br />
population is estimated to be beyond 350 persons/km2 making it one <strong>of</strong> the world’s most densely populated rural<br />
areas; with projections <strong>of</strong> continued high growth rates <strong>of</strong><br />
more than 3% per annum, which does not in any way point<br />
to a rosy future.<br />
Landuse is dominated by peasant farming based on annual<br />
crops dominated by sorghum, potatoes and legumes, which<br />
leads to disturbance <strong>of</strong> the soil continuously and provide<br />
poor cover and protection to soil from erosion. Although soil<br />
loss from these slopes has not yet been properly quantified,<br />
it could be within the magnitude <strong>of</strong> 155 tons/ha/year on<br />
District State <strong>of</strong> <strong>Environment</strong> Report Kisoro (2008)
NEMA community sensitisation on proper wetland management in the Iyamuriro-Mutanda wetland area<br />
the middle and upper slopes as measured on such cultivated<br />
steep slopes. This is similar to the soil loss measured on<br />
cultivated slopes in nearby Rukiga highlands (Bagoora,<br />
1997). Such rates <strong>of</strong> soil loss is intolerable by world<br />
standards.<br />
Consequently, the lakes are increasingly facing threats<br />
<strong>of</strong> demise due to silting from rapidly eroding soils on the<br />
slopes flanking them. Therefore, the lakes are in danger <strong>of</strong><br />
being lost through silting and reduction <strong>of</strong> water storage<br />
capacity, which will have serious implications on the water<br />
resources in this area, both in terms <strong>of</strong> quantity and quality,<br />
and given the added threats <strong>of</strong> climate change. Current<br />
trends indicate progressive shrinkage <strong>of</strong> the lake sizes<br />
through stages, beginning with silting <strong>of</strong> the immediate<br />
shores that are later occupied by swamps which, in turn,<br />
are encroached on and reclaimed for cultivation; a good<br />
example being the expanse swamp fringing Lake Mutanda.<br />
Both silting and encroachment on the lakeshores are<br />
thought to interfere with fish breeding and aquatic<br />
biodiversity in general and has been partly blamed for the<br />
low productivity <strong>of</strong> these lakes. Government in the year<br />
1995 declared the lakeshores and riverbanks as fragile<br />
ecosystems and accorded them special protection through<br />
designation <strong>of</strong> protection zones around lakeshores and along<br />
riverbanks. For example, lakes Bunyonyi and Mutanda have<br />
a protection zone <strong>of</strong> 200 m from the lowest water mark,<br />
where no active landuse practices are allowed without<br />
permission and regulation. There have been daunting<br />
challenges, however, in enforcing this regulation in such an<br />
area with severe land shortage and due other shortcomings<br />
in enforcement. The smaller lakes <strong>of</strong> Murehe, Chahafi and<br />
Kayumba, in order <strong>of</strong> decreasing size, are more vulnerable<br />
to demise from silting due to their size, making their near<br />
future even more grim.<br />
99<br />
NEMA 2006
100<br />
Laropi-<br />
Moyo lakes/<br />
lagoons<br />
Floods and<br />
siltation<br />
In the early 1950s much <strong>of</strong> the land area in Laropi (Dufile Sub county) was covered<br />
by adequate tree cover such as Acacia, combrentum and fig species. Because <strong>of</strong> this,<br />
some landing sites were named after the abundance <strong>of</strong> the vegetation (for example<br />
Congo). From 1979 to 1986 the local population was driven into exile and when they<br />
returned, their way <strong>of</strong> life had changed. Between 1990 and 2000, there was a boom<br />
in fish catches and fish trade. The most traded fish was smoked using traditional kilns
that consume vast quantities <strong>of</strong> fuel wood. As a result, the communities<br />
along the Nile lost over 70% <strong>of</strong> forest cover to this booming trade and the<br />
Increased populations <strong>of</strong> the landing sites. Human activity has continued to<br />
increase, reducing vegetation cover and encouraging siltation <strong>of</strong> River Nile.<br />
The lakes along the river have increased since 1960 due to climatic changes<br />
and could it could be worsened by land degradation.<br />
101
Shifted bridge as result <strong>of</strong> flooding on Ebemi stream along the Laropi-Dufile Road<br />
Rivers/streams<br />
The River Nile is fed by several perennial/seasonal streams<br />
such as Amua, Chala, Ebemi, Aburiji and Oyo. However,<br />
from 1980s to date many <strong>of</strong> the streams experienced<br />
siltation as result <strong>of</strong> changes in the livelihood <strong>of</strong> the local<br />
population, including from small scale fishing and animal<br />
rearing, to farming and extensive fishing. This is evidenced<br />
by cultivation <strong>of</strong> fragile ecosystems such as river banks,<br />
and opening up <strong>of</strong> new lands for agriculture by the local<br />
communities.<br />
Major flooding occurred in 1962 and 1998<br />
Laropi/Dufile experienced frequent flooding during 1962<br />
and 1998 and as a result several bridges on the rivers/<br />
streams were shifted three times. In addition, a portion<br />
<strong>of</strong> the road along Laropi to Dufile trading centre was also<br />
shifted northwards.<br />
102<br />
Bridge before 1998 floods<br />
Bridge after 1998 floods<br />
Laropi lakes/Lagoons<br />
River Nile is one <strong>of</strong> the major rivers found in <strong>Uganda</strong>, and<br />
it forms the south eastern border <strong>of</strong> Moyo District. Over<br />
the past years it has been noticed that several small lakes<br />
(lagoons) have formed along the Nile (here referred to<br />
as Laropi lakes). In 1960s there were only two noticeable<br />
lagoons/lakes whereas in 1980 the number <strong>of</strong> lakes<br />
increased to five and in 2000 some <strong>of</strong> lakes merged. Only<br />
four new ones can now be observed. This could have been<br />
due to the heavy rainfall in 1962 and the apparent<br />
El Niño <strong>of</strong> 1997/98. This implies that the open water areas<br />
are increasing (see graph and the combined map <strong>of</strong> extent<br />
<strong>of</strong> lakes on the opposite page respectively). The trend<br />
shows that the lagoon/lake areas have been increasing over<br />
the years.<br />
Edema Maurice 2008
Laropi lakes in 1960<br />
Laropi lakes<br />
Area coverage <strong>of</strong> Laropi lakes<br />
103
104<br />
Teso region<br />
Flooding<br />
The northern part <strong>of</strong> the wetland increased due to heavy rains that caused flooding.<br />
Usually these places are seasonal wetlands and should be left intact. On 19 th September<br />
2009 the <strong>Uganda</strong>n Government declared a State <strong>of</strong> Emergency in the northern and eastern<br />
parts <strong>of</strong> the country due to severe floods. About 30 people were killed, an estimated 8,500<br />
acres <strong>of</strong> crops were destroyed, and a number <strong>of</strong> animals drowned in the floods. 300,000<br />
people were in need <strong>of</strong> food aid and thousands <strong>of</strong> school children were forced to stay at<br />
home. Floods washed away buildings, roads and homes. The districts mostly affected were<br />
Amuria, Katakwi, Bukedea, Pader and Kitgum. According to the rainfall forecast for the
egion, the area received above normal rains (NEMA 2008). These floods hit again in<br />
August 2008 before the areas could recover; and the areas most affected were those<br />
near Lake Bisina. The causes <strong>of</strong> floods were above normal rains but the situation was<br />
worsened by loss <strong>of</strong> vegetation cover in the water catchment areas <strong>of</strong> Kapchorwa and<br />
Sironko. This led to increased run-<strong>of</strong>f to the low lands <strong>of</strong> Ngenge plains into the Teso<br />
region. Water logging has lead to new activities such as rice growing which used not<br />
to be the case in the early 1960s. In addition, overgrazing in the Teso wetlands has<br />
interfered with the wetlands not to perform their function as water reservoirs.<br />
Flooded fields<br />
NEMA 2007<br />
105
106<br />
Kampala<br />
Urbanisation and<br />
industrialisation<br />
Kampala’s changing environment<br />
Kampala has expanded since 1974, and its area is currently estimated at 197 km 2 .<br />
Land use is mixed throughout the district, consisting <strong>of</strong> the built up areas, agricultural<br />
land, rangelands and conservation areas. There are essentially three broad land use<br />
categories: agricultural land, built-up areas, and those reserved for conservation.
However, these land use categories are not entirely exclusive <strong>of</strong><br />
one another, and are inter-related (SOE, 2002).<br />
107
Kampala City (2007). Inset: Kampala City (2007)<br />
Kampala’s <strong>Changing</strong> <strong>Environment</strong><br />
<strong>Uganda</strong> is experiencing rapid urbanization estimated<br />
at an annual population growth rate <strong>of</strong> 5.5%. Kampala<br />
has remained the capital city since 1969 with equally a<br />
high annual population growth rate <strong>of</strong> 5.61%. With this<br />
growth rate, Kampala absorbs 40% <strong>of</strong> the national urban<br />
population and 4.9% <strong>of</strong> the national population (UBOS,<br />
2002).<br />
Kampala has also experienced an increase in population,<br />
from 774,241 in 1991 to 1.2 million in 2002 (UBOS 2002).<br />
The population figures reflect the night populations but<br />
the estimates show that these numbers double during<br />
the day, as many people travel to the City for work and<br />
business and return to their homes outside the City at<br />
the end <strong>of</strong> the day. The population increase in Kampala<br />
metropolitan area is responsible for increased demand<br />
for employment, land for housing, social services<br />
108<br />
Kampala City (2005)<br />
and infrastructure that have stimulated spatial urban<br />
development and industrialization, leading to rapid<br />
environmental changes.<br />
The Kampala suburbs are also experiencing Lake Bisina rapid during floods<br />
urbanization leading to development <strong>of</strong> satellite May towns 18 2007<br />
around the City. Their activities have a strong linkage<br />
with those in the City, which results in additional<br />
pressure on the City resources. Current trends indicate<br />
that these satellite towns may be merged into the<br />
present Kampala to form the Metropolitan Kampala.<br />
Towns likely to be absorbed include Mukono, Entebbe,<br />
Wakiso, Kira, Namungoona, Bweyogere, Kyengera, etc.<br />
This development will act as a catalyst to additional<br />
dynamics <strong>of</strong> environmental change <strong>of</strong> the City,<br />
particularly in these outer satellite towns.
The poorly planned and ever congested old taxi park in Kampala City<br />
The beautiful and spacious environment <strong>of</strong> Serena Hotel, Kampala, away from the hectic environs <strong>of</strong> Kampala city centre.<br />
109<br />
NEMA 2009<br />
NEMA 2009
110<br />
.<br />
.<br />
.<br />
.<br />
.
Flooding in Nsooba Lubigi drainage channel.<br />
Houses and a school are submerged in the<br />
water in 2007.<br />
Floods at Kyambogo junction: construction<br />
<strong>of</strong> industries in wetlands which are drainage<br />
channels interferes with the flow <strong>of</strong> water<br />
causing constant flooding at this junction. Traffic<br />
is blocked for hours in many cases.<br />
Dumping <strong>of</strong> solid waste in Nakivubo channel is<br />
choking the Nakivubo wetland. Nakivubo channel<br />
cleans waste water from Kampala before it is<br />
discharged into Lake Victoria. This wetland is<br />
under threat due to cultivation <strong>of</strong> yams and illegal<br />
settlements.<br />
The Kaawa Boat, one <strong>of</strong> the main transport vessels<br />
between <strong>Uganda</strong> and Tanzania docks at Port-Bell in<br />
Luzira. The water is currently infested with an algae<br />
bloom and a smelly stench hovers over the area.<br />
The main cause is pollution <strong>of</strong> Lake Victoria waters<br />
by pollutants from Nakivubo Channel.<br />
These buildings were constructed in wetlands<br />
which are the water ways for drainage into<br />
Lake Victoria. The houses were flooded in 2007<br />
temporarily interfering with traffic and business<br />
along the Kampala-Entebbe highyway.<br />
111
112<br />
Naguru-Kololo in 1959<br />
In 1959, Kamwokya valley was covered with vegetation. Presently, unplanned<br />
settlements in the water way are part <strong>of</strong> the problem causing floods<br />
NEMA 2009
Naguru-Kololo in 2004<br />
In 1959, Naguru Hill was covered with vegetation. Planned settlements on the Hill have<br />
increased the concrete surface area in Kampala contributing towards more water<br />
entering into the Nsooba-Lubigi water way, resulting in floods in Kalerwe and Bwaise<br />
113<br />
NEMA 2009
Bugolobi in 1959<br />
Unplanned settlements at Namuwongo interfering with the functions <strong>of</strong> Nakivubo wetland<br />
114
Bugolobi in 2004<br />
Bugolobi Housing Estate. In 1959, this area was a forest<br />
Nakivubo<br />
115
116<br />
Flood prone area at Clock Tower junction, Kampala (2009)<br />
.<br />
Clock T
ower<br />
117
118<br />
Construction in the Nsooba-Lubigi waterway, Kampala (2009)<br />
Bwaise<br />
.
Kalerwe<br />
Nsooba<br />
Nsooba-Lubigi<br />
119
120<br />
Construction in waterways at Zana, Kampala (2007)<br />
.
Zana water way<br />
121
122<br />
Construction <strong>of</strong> houses in Nakivubo wetland, Kampala (2007)<br />
Namuwongo<br />
.
Bugolobi<br />
Nakivubo channel<br />
.<br />
Kitintale<br />
123
124<br />
Kampala-Jinja Highway<br />
Naguru Housing Estate<br />
Nakawa market<br />
Unplanned settlements at Nakawa, Kampala (2007). It is difficult to access such<br />
settlements in event <strong>of</strong> an emergency.<br />
.
Nakawa<br />
Makerere University Business<br />
School (MUBS)<br />
125
Biomass Land use/land cover Land use/land cover<br />
km2 %<br />
Hardwood Plantations 0.31 0.16<br />
S<strong>of</strong>twood Plantation - -<br />
Tropical High Forest (Normal) 4.90 2.49<br />
Woodlands 0.30 0.15<br />
Bush lands 7.40 3.74<br />
Grasslands 0.80 0.41<br />
Wetlands 14.50 7.36<br />
Subsistence Farmlands 69.00 35.05<br />
Commercial Farmlands 1.22 0.62<br />
Built up areas 81.50 41.37<br />
Open water 16.80 8.55<br />
Impediments 0.19 0.10<br />
Total 197.00 100.00<br />
Table 1: Land use and land cover, Kampala District<br />
Impact <strong>of</strong> the <strong>Changing</strong> <strong>Environment</strong><br />
Kampala City natural environment faces continued<br />
degradation. The Biomass dynamics show a decline in<br />
tree resources. There has been an increasing demand<br />
for charcoal, with increasing pressure on neighboring<br />
district tree resources. The wetlands also face<br />
degradation for industrial and housing developments,<br />
agricultural use, as well as pollution from industrial and<br />
domestic waste.<br />
Recent developments have seen the clearing <strong>of</strong> the<br />
buffer zones <strong>of</strong> forests and open spaces, as well as<br />
encroachment on the wetlands. Buildings and other<br />
forms <strong>of</strong> infrastructure have replaced the forests, open<br />
spaces and the wetland vegetation. The impacts <strong>of</strong> this<br />
change have been far reaching. Most <strong>of</strong> Kampala’s land<br />
surface in the built up areas is highly paved leading to<br />
reduced water infiltration and hence to generation <strong>of</strong><br />
high storm waters. The storm water has <strong>of</strong> late caused<br />
flooding in Bwaise and most low-lying areas <strong>of</strong> Kampala<br />
City.<br />
In a bid to fight the floods, a lot <strong>of</strong> drainage channels<br />
have been placed and several widened to alleviate the<br />
problem. The efforts have hardly solved the problem as<br />
the constructed drainage channels have failed to contain<br />
the heavy run <strong>of</strong>f leading to continued floods.<br />
126<br />
<strong>Uganda</strong> National Bureau <strong>of</strong> Statistics (UNBS) 2008<br />
Indiscriminate solid waste disposal in the Nsooba-Lubigi<br />
water channel near Kalerwe market<br />
The problem has been exacerbated by heavy silt and<br />
solid waste carried by run <strong>of</strong>f from construction sites and<br />
homesteads, respectively.<br />
Government and Kampala City Council in particular,<br />
should make efforts to solve the problem <strong>of</strong> floods in the<br />
City. One <strong>of</strong> the options would be to identify and gazette<br />
all critical wetlands and drainage systems that serve to<br />
absorb and regulate storm waters.<br />
Kampala is served by two major wetland systems namely<br />
the Nsooba–Lubigi and Nakivubo Wetland systems. The<br />
ongoing process <strong>of</strong> gazetting Nakivubo wetland system<br />
for water attenuation and purification needs to be<br />
finalised. A similar process should be undertaken for the<br />
Nsooba – Lubigi wetland system to serve as a storm water<br />
attenuation area. The long term interventions therefore,<br />
would be to resettle people from the flood attenuation<br />
areas and safe guard the natural drain pattern <strong>of</strong> the City.<br />
Causes <strong>of</strong> environment changes in Kampala<br />
• Urbanisation<br />
• Wetland encroachment<br />
• Deforestion<br />
This has resulted into increased run<strong>of</strong>f during the<br />
downpours causing frequent flooding that are so rampant<br />
in several places in Kampala.<br />
NEMA 2008
Effects <strong>of</strong> the Northern By-pass during the rainy season (2007)<br />
Prior to the peak <strong>of</strong> urbanisation being experienced now,<br />
these two systems had a wide coverage <strong>of</strong> wetlands and<br />
around them a buffer <strong>of</strong> thick forests. Citizens in 1960s<br />
would use boats to cross over from Kamwokya along the<br />
stream through the present Centenary Park to Luzira.<br />
The streams even had a lot <strong>of</strong> water then.<br />
This has seen most <strong>of</strong> the water in these places drained<br />
and lowering the water tables temporailiry during the<br />
dry seasons.<br />
The shrinkage <strong>of</strong> Nsooba-Lubigi wetland system in the<br />
upper catchments due to settlements has increased the<br />
retention time <strong>of</strong> the water in the lower reaches during<br />
rains resulting into flooding. It should be noted that the<br />
gradient <strong>of</strong> this system is quite low making the water<br />
meander at a slow rate as it finds its level. This process<br />
has greatly increased on the wetland coverage downstream<br />
around the Kampala-Wakiso border and beyond.<br />
Areas <strong>of</strong> Namungoona have seen land that was dry being<br />
reclaimed by the wetland overtime.<br />
There has been contionous shrinkage <strong>of</strong> the Nakivubo<br />
wetland system. The gradient <strong>of</strong> this drainage system is<br />
a bit steeper than that <strong>of</strong> Nsooba-Lubigi wetland system<br />
and so water in this system has less time to reticulate<br />
and claim some areas. The situation was worsened by<br />
the widening <strong>of</strong> Nakivubo Channel which saw a lot <strong>of</strong><br />
NEMA 2007<br />
Flooding in Bwaise, a Kampala surbub after a heavy down pour (2008)<br />
water being drained from these areas. This has greatly<br />
lowered the water table in these areas leading to further<br />
encroachment <strong>of</strong> the remaing strectches for agriculture.<br />
Water Quality<br />
In the 1960s Kampala had clear water in the streams and<br />
good drinking water in the natural springs.<br />
Overtime, the city has had the water quality<br />
deteriorating due to:<br />
• Contamination <strong>of</strong> water from pit latrines and<br />
poorly constructed ‘hanging’ latrines that<br />
are opened into the channels during rains<br />
• Frequent flooding that ends up draining the pit<br />
latrines directly into the water tables<br />
Currently, more than 85% <strong>of</strong> the spring wells in Kampala<br />
are polluted with E-coli- a sign <strong>of</strong> faecal contamination.<br />
• Industries that have been constructed close to<br />
water ways, releasing their effluents into the<br />
water.<br />
• The silt which is being eroded from the opened<br />
up areas and during the rains is swept down into<br />
the water sources. Overtime, Lake Victoria has<br />
become more turbid and this has a negative<br />
impact on the fish industry since it leads<br />
to silting up <strong>of</strong> the breeding grounds for fish.<br />
127<br />
NEMA 2008
Positive impacts <strong>of</strong> Kampala’s changing environment<br />
Hon. Maria Mutagamba, Minister<br />
<strong>of</strong> Water and <strong>Environment</strong><br />
(middle-front) launches the URA-<br />
NEMA-Celtel “Keep the Pearl<br />
Clean” Waste Wise campaign<br />
(2008) at Nakawa Trading<br />
Centre, Kampala. Ms. Allen<br />
Kagina, Commissioner-General<br />
URA (first-left), Dr. Aryamanya-<br />
Mugisha-Henry, Executive<br />
Director NEMA; stakeholders and<br />
the general public participated in<br />
the lauch.<br />
Below: Part <strong>of</strong> the day’s collection<br />
<strong>of</strong> garbage during the Waste<br />
Wise campaign lauch.<br />
128<br />
Hon. Jesca Eriyo, Minister <strong>of</strong> State for <strong>Environment</strong> inspects the exhibition stall mounted by the Ministry <strong>of</strong> Water and<br />
<strong>Environment</strong> during the CHOGM meet, held in Kampala, November 2007; all sectors under the Ministry collaborated to<br />
exhibit in one stall. Inset: the CHOGM Monument near the Parliamentary Building and the President’s Office.<br />
NEMA 2007
NEMA 2008<br />
George Lubega <strong>of</strong> NEMA (third from left-front) takes District <strong>Environment</strong> Officers through initiation <strong>of</strong> wetland management<br />
Partnerships in environment management: (Left-Right) Nile Basin Initiative (NBI) Community clean-up campaign in Makindye,<br />
Kampala District as part <strong>of</strong> the environment week activities to mark World <strong>Environment</strong> Day 2006; Enhanced <strong>Environment</strong>al<br />
Education: Pupils <strong>of</strong> Green Hill Academy, Kampala District display environmental messages and activities during the school’s Open Day<br />
(2005)<br />
Nile Basin Initiative (NBI) 2006<br />
Phoebe Gubya<br />
129<br />
NEMA 2007<br />
NEMA 2005
A<br />
Some <strong>of</strong> the<br />
landmarks in<br />
the middle <strong>of</strong><br />
Kampala City<br />
A. <strong>Uganda</strong> Houses<br />
<strong>of</strong> Parliament, kept<br />
orderly and still<br />
going strong (2008)<br />
B. CHOGM<br />
Monument<br />
C. Indepenedence<br />
Monument<br />
130<br />
B<br />
NEMA 2008<br />
C<br />
NEMA 2008<br />
NEMA 2008
Luwum Street: Boda-boda cyclists increasingly create confusion to pedestrians and motorists on Kampala streets (2008)<br />
Below: Down town Kampala near Mini Price junction (2008)<br />
131<br />
NEMA 2009<br />
NEMA 2009
132<br />
NEMA 2008
Transboundary and cross-border environmental issues<br />
Chapter 3<br />
Transboundary and cross-border environmental issues in <strong>Uganda</strong><br />
The source <strong>of</strong> River Nile at Jinja. The River Nile leaves Lake Victoria at Jinja. The tributaries <strong>of</strong> the Nile flow through nine countries in Africa into the Mediterranean Sea.<br />
Distribution <strong>of</strong> natural resources and biodiversity<br />
oes not respect boundaries, which makes their<br />
management <strong>of</strong> transboundary in character.<br />
<strong>Uganda</strong> shares boundaries with Kenya, Tanzania,<br />
Democratic Republic <strong>of</strong> Congo, Rwanda and Sudan. Many<br />
protected areas, rivers, lakes in <strong>Uganda</strong> are shared with<br />
these countries. For example one <strong>of</strong> the longest river<br />
in Africa, the Nile and is shared by many countries has<br />
its source in <strong>Uganda</strong>. Furthermore, <strong>Uganda</strong> now has 80<br />
districts and many ecosystems are shared among districts<br />
which calls for increased collaborative efforts to manage<br />
these resources. <strong>Uganda</strong> has signed several agreements<br />
with its neighbors to manage some <strong>of</strong> these resources.<br />
The Nile Basin Initiative (NBI) is a partnership initiated<br />
and led by the riparian states <strong>of</strong> the Nile River through<br />
the Council <strong>of</strong> Ministers <strong>of</strong> Water Affairs <strong>of</strong> the Nile Basin<br />
states (Nile Council <strong>of</strong> Ministers, or Nile-COM). The NBI<br />
seeks to develop the river in a cooperative manner, share<br />
substantial socioeconomic benefits, and promote regional<br />
peace and security.<br />
Lake Victoria is also another resource where <strong>Uganda</strong> has<br />
gone into partnership with its neighbors to manage it<br />
sustainably. The East African Community has designated<br />
Lake Victoria and its Basin as an “area <strong>of</strong> common<br />
economic interest” and a “regional economic growth<br />
zone” to be developed jointly by the Partner States.<br />
And Lake Victoria is the focus <strong>of</strong> new attention following<br />
the declaration by the East African Community Heads<br />
<strong>of</strong> State that a joint programme be developed for the<br />
overall management and rational utilization <strong>of</strong> the<br />
shared resources <strong>of</strong> the lake.<br />
The East African Community established the Lake<br />
Victoria Development Programme in 2001, as a<br />
mechanism for coordinating the various interventions<br />
on the Lake and its Basin; and serving as a centre for<br />
promotion <strong>of</strong> investments and information sharing among<br />
the various stakeholders. Currently there is the Lake<br />
Victoria commission that became effective in 2005 with<br />
its headquaters at Kisumu. It is the apex institution <strong>of</strong><br />
EAC mandated with overall coordination.<br />
133<br />
NEMA 2008
Mt. Elgon borders <strong>Uganda</strong> and Kenya in the east<br />
The Mount Elgon National Park straddles the<br />
international boundary between Kenya and <strong>Uganda</strong> and<br />
is a watershed <strong>of</strong> international importance, feeding<br />
the waters <strong>of</strong> Lake Victoria, the Nile River system, and<br />
Lake Turkana. The core ecosystem in the Mt Elgon area<br />
is characterized by large montane forest landscapes; it<br />
comprises several protected areas. Adjacent is a vast,<br />
134<br />
heavily populated agricultural landscape supporting up<br />
to 2 million people, whose livelihoods and economic<br />
activities are largely dependent on the ecosystem goods<br />
and services <strong>of</strong> the highlands. The mountain ecosystem<br />
<strong>of</strong> Mt Elgon is thus vital to the social and economic<br />
functioning <strong>of</strong> the surrounding areas, both in the<br />
highlands and in the lowlands.<br />
NEMA 2008
A Mutuku herdsman tends his cattle near Mt. Rwenzori ranges at<br />
the border <strong>of</strong> <strong>Uganda</strong> and the Democratic Republic <strong>of</strong> Congo (2006)<br />
135<br />
NEMA 2006
136<br />
Mt. Rwenzori<br />
Glaciers<br />
Global warming,<br />
disappearing ice<br />
caps,<br />
reduced stream<br />
water<br />
Changes in glacial extent: Rwenzori mountains<br />
Source: Mileham et al, in press quoted in<br />
Pomeroy & Tushabe (2004)<br />
If global warming persists, ice cover on the peaks <strong>of</strong> the Rwenzoris (Baker, Speke and<br />
Stanley) will disappear altogether by 2023 (Mileham et al in press). In 1987 there was<br />
more snow on the Stanely, Baker and Speke peaks but by 2005 there are strong signs<br />
<strong>of</strong> reduction in snow. The disappearance <strong>of</strong> the ice cover will mean reduced water<br />
Source: <strong>Atlas</strong> <strong>of</strong> <strong>Environment</strong> Change for Africa, UNEP 2008
flow in the receiving streams which feed into Lakes George and<br />
Edward and Semliki River, discharging water into Lake Albert and<br />
finally into the Nile. The biodiversity and tourism potential <strong>of</strong> the<br />
Rwenzori will also be affected.<br />
Mt. Rwenzori ranges, Kasese District<br />
137<br />
NEMA 2007<br />
Source: <strong>Atlas</strong> <strong>of</strong> <strong>Environment</strong> Change for Africa, UNEP 2008
138<br />
River Semliki<br />
Eroded banks <strong>of</strong><br />
River Semliki;<br />
Expansion <strong>of</strong><br />
shoreline due<br />
to increased<br />
siltation <strong>of</strong> Lake<br />
Albert due to land<br />
degradation<br />
River Semliki is one <strong>of</strong> the most important rivers that form <strong>Uganda</strong>’s natural drainage<br />
system. The river derives its origin from Lake Edward through Mt. Rwenzori and a<br />
series <strong>of</strong> tributaries that join it along its 140 km course in the Albertine Rift (Western<br />
Rift Valley), before draining into Lake Albert. In the first 40 km, the river travels<br />
through a heavily forested Semliki National Park, while for the remaining distance it<br />
flows through grasslands that are inhabited by the Batuku pastoral community. The<br />
river is geopolitically important because it defines the border between <strong>Uganda</strong> and<br />
the Democratic Republic <strong>of</strong> Congo (DRC). The satellite image <strong>of</strong> February 2002 shows<br />
River Semliki depositing silt into Lake Albert.
Bathymetry Map, Lake Albert<br />
Lake Albert is Africa’s seventh largest lake<br />
situated in the western rift valley on the border<br />
between <strong>Uganda</strong> and the Democratic Republic <strong>of</strong><br />
Congo. It lies at an altitude <strong>of</strong> 616 m above sea<br />
level, is 160 km long and has an average width<br />
<strong>of</strong> 32 km. In the south-west, the Semliki River<br />
brings into the lake the waters <strong>of</strong> Lake Edward<br />
and at its north-eastern side corner just below<br />
Murchison Falls; it receives the Victoria Nile from<br />
Lake Kyoga. The southern part <strong>of</strong> Lake Albert is<br />
shallower possibly due to to silting. This part <strong>of</strong><br />
the lake is the breeding area for fish.<br />
There is evidence from the landsat TM image <strong>of</strong><br />
2000, spot image <strong>of</strong> 1980 and MSS image <strong>of</strong> 1973<br />
that the shoreline is shifting southwards. The delta<br />
at the mouth <strong>of</strong> the river is due to siltation and it is<br />
expanding at a rate <strong>of</strong> 3.5 km/yr into the lake.<br />
Semliki National Park Semliki River Delta<br />
139
A herd <strong>of</strong> cattle grazing and watering at the banks <strong>of</strong> River Semliki<br />
<strong>Changing</strong> river course <strong>of</strong> the River Semliki<br />
Increased river bank erosion due to overgrazing, melting<br />
<strong>of</strong> ice on the Mount Rwenzori and degradation <strong>of</strong> the<br />
water catchments has resulted in siltation changing the<br />
river course significantly over the years as it enters Lake<br />
Albert.<br />
The Semliki River is in its old stage, and like any aging<br />
river, it has characteristic meanders and forms oxbow<br />
lakes in some places. In spite <strong>of</strong> its old stage, it still<br />
has enormous erosive power which is realized when it<br />
emerges from the forested Semliki National Park onto<br />
the Semliki flats in Rwebisengo sub-county, Bundibugyo<br />
140<br />
NEMA 2007<br />
District. This approximately 100 km long section <strong>of</strong> the<br />
river in the Semliki flats has seriously eroded its banks.<br />
The local communities along the river are cattle keepers<br />
who graze along and collect water from the same river.<br />
On the <strong>Uganda</strong> side, the town <strong>of</strong> Rwebisengo is only 1.5<br />
km away from the river and there are numerous other<br />
homesteads along it. The human and livestock activities<br />
have greatly affected the natural vegetation along its<br />
course, thus leading to river bank breakage. Over 10 m<br />
<strong>of</strong> the river bank on <strong>Uganda</strong>’s territory is eroded annually<br />
at various points and as a result, it seems to have doubled<br />
its width within the last ten years.<br />
NEMA 2007<br />
NEMA 2006
Looking up the North escarpment along Lake Albert Oil exploration in the Albertine Graben<br />
Oil eploration in the Albertine Graben<br />
PEPD 2006<br />
PEPD 2006<br />
Since 1925 the area <strong>of</strong> Lake Albert<br />
commonly referred to as the Albertine<br />
Graben, has been known to possess potential<br />
for petroleum. Presently, it is confirmed that<br />
the Albertine Graben that is a biodiversity<br />
hot spot is now a petroleum zone. The<br />
area stretches from the West Nile region<br />
downwards to Kasese District.<br />
141<br />
PEPD 2006
142<br />
Kagera River<br />
Siltation <strong>of</strong> Lake<br />
Victoria from River<br />
Kagera;<br />
uncontrolled<br />
agricultural<br />
practices and<br />
pollution<br />
Lake Victoria, the second largest freshwater body in the world (area 68,800 km 2 ), is<br />
generally shallow (max. depth 84 m; mean depth 40 m), and has an irregular shoreline<br />
<strong>of</strong> about 3,440 km in length. The lake lies astride the Equator between latitude 2.50<br />
S and 1.50 N, and longitude 320 and 350 E; shared by three riparian states (Kenya 6%,<br />
Tanzania 51%, and <strong>Uganda</strong> 43%, by area). Lake Victoria catchments are constituted by<br />
five countries (Kenya, Tanzania, <strong>Uganda</strong>, Burundi, and Rwanda) and drained by a number<br />
<strong>of</strong> large rivers as well as many small rivers and streams. River Nile is the single outlet and<br />
82% <strong>of</strong> the water input in the lake comes directly from rainfall.
Elephant in QENP<br />
The Kagera River which originates from Burundi, and forms the Rwanda-Tanzania,<br />
Tanzania-<strong>Uganda</strong> borders is the largest contributor <strong>of</strong> water from the catchments.<br />
The satellite images <strong>of</strong> 1987 and 2008 show high reflectance <strong>of</strong> water from the Kagera<br />
River due to silt. Silt and suspended solids impact on water bodies by loading nutrients<br />
into the lake. Nutrients stimulate algae growth which reduces oxygen leading to<br />
eutrophication and reduction in fish. Siltation is mostly associated with agricultural<br />
activities. The delta at the mouth <strong>of</strong> the river has shifted more into the lake and it is<br />
likely to join with the small island below the mouth <strong>of</strong> the river (circled).<br />
143
144<br />
Lake Victoria<br />
Green algae<br />
bloom,<br />
Water hyancith<br />
Green algae bloom on Lake Victoria in Entebbe on the 17th December 2007<br />
Water quality in Lake Victoria has declined greatly in the past few decades, owing<br />
chiefly to eutrophication arising from increased inflow <strong>of</strong> nutrients into the lake.<br />
Nutrient inputs have increased two to three-fold since the turn <strong>of</strong> the century, mostly<br />
since 1950. Concentrations <strong>of</strong> phosphorus have risen markedly in the deeper lake<br />
waters, and so has nitrogen around the edges. Stimulated by these and other nutrients,<br />
the five-fold increase in algae growth since 1960, and the shift in its composition<br />
towards domination by blue-green algae, are causing deoxygenation <strong>of</strong> the water,
The Kaawa ship docks on the Green algae bloom contaminated<br />
waters <strong>of</strong> Lake Victoria at the Port Bell port, near Kampala.<br />
Restoration <strong>of</strong> Kagera River Basin: NEMA team and the Wetlands Management Department staff led by the Executive Director, Dr. Aryamanya-Mugisha<br />
(pointing at the silted river in background) conducted consultations with stakeholders from Isingiro and Rwanda on management and restoration <strong>of</strong> the river<br />
basin bordering <strong>Uganda</strong>, Rwanda and Tanzania (2006)<br />
increased sickness to humans and animals drawing water from the lake, clogging <strong>of</strong><br />
water intake filters, and increased chemical treatment costs for urban centers. Aside<br />
from the near-total loss <strong>of</strong> the deepwater species, the deoxygenating <strong>of</strong> the lake’s<br />
bottom waters now poses a constant threat, even to fish in shallower portions <strong>of</strong> the<br />
lake, as periodic upwelling <strong>of</strong> hypoxic water causes massive fish kills. The increased<br />
nutrient loads have also spurred the water hyacinth infestations. In addition, massive<br />
blooms <strong>of</strong> algae have developed, and come increasingly to be dominated by the<br />
potentially toxic blue-green variety. The distance at which a white disc is visible from<br />
the surface, (a transparency index measuring alga abundance), has declined from 5<br />
meters in the early 1930s to one meter or less for most <strong>of</strong> the year in the early 1990s.<br />
Water-borne diseases have increased in frequency. Water hyacinth, absent as late as<br />
1989, has begun to choke important waterways and landings, especially in <strong>Uganda</strong>.<br />
NEMA 2009<br />
Water hyacinth at the shores <strong>of</strong> Lake Kyoga, Zengebe, Nakasongola<br />
District. The plant has devastating impacts on water bodies, aquatice<br />
biodiversity and people’s livelihoods.<br />
145<br />
NEMA 2006<br />
NEMA 2008
146<br />
Lake Kyoga<br />
Shallow lake,<br />
unstable water<br />
levels and water<br />
surface areas,<br />
sudds, changes in<br />
catchments flora<br />
and fauna<br />
A<br />
Lake Kyoga is a shallow lake with a surface area <strong>of</strong> 4000 km 2 . Half a million people live<br />
on its shores and some on the floating sudds, relying on the lake for their livelihood.<br />
The Kyoga system is characterised by high hydrological variability leading to large<br />
fluctuations in lake levels, water surface areas, shoreline lengths and associated<br />
changes in flora and fauna. During the early part <strong>of</strong> the last century, Kyoga and Kwania<br />
were shallow swamps with little open water. The most important hydrological event in<br />
recent history was the sudden, drastic increase in lake level following very heavy rains
in the early 1960s that resulted in considerable expansion <strong>of</strong> open water areas<br />
<strong>of</strong> the lakes. Water levels and lake surface area declined in a fluctuating manner<br />
during the next two decades until a second major flood event occurred as a<br />
result <strong>of</strong> El Nino ˜<br />
rains in 1997/98. The satellite images <strong>of</strong> 1986 and 2002 show<br />
the floating sudds on the lake. By 2002 the outlet <strong>of</strong> the Nile had been blocked<br />
leading to flooding on some <strong>of</strong> the shore lines. Evidence <strong>of</strong> flooding can be seen<br />
at point A <strong>of</strong> 1986 and 2002 images respectively.<br />
A<br />
147
NEMA staff and Lira District <strong>of</strong>ficials in a follow-up meeting on enforcement <strong>of</strong> illegal settlements on sudds (2006).<br />
The meeting took place inside a ‘Disco/Film’ make shift structure.<br />
Sudds and blockage <strong>of</strong> the River Nile on Lake<br />
Kyoga<br />
Sudds occur as floating land masses on the lake and they<br />
are as old as the lake. The Nile River is the effective<br />
creator <strong>of</strong> these sudds. As it progresses it drags the<br />
papyrus and mud along and in the long run sudds form and<br />
drift <strong>of</strong>f into the centre <strong>of</strong> the lake where they continue<br />
to grow into large masses. The satellite image <strong>of</strong> 1986<br />
shows sudds floating on the lake. However, the flood event<br />
<strong>of</strong> 1997/1998 caused a large number <strong>of</strong> papyrus sudds to<br />
be released from the shoreline and to float downstream<br />
towards the Nile outlet <strong>of</strong> the lake. At the point the outlet<br />
148<br />
is narrow and this caused the sudds to jam and form a<br />
blockage in early 1998. As more floating sudds continued<br />
to drift downstream, they added to the bottleneck,<br />
forming a papyrus blockage 16 km long and over 80 km 2 in<br />
area (satellite image <strong>of</strong> 2002). This vegetative blockage<br />
slowed water flow from the Nile outlet and raised water<br />
levels by 2m in 1999-2000. Two channels were opened by<br />
the Directorate <strong>of</strong> Water Development (DWD) in 2001-2002<br />
and later on a team from Egypt had to dredge to allow<br />
water flow downstream.<br />
NEMA 2006
Above: Illegal settlements on the sudds. Inset: A ‘Film hall’. Communities at the sudds lead recklessles lives.<br />
Below: Technical staff inspecting the sudds and catchments.<br />
149<br />
NEMA 2006<br />
NEMA 2006
150<br />
Kasyoha–<br />
Kitomi Forest<br />
Reserve<br />
Deforestation,<br />
protected areas,<br />
encroachment<br />
The Kasyoha–Kitomi Forest Reserve is part <strong>of</strong> the network <strong>of</strong> protected areas that form the<br />
largest area <strong>of</strong> protected land in the Albertine Rift. The diversity <strong>of</strong> the region is fantastic<br />
and Kitomi Forest contributes a great deal to that aspect. Kitomi provides critical habitat for<br />
over 350 chimpanzee and 300 elephants. This forest reserve is shared between the districts<br />
<strong>of</strong> Bushenyi, Ibanda and Kamwenge and the largest part <strong>of</strong> the forest falls in Bushenyi<br />
district. In the year 2000, it became apparent that encroachment and illegal logging within<br />
the thin corridor between Kitomi Forest and Kyambura Wildlife Reserve (which forms part<br />
<strong>of</strong> Queen Elizabeth National Park (QENP)) was threatening to sever this 400 km² <strong>of</strong> vital
Elephants in QENP<br />
The Delta in MFNP<br />
Elephant in QENP<br />
habitat from QENP. Implications <strong>of</strong> this are that the chimpanzee population <strong>of</strong> the<br />
region would become separated making two populations unviable. This area is a critical<br />
seasonal resource for the elephants <strong>of</strong> the central sector <strong>of</strong> QENP. Elephants are being<br />
forced to pass through protected area ‘farmland’, destroying crops as they move along,<br />
just to reach an area that they have always used (http://www.ugandacf.org/Projects/<br />
ksr_project.html). The forest area from the 1960 topographic maps was 444 km² and the<br />
same area from the Landsat TM image <strong>of</strong> 2000 is 368 km². In 2008 the boundary <strong>of</strong> the<br />
forest is very distinct as all the surrounding areas have been turned to farmland.<br />
UWA 2008<br />
151
152<br />
Rhino<br />
Refugee<br />
camp<br />
Impact <strong>of</strong> refugee<br />
settlements in<br />
West Nile<br />
Location <strong>of</strong> Yoro<br />
Location <strong>of</strong> Yoro<br />
The presence <strong>of</strong> refugee settlements has had an environmental impact on land in<br />
West Nile, particularly deforestation as a result <strong>of</strong> Sudanese refugees producing<br />
charcoal to sell in south Sudan. Most Sudanese refugees live in settlements<br />
and cultivate their own food on designated land. Located on the banks <strong>of</strong> the<br />
River Nile in the northwest corner <strong>of</strong> <strong>Uganda</strong>, Rhino Camp hosts approximately
26,000 refugees, the majority <strong>of</strong> whom are from southern Sudan.<br />
Rhino Camp consists <strong>of</strong> widely-scattered residential areas over an<br />
area <strong>of</strong> 225 km 2 , interspersed with agricultural land cultivated by<br />
the refugees. In 1989 the area was covered with vegetation and<br />
wetlands. By the year 2008, the area had been turned into farmland.<br />
153
Misuse <strong>of</strong> seasonal wetlands: Teso floods in 2007<br />
168 154<br />
NEMA 2007
Tracking <strong>Environment</strong>al Sustainability<br />
Chapter 4<br />
T r a c k i n g E n v i r o n m e n t a l S u s t a i n a b i l i t y<br />
Restoration <strong>of</strong> bare hills in Mbarara District, 2005<br />
<strong>Uganda</strong>’s economy enjoyed positive<br />
growth throughout the first part <strong>of</strong> this<br />
decade. GDP growth was 6.0 per cent per<br />
annum for most <strong>of</strong> early 2000s, but increased to<br />
7.1 per cent in 2008. <strong>Environment</strong> and natural<br />
resource (ENR) assets accounted for the bulk <strong>of</strong><br />
this growth. For most years, ENR contributed<br />
more than 50 per cent <strong>of</strong> GDP.<br />
<strong>Uganda</strong>’s economy is closely linked to her rich<br />
environment and natural resource base. Agriculture<br />
however continues to determine <strong>Uganda</strong>’s success in<br />
terms <strong>of</strong> economic growth and poverty reduction. The<br />
sector’s share <strong>of</strong> GDP remains high at 21% (2007) having<br />
only recently reduced from 47.7% in the late 1990’s and<br />
41.6% in the early 2000’s. The sector continues to absorb<br />
the largest share <strong>of</strong> the labour force.<br />
155<br />
NEMA 2005
<strong>Uganda</strong>’s economy<br />
More than 73% <strong>of</strong> the population is mostly the primary<br />
agricultural sub-sector. The country is well endowed with<br />
both renewable and non-renewable resources including<br />
minerals, forests, wetlands, fertile soils, wildlife, lakes<br />
and rivers, hydro-power and a good climate.<br />
Although GDP increased positively in the last 23 years,<br />
the positive benefits <strong>of</strong> GDP growth have not been felt in<br />
every household in <strong>Uganda</strong>.<br />
156<br />
Services 36%<br />
Industry 6%<br />
Electricity and<br />
water supply 1%<br />
GDP Growth Rate<br />
GDP Gowth Rate<br />
Source: UBOS 2008<br />
Construction 6%<br />
Agriculture, forestry<br />
and fisheries 51%<br />
Poverty and inequity continue to prevail albeit at a<br />
reducing level.Some <strong>of</strong> the causes <strong>of</strong> persistent poverty<br />
and inequality include rapid population growth (2.3<br />
per cent and one <strong>of</strong> the fastest in the world) and<br />
environmental degradation. Rapid and unplanned<br />
population growth overstretches the capacity <strong>of</strong> the<br />
environment to sustain economic progress and human<br />
well-being.<br />
Year<br />
Services 52%<br />
Industry 6%<br />
1992 Project 2008<br />
Source: State <strong>of</strong> <strong>Environment</strong> Report for <strong>Uganda</strong> 1996 and <strong>Uganda</strong> Bureau <strong>of</strong> Statistics 2008<br />
Agriculture, forestry<br />
and fisheries 15%<br />
Construction 24%<br />
Electricity and<br />
water supply 3%
<strong>Uganda</strong>’s MDGs Status<br />
<strong>Uganda</strong>’s MDGs Status<br />
<strong>Uganda</strong> has made substantial progress towards achieving the MDGs, although more needs to be done if all are<br />
to be attained. With continued good policies, <strong>Uganda</strong> appears likely to achieve targets for Goals 1, 3, 6, 7<br />
and 8.<br />
The country may also achieve Goal 2 on Universal Primary Education (UPE) and the target for hunger. This<br />
will however require greater effort in encouraging children to complete Primary level education.<br />
However, progress towards Goals 4 and 5 – to reduce child mortality and to improve maternal health – is<br />
uncertain. Most mortality is due to malaria, diarrheal diseases and upper and lower chest infections most <strong>of</strong><br />
which diseases have a direct environmental link.<br />
Considerable effort has gone into providing safe water within easy reach for all <strong>Uganda</strong>ns by 2015. However,<br />
achievements todate still fall short <strong>of</strong> the target.<br />
<strong>Uganda</strong> is reported to be losing its forest cover through deforestation. Various studies (e.g FD, 2000; MFPED,<br />
1994; FAO, 2000 - cited in UNDP, 2004) report estimates <strong>of</strong> varying annual deforestation rates from 550 km2 per year to 700 km2 - 2,000 km2 per year, primarily due to deforestation for agricultural land.<br />
UNDP, 2007, Millennium Development Goals <strong>Uganda</strong>’s Progress Report<br />
Malaria control: PMI Net Retreatment launch at Nabwigulu<br />
Sub county, Kamuli District (2008)<br />
UPHOLD 2008<br />
A typical 3-point water supply, Kamuli District Inset: A self-closing water tap<br />
prevents wastage<br />
Simondwa 2008<br />
157
Millennium Development Goals (MDGs)<br />
MDG Performance How vulnerability<br />
affects achieving MDGs<br />
1. Eradicate extreme<br />
poverty and hunger<br />
2. Achieve Universal<br />
Primary Education<br />
3. Promote gender equality<br />
and empower women<br />
• Population living below the<br />
poverty line reduced from<br />
56% to 31% between 1992<br />
and 2006<br />
• Between 1995 and 2006,<br />
the proportion <strong>of</strong> underweight<br />
children reduced from 25.5%<br />
to 20.4%<br />
• Food calorific intake<br />
deficiency increased from<br />
58.7% in 1999 to 68.5% in<br />
2006<br />
• The introduction <strong>of</strong> UPE<br />
in 1997 led to a substantial<br />
increase by 132% in gross<br />
enrollment from the pre-UPE<br />
total <strong>of</strong> 3.1 million in 1996 to<br />
7.2 million children in 2006<br />
• The affirmative action policy<br />
led to an increase in the<br />
proportion <strong>of</strong> females to the<br />
total student enrollment by<br />
31% in 1993/94 to 40% in<br />
2002 and up to 42% in 2004<br />
• In the current Parliament,<br />
89 <strong>of</strong> the 310 members are<br />
women, representing 28.7%<br />
<strong>of</strong> the legislative body. This is<br />
an improvement from the 18%<br />
registered in 1995<br />
4. Reduce child mortality • Over the period 1995-2000,<br />
maternal mortality stagnated<br />
at about 505 deaths per<br />
100,000 live births<br />
• To meet the MDG target,<br />
<strong>Uganda</strong> will need to reduce its<br />
mortality rate from 505 to 131<br />
deaths per 100,000 live births<br />
by 2015<br />
5. Improve maternal health • Over the period 1995-2000,<br />
maternal mortality stagnated<br />
at about 505 deaths per<br />
100,000 live births<br />
158<br />
• To meet the MDG target,<br />
<strong>Uganda</strong> will need to reduce its<br />
mortality rate from 505 to 131<br />
deaths per 100,000 live births<br />
by 2015<br />
• The impairment <strong>of</strong><br />
ecosystem functions inevitably<br />
leads to a narrowing <strong>of</strong><br />
livelihood choices especially<br />
for poor people<br />
• Disasters like floods affect<br />
food security and general<br />
human well being like it was<br />
with north eastern parts <strong>of</strong> the<br />
country<br />
• Dwindling forests and<br />
woodland cover leads to<br />
scarcity <strong>of</strong> wood. This means<br />
children have to spend<br />
more time looking for fuel,<br />
which can reduce time and<br />
concentration at school<br />
• Gender issues like<br />
conflicts in land resources<br />
management, unequal<br />
access to land and resources<br />
disempower women<br />
• Violence and sexual abuse<br />
against women especially<br />
in the northern war region<br />
makes women vulnerable to<br />
diseases, etc.<br />
• Indoor air pollution affects<br />
women’s health and can<br />
make women less fit for<br />
childbirth and at greater risk <strong>of</strong><br />
complications<br />
• Indoor air pollution affects<br />
women’s health and can<br />
make women less fit for<br />
childbirth and at greater risk <strong>of</strong><br />
complications<br />
Strategies for reducing<br />
vulnerability to support<br />
achieving MDGs<br />
• Ensure sound and equitable<br />
management <strong>of</strong> natural<br />
resources.<br />
• Robust food security<br />
programmes especially in<br />
northern <strong>Uganda</strong><br />
• Building the capacity <strong>of</strong><br />
disaster preparedness and<br />
refugees department to deal<br />
with the challenges <strong>of</strong> disaster<br />
• Restore and maintain<br />
ecosystem health and<br />
services<br />
• Promote renewable energy<br />
technologies that are energy<br />
efficient<br />
• Ensure equitable access to<br />
natural resources by all<br />
• Develop policies that<br />
alleviate violence and sexual<br />
abuse against women<br />
• Improve access to efficient<br />
energy technologies<br />
• Improve air quality and limit<br />
exposure to toxic chemicals<br />
• Improve access to efficient<br />
energy technologies<br />
• Improve air quality and limit<br />
exposure to toxic chemicals
MDG Performance How vulnerability<br />
affects achieving MDGs<br />
6. Combat major diseases • According to the 2004-<br />
05 <strong>Uganda</strong> HIV/AIDS Sero<br />
Behavioral Survey (UHSBS),<br />
6.4% <strong>of</strong> adult population in<br />
<strong>Uganda</strong> are infected with HIV<br />
7. Ensure environmental<br />
sustainability<br />
Source: NEMA 2008<br />
• Overall, there has been<br />
a declining trend <strong>of</strong> HIV<br />
infection from a peak <strong>of</strong> 18%<br />
in 1992 to the current figure<br />
• Malaria accounts for 52%<br />
<strong>of</strong> outpatient department<br />
attendance, and 30% <strong>of</strong><br />
in-patient admissions. The<br />
disease is responsible for<br />
9-14% <strong>of</strong> all in-patient deaths.<br />
However, the in-patient<br />
deaths for children under-five<br />
attributed to the disease are<br />
about double at 20-23%<br />
• There is an increase in<br />
water service coverage<br />
nationwide from a little over<br />
20% in 1991 to almost 68%<br />
in 2006. Equally, the <strong>Uganda</strong><br />
Population and Housing<br />
Census reports a rise in water<br />
service coverage from 26% in<br />
1991 to 68% in 2002<br />
• However, there is wide<br />
documentation on persistent<br />
degradation <strong>of</strong> the country’s<br />
natural resources, namely:<br />
declining soil fertility,<br />
deforestation, (particularly<br />
outside protected areas),<br />
pasture degradation,<br />
decreasing fish stocks and<br />
water pollution<br />
• Opportunistic diseases that<br />
are environment related e.g.<br />
diarrhea, cholera some times<br />
kill HIV patients prematurely<br />
• Prevalence <strong>of</strong> malaria and<br />
other major killer diseases<br />
have a correlation with poor<br />
hygiene and sanitation<br />
• Current trends in<br />
environmental degradation<br />
must be reversed in order<br />
to sustain the health and<br />
productivity <strong>of</strong> the country’s<br />
ecosystems<br />
• Stressed ecosystems<br />
cannot support economic<br />
development sustainably<br />
Strategies for reducing<br />
vulnerability to support<br />
achieving MDGs<br />
• Ensure robust hygiene and<br />
sanitation programmes at<br />
community and household<br />
levels<br />
• Reduce and mitigate<br />
climate variability and change.<br />
• Ensure effective<br />
implementation <strong>of</strong> the<br />
country’s environment policies<br />
• Rethinking and<br />
strengthening environmental<br />
governance<br />
• Strengthening the adaptive<br />
capacity to climate change<br />
MDG Facts<br />
31%<strong>of</strong> the <strong>Uganda</strong>n population lives below US$1.00 per person per day<br />
20.4% <strong>of</strong> <strong>Uganda</strong>n children go to bed hungry<br />
84% <strong>of</strong> <strong>Uganda</strong>n children are enrolled in primary school<br />
The average <strong>Uganda</strong>n woman spends 9 hours a day on care labor activities such as fetching water, firewood<br />
and caring for the sick.<br />
13.7% <strong>of</strong> children die before their fifth birthday<br />
7.6% <strong>of</strong> infants die before their first birthday<br />
For every 100,000 new mothers, 435 die while giving birth<br />
Only 41% <strong>of</strong> births are attended by skilled personnel<br />
6.4% <strong>of</strong> the <strong>Uganda</strong>n population is infected with HIV/AIDS<br />
67% <strong>of</strong> <strong>Uganda</strong>n households have access to safe water today<br />
159
MDG 7: Ensure <strong>Environment</strong>al Sustainability<br />
Access to safe drinking water<br />
MDG 7 on environmental<br />
sustainability aims among others<br />
at halving the proportion <strong>of</strong> people<br />
without sustainable access to safe<br />
drinking water by 2015.<br />
Water sources considered safe<br />
include piped water, boreholes,<br />
protected springs and gravity flow<br />
schemes.<br />
Sixty seven percent <strong>of</strong> all households<br />
in <strong>Uganda</strong> now have access to safe<br />
water sources.<br />
The challenge is sustainability <strong>of</strong><br />
these sources in view <strong>of</strong> increased<br />
degradation <strong>of</strong> water catchments<br />
and surface water sources.<br />
In urban areas the proportion <strong>of</strong><br />
people with access to safe water is<br />
87 percent while it is 64 percent in<br />
the rural areas.<br />
A man accesses unsafe drinking water from a pond in Migera, Nakasongola District<br />
160<br />
Percent<br />
Percent<br />
Access to safe drinking water<br />
Distance to safe drinking water for the regions<br />
Source: UBOS, UNHS 2005/6, 2002 <strong>Uganda</strong> Population and Housing Census Analytical Report<br />
NEMA 2003
Green House Gas Emissions<br />
Although <strong>Uganda</strong> is not a major contributor to the global GHGs emissions load, the impacts <strong>of</strong> global warming are<br />
already with us. The main source <strong>of</strong> green house gas emissions in <strong>Uganda</strong> is land use change and deforestation.<br />
Carbon Emissions (Tgy -1 )<br />
Source: Canadell et al 2009<br />
Africa<br />
Source: Canadell et al 2009<br />
161
The 2000–2005 growth rate in<br />
African fossil fuel emissions was<br />
3.2% per year (y −1 ) very close<br />
to the global average. Fossil fuel<br />
emissions per capita in Africa are<br />
among the lowest in the world,<br />
at 0.32 t per year (y −1 ) compared<br />
to the global average <strong>of</strong> 1.2 t per<br />
year (y −1 ). <strong>Uganda</strong> has the highest<br />
consumption rate for biomass<br />
energy in the East African region<br />
(93%). This has implications on GHG<br />
emissions and loss <strong>of</strong> forest cover.<br />
162<br />
Source: State <strong>of</strong> <strong>Environment</strong> Report for <strong>Uganda</strong> (2008)<br />
Bush burning in Nakasongola District, Central <strong>Uganda</strong><br />
Regional Emissions from LUC&F<br />
South & S.E Asia Tropical Africa S. and Central America<br />
Source: Canadell et al 2009<br />
NEMA 2006
<strong>Environment</strong>al Sustainability at Regional Level<br />
Source: NEMA 2008<br />
Kibaale<br />
DISTRICTS OF UGANDA<br />
i<br />
a<br />
Kaabong<br />
Nakapiripirit<br />
163
<strong>Uganda</strong> is divided into four regions namely;<br />
Central, Eastern, Western and Northern regions.<br />
These regions are further divided into 83 districts<br />
spread across the country. The Central Region covers<br />
an area <strong>of</strong> approximately 61,403 km 2 and the major<br />
principal towns are Kampala, Kira, Nansana, Masaka and<br />
Entebbe. The eastern region <strong>of</strong> <strong>Uganda</strong> covers an area <strong>of</strong><br />
approximately 39,479 km 2 and the major towns are Jinja<br />
and Mbale. The region is renowned for its agricultural<br />
activities that thrive on the fertile soils, abundant<br />
water and rainfall. The area is also famous for its sugar<br />
plantations, breweries and is a major tourist attraction<br />
as it is the source <strong>of</strong> the river Nile. The western region <strong>of</strong><br />
<strong>Uganda</strong> covers an area <strong>of</strong> 55,277 km 2 and the major town<br />
in the area is Mbarara.<br />
164<br />
Ethnic groups <strong>of</strong> <strong>Uganda</strong><br />
Source:<strong>Uganda</strong> at a glance (2007)<br />
The district <strong>of</strong> Mbarara is located 266 km from Kampala<br />
and was part <strong>of</strong> the traditional Ankole Kingdom.<br />
The region is rich in mineral resources, wildlife and<br />
currently undergoing a major transformation with<br />
the on-going oil exploration and developments in<br />
the Albertine Graben. The area is a prime tourist<br />
destination and boasts <strong>of</strong> national parks, breathtaking<br />
mountain terrains and rainforests that are home to the<br />
mountain gorilla. The Northern region <strong>of</strong> <strong>Uganda</strong> covers<br />
an area <strong>of</strong> approximately 85,392 km 2 and the principle<br />
towns are Gulu and Lira. Gulu is the commercial center<br />
<strong>of</strong> the region located 332 km from the capital city<br />
Kampala. The major economic activity in the region is<br />
agriculture and the majority <strong>of</strong> the people are engaged<br />
in farming.<br />
John Gibbons: <strong>Uganda</strong> At A Glance 2002
Population growth<br />
Population size (million) and Population growth rate (%)<br />
Projected population<br />
Region 1991 Census 1996 (a) 1998 (a) 2000 (a) 2015<br />
Central 4,843,594 5,627,800 5,906,500 6,185,400 8,438,400<br />
Eastern 4,128,469 4,983,100 5,307,300 5,631,600 8,547,400<br />
Northern 3,151,955 3,763,600 3,992,200 4,220,700 6,230,100<br />
Western 4,547,705 5,473,100 5,823,000 6,172,600 9,300,700<br />
<strong>Uganda</strong> 16,671,705 19,847,600 21,029,000 22,210,300 32,516,600<br />
Source : MFPED: Statistical Abstract, (1998)<br />
NEMA (1998): State <strong>of</strong> <strong>Environment</strong> Report for <strong>Uganda</strong> (1998)<br />
Population growth rate<br />
1948 1959 1969 1980 1991 2002 2008<br />
Population (m)<br />
Source: NEMA (2008) SOER<br />
Population growth rate (%)<br />
The total population <strong>of</strong> <strong>Uganda</strong> has increased from 4.8<br />
million in 1948 to 29.6 in July 2008, and is likely to reach<br />
103.2 million by 2050 (MFPED 2007, UBOS 2008). The<br />
population growth rate is one <strong>of</strong> the highest in the world,<br />
at 3.2 per cent. This is significant as there are six times<br />
as many people trying to survive on the same amount <strong>of</strong><br />
natural resources as there were 60 years ago. Already, the<br />
government has been unable to keep up with demands<br />
Population size (million) and Population growth rate (%)<br />
Population growth by region<br />
Central Eastern Northern Western <strong>Uganda</strong><br />
Region<br />
Population (m) Population growth rate (%)<br />
on infrastructure such as land, roads, with water supply,<br />
energy grids, the built environment, and services such<br />
as education and health. The result is that the pressures<br />
on rural lands, forests, water and biological resources is<br />
increasing dramatically to meet the needs <strong>of</strong> the growing<br />
population. There are regional differences in population<br />
growth.<br />
165
Literacy rate<br />
Literacy rates as a measure <strong>of</strong> social<br />
performance indicate that the central<br />
region is doing much better than<br />
the other regions <strong>of</strong> the country.<br />
Opportunities for employment,<br />
better education and health care<br />
in the region have encouraged in<br />
migration contributing to the growing<br />
human population in the region.<br />
This growth in numbers is putting<br />
immense pressure on the environment<br />
to provide resources for the growing<br />
population.<br />
Literacy rate<br />
Region Male Female Average<br />
Central 18.8 24.8 21.9<br />
Eastern 9.6 15.9 12.8<br />
Northern 33.8 37.1 35.5<br />
Western 11.5 13.2 12.4<br />
<strong>Uganda</strong> 21.9 17.9 19.7<br />
Source: UBOS Survey 2008<br />
166<br />
Literacy rates for the population aged 10 and above<br />
Literacy rate (%)<br />
Central Eastern Northern Western <strong>Uganda</strong><br />
Source: UBOS-UNHS 2005/06<br />
Region<br />
1999/2000 2002/2003 2005/2006<br />
Region 1999/2000 2002/2003 2005/2006<br />
Central 77 79 80<br />
Eastern 62 63 64<br />
Northern 47 56 59<br />
Western 67 74 67<br />
<strong>Uganda</strong> 65 70 69<br />
Source: UBOS-UNHS 2005/06<br />
Pupils <strong>of</strong> Jjanyi Primary School in Wakiso District. NEMA visited the rural UPE (Universal<br />
Primary Education) school during the Schools ESD (Education for Sustainable Development)<br />
planning activities in February 2009.<br />
NEMA 2009
Rural migration<br />
Regional variations in 2005/06 show<br />
that the Northern region had the<br />
highest proportion <strong>of</strong> individuals<br />
migrating with 36 per cent as compared<br />
to the other regions, the major reason<br />
being insecurity. However, with the<br />
prevailing peace this trend is likely<br />
to change. Other reasons cited for<br />
migration is drought, eviction and<br />
disease.<br />
Population size (million) and Population growth rate (%)<br />
30<br />
25<br />
20<br />
15<br />
10<br />
5<br />
0<br />
Migration(%)<br />
Rural migration per region<br />
Central Eastern Northern Western <strong>Uganda</strong><br />
Source: UBOS-UNHS 2005/06<br />
Region<br />
Region Population (millions) Population growth rate<br />
Central 6.6 2.6<br />
Eastern 6.2 3.5<br />
Northern 5.3 4.6<br />
Western 6.3 2.8<br />
<strong>Uganda</strong> 24.2 3.2<br />
Source: 2002 Population and Housing Census Report<br />
Central Eastern Northern Western <strong>Uganda</strong><br />
Region<br />
Population (m) Population growth rate (%)<br />
167
Tourism and the <strong>Environment</strong><br />
<strong>Uganda</strong>’s tourism directly depends<br />
on the country’s environment and<br />
natural resource base.<br />
Conservation <strong>of</strong> this natural<br />
resource base is critical to<br />
supporting tourism and its<br />
contribution to sustainable<br />
development.<br />
168<br />
Cost <strong>of</strong> environmental degaradation Ushs<br />
billions/year<br />
Tourist Arrivals (000)<br />
Tourist Arrivals 2003-2007<br />
Year<br />
Source: NEMA (2008) in press<br />
Source: Moyini and Muramira (2001)<br />
Biodiversity loss 506<br />
Degradation <strong>of</strong> soil resources 225<br />
Rangeland degradation 815<br />
Wetlands enchroachment 2<br />
Water hyacith pollution 870<br />
Contamination <strong>of</strong> water systems 38.61<br />
Year Total arrivals (000)<br />
2003 586<br />
2004 738<br />
2005 662<br />
2006 770<br />
2007 883<br />
Cost <strong>of</strong> environmental degradation and loss to <strong>Uganda</strong>’s economy<br />
Biodiversity Degradation <strong>of</strong> Rangeland Wetlands Water hyacinth Contamination<br />
loss soil resources degradation encroachment pollution <strong>of</strong> water systems<br />
Ushs billions/year
Science and technology<br />
Makerere University Faculty <strong>of</strong> Technology<br />
A portable telephone in <strong>Uganda</strong>.<br />
Source: Africa <strong>Atlas</strong> <strong>of</strong> <strong>Our</strong> <strong>Changing</strong><br />
<strong>Environment</strong> (2008)<br />
©Paul Mayhill<br />
©Paul Mayhill<br />
Telephone, internet subscribers and talk time<br />
Telephone and internet subscribers from 2003 - 2007<br />
Year 2003 2004 2005 2006 2007<br />
Subscribers 985828 1111692 1625902 2827479 5329202<br />
Fixed phone 65793 82495 100777 129863 165788<br />
Cellular phone 777563 1165035 1525125 2697616 5163414<br />
Internet 6500 7024 8000 9500 15000<br />
Telephone talk (million minutes) 1308 1559 1724 2307 3005<br />
Internet users 233675 252513 287600 1000000 1600000<br />
Source: NEMA, National State <strong>of</strong> <strong>Environment</strong> Report for <strong>Uganda</strong> 2008 (in Press)<br />
Some <strong>of</strong> the Telephone and Internet companies in <strong>Uganda</strong> (2009)<br />
everywhere you go<br />
169
Land use and land cover<br />
Over 36 percent <strong>of</strong> <strong>Uganda</strong>’s surface is<br />
under small scale farming. From 1990<br />
to 2005 land for small scale farming<br />
increased meaning that land originally for<br />
other use is now being cultivated.<br />
Per Capita Forest<br />
Per capita forest has been reducing and<br />
the trend is expected to continue if<br />
nothing is done to halt the situation.<br />
Reduction is attributed to deforestation<br />
and increasing population pressure.<br />
Vegetation cover per region<br />
The northern region has the highest<br />
woodland; the eastern is almost bare.<br />
170<br />
Per Capita forest (Ha)<br />
Per Capita (Ha)<br />
40.0<br />
35.0<br />
30.0<br />
25.0<br />
20.0<br />
15.0<br />
10.0<br />
5.0<br />
-<br />
(5.0)<br />
(10.0)<br />
0.4<br />
0.3<br />
0.2<br />
0.1<br />
0.0<br />
20.0<br />
15.0<br />
10.0<br />
5.0<br />
0.0<br />
Broad leaved<br />
<strong>Uganda</strong>’s Land use and land cover, percentage<br />
<strong>Uganda</strong>s' Land Use and Land Cover, Percentage<br />
Conifer<br />
THF well stocked<br />
THF low stocked<br />
Source: NFA 2008<br />
Wood land<br />
Bush<br />
Grassland<br />
2005 1990 Difference<br />
Wetland<br />
Per Capita (Forest Per Area) Capita (Forest Area)<br />
Small scale farmland<br />
Large scale farmland<br />
Built up area<br />
Open Water<br />
1991 1995 2000 2005 2010 2015 2020 2025<br />
Source: NFA 2008<br />
Years<br />
Proportion <strong>of</strong> Vegetation Cover (%), 2005<br />
Proportion <strong>of</strong> vegetation Cover (%), 2005<br />
Imped-iments<br />
Central Eastern Northern Western <strong>Uganda</strong><br />
Broad leaved Conifer THF w ell stocked THF low stocked Wood land<br />
Source: NFA 2008
Forest Loss<br />
Although deforestation has been more or<br />
less controlled in the Protected Area (PA)<br />
estate, most <strong>of</strong> <strong>Uganda</strong>’s forests occur<br />
on land outside protected areas. The<br />
deforestation is rapid, spelling intense<br />
future pressure on the protected area<br />
Ibanda bare hills<br />
Restoration <strong>of</strong> bare hills in Mbarara District, 2005 by NEMA<br />
support to District micro projects<br />
NEMA 2006<br />
NEMA 2005<br />
6,000,000<br />
5,000,000<br />
4,000,000<br />
3,000,000<br />
2,000,000<br />
1,000,000<br />
Area (million hectares<br />
Consumption <strong>of</strong> wood (%)<br />
-<br />
-<br />
Forest loss (Hectares) Forest Loss (Hectares)<br />
1990 2005<br />
Total all forests in PA Total all forests in Country<br />
Source: NFA 2008 Note: PA refers to Protected Areas<br />
Forest Reduction<br />
Forests (outside protected Forests (in protected areas) Total forest in the country<br />
areas)<br />
Source: NFA 2008<br />
Forest consumption<br />
Household firewood Charcoal Commercial Poles and timber<br />
and industry<br />
Source: NFA 2008<br />
171
Forest Reserves Central Forest Reserves<br />
Mabira Central Forest Reserve<br />
Budongo Central Forest Reserve<br />
Below: NEMA staff and District <strong>Environment</strong> Officers plant trees on<br />
Nabyewanga Hill, Masaka District during their annual meeting (2007)<br />
172<br />
NEMA 2008<br />
Grace Nangendo 2008<br />
NEMA 2007<br />
Area (Ha)<br />
Area (Ha)<br />
Area (Ha)<br />
Central Eastern Northern Western <strong>Uganda</strong><br />
Local Forest Reserves<br />
Region<br />
Central Eastern Northern Western <strong>Uganda</strong><br />
Total Forest Reserves<br />
Region<br />
Central Eastern Northern Western <strong>Uganda</strong><br />
Region
Forests by District (Tropical High<br />
Forests and Plantations)<br />
From the central region, the districts <strong>of</strong><br />
Nakaseke, Luwero, Lyantonde, Kampala<br />
and Sembabule have percentages below 0.5<br />
percent <strong>of</strong> forest cover to the district land<br />
Nakaseke is the most affected with almost<br />
no parts <strong>of</strong> the district covered with forests.<br />
Mpigi had the largest coverage <strong>of</strong> about 7.5<br />
percent <strong>of</strong> the district covered with forests.<br />
From the eastern region, except for Bududa,<br />
Bukwo, Jinja, Kapchorwa, Manafwa Mayuge,<br />
Mbale, and Sironko the rest <strong>of</strong> the districts<br />
had forest coverage below 0.5 percent <strong>of</strong><br />
the district land.<br />
Bududa and Bukwo had the highest<br />
coverage with 34.0 and 34.3 percent <strong>of</strong><br />
their respective district land covered with<br />
forests.<br />
In the northern region, only Adjumani,<br />
Amuru, Gulu, Nebbi and Nyadri had the<br />
districts forest coverage above 0.5 percent.<br />
Although Amuru had the largest coverage <strong>of</strong><br />
forest it was only 3.3 percent.<br />
From western region, only Isingiro, Kiruhura<br />
9.0<br />
6.0<br />
3.0<br />
-<br />
KALANGALA<br />
40.0<br />
30.0<br />
20.0<br />
10.0<br />
4.0<br />
3.0<br />
2.0<br />
1.0<br />
0.0<br />
0.0<br />
Forest cover for the districts in the Central region<br />
2.3<br />
KAMPALA<br />
0.2<br />
KAYUNGA<br />
0.5<br />
KIBOGA<br />
1.3<br />
LUWEERO<br />
Source: NFA 2008<br />
0.1 -<br />
LYANTONDE<br />
MASAKA<br />
Forests % <strong>of</strong> District<br />
Forest cover for the districts in the Eastern region<br />
- 0.2<br />
AMURIA<br />
BUDAKA<br />
-<br />
34.0<br />
BUDUDA<br />
BUGIRI<br />
0.3 -<br />
34.3<br />
Source: NFA 2008<br />
0.1 - -<br />
Forest cover for the districts in the Northern region<br />
0.9<br />
-<br />
3.3<br />
0.0<br />
0.4<br />
Source: NFA 2008<br />
Forests % <strong>of</strong> District<br />
3.9<br />
MITYANA<br />
BUKEDEA<br />
BUKWO<br />
BUSIA<br />
BUTALEJA<br />
IGANGA<br />
JINJA<br />
KABERAMAIDO<br />
2.9<br />
7.5<br />
MPIGI<br />
Forests % <strong>of</strong> District<br />
0.2<br />
0.6<br />
Forests % <strong>of</strong> District<br />
1.4 - - 0.0<br />
KALIRO<br />
KAMULI<br />
Forests % <strong>of</strong> District<br />
Forests % <strong>of</strong> District<br />
0.9<br />
MUBENDE<br />
13.5<br />
5.1<br />
MUKONO<br />
- -<br />
KAPCHORWA<br />
KATAKWI<br />
KUMI<br />
NAKASEKE<br />
0.0<br />
NAKASONGOLA<br />
17.2<br />
0.6<br />
0.7<br />
3.4<br />
MANAFWA<br />
MAYUGE<br />
MBALE<br />
- 0.0 0.0 - 0.0 - 0.0 -<br />
0.7<br />
RAKAI<br />
4.5<br />
-<br />
SEMBABULE<br />
- 0.0<br />
10.6<br />
WAKISO<br />
1.6<br />
0.1 0.1<br />
NAMUTUMBA<br />
PALLISA<br />
SIRONKO<br />
SOROTI<br />
TORORO<br />
0.6<br />
0.2<br />
0.0 -<br />
ABIM<br />
ADJUMANI<br />
AMOLATAR<br />
AMURU<br />
APAC<br />
ARUA<br />
DOKOLO<br />
GULU<br />
KAABONG<br />
KITGUM<br />
KOBOKO<br />
KOTIDO<br />
LIRA<br />
MOROTO<br />
MOYO<br />
NAKAPIRIPIRIT<br />
NEBBI<br />
NYADRI<br />
OYAM<br />
PADER<br />
YUMBE<br />
173
and Ntungamo had the percentage <strong>of</strong> forests<br />
<strong>of</strong> their districts less than 0.5.<br />
Kabarole and Kyenjojo had the largest<br />
percentage <strong>of</strong> their districts covered with<br />
forests at 22 and 21 percent respectively.<br />
Woodland and forest area as<br />
Percentage <strong>of</strong> Total district area<br />
Nakaseke had the highest percentage (39.7<br />
percent) <strong>of</strong> combined forest and woodland<br />
cover as a percentage <strong>of</strong> District land cover<br />
while Lyantonde had the lowest <strong>of</strong> 0.1<br />
percent in the Central region.<br />
Bukwo had the highest percentage <strong>of</strong><br />
combined forest woodlands for eastern<br />
region.<br />
174<br />
25.0<br />
20.0<br />
15.0<br />
10.0<br />
5.0<br />
0.0<br />
50.0<br />
40.0<br />
30.0<br />
20.0<br />
10.0<br />
0.0<br />
BULIISA<br />
KALANGALA<br />
40.0<br />
30.0<br />
20.0<br />
10.0<br />
-<br />
8.5<br />
20.2<br />
BUNDIBUGYO<br />
17.5<br />
BUSHENYI<br />
3.1 2.7<br />
KAMPALA<br />
1.2 0.2<br />
Forest cover for the districts in the Western region<br />
HOIMA<br />
16.3<br />
10.2<br />
IBANDA<br />
4.2<br />
20.2<br />
0.1<br />
ISINGIRO<br />
Source: NFA 2008<br />
KAYUNGA<br />
34.3<br />
KIBOGA<br />
1.0 0.1<br />
LUWEERO<br />
34.8<br />
10.3<br />
KABALE<br />
4.8<br />
KABAROLE<br />
Forests % <strong>of</strong> District<br />
22.6<br />
11.0<br />
KAMWENGE<br />
KANUNGU<br />
16.2<br />
KASESE<br />
14.7<br />
KIBAALE<br />
13.2<br />
Forests & Woodlands % <strong>of</strong> District<br />
0.1<br />
LYANTONDE<br />
MASAKA<br />
6.8<br />
MITYANA<br />
10.0<br />
12.1<br />
MPIGI<br />
MUBENDE<br />
AMURIA<br />
BUDAKA<br />
BUDUDA<br />
BUGIRI<br />
BUKEDEA<br />
BUKWO<br />
BUSIA<br />
BUTALEJA<br />
IGANGA<br />
JINJA<br />
KABERAMAIDO<br />
KALIRO<br />
KAMULI<br />
KAPCHORWA<br />
KATAKWI<br />
KUMI<br />
MANAFWA<br />
MAYUGE<br />
MBALE<br />
NAMUTUMBA<br />
PALLISA<br />
SIRONKO<br />
SOROTI<br />
TORORO<br />
Forests & Woodlands % <strong>of</strong> District<br />
5.4<br />
1.8 1.5<br />
0.0 0.0 -<br />
1.4<br />
18.1<br />
0.0<br />
KIRUHURA<br />
KISORO<br />
7.8 7.6<br />
MUKONO<br />
2.6 0.4<br />
10.0<br />
KYENJOJO<br />
NAKASEKE<br />
17.5<br />
39.7<br />
21.2<br />
MASINDI<br />
NAKASONGOLA<br />
2.1<br />
6.6<br />
4.2<br />
18.7<br />
MBARARA<br />
RAKAI<br />
- 0.1<br />
1.0 0.4<br />
NTUNGAMO<br />
6.9<br />
12.4<br />
RUKUNGIRI<br />
Woodland and forest cover as a % <strong>of</strong> the total area in a district for the<br />
Central region<br />
Source: NFA 2008<br />
Forests % <strong>of</strong> District<br />
Forests and Woodlands % <strong>of</strong> District<br />
2.4<br />
SEMBABULE<br />
12.3<br />
WAKISO<br />
Woodland and forest cover as a % <strong>of</strong> the total area in a district for the<br />
Eastern region<br />
Source: NFA 2008<br />
Forests and Woodlands % <strong>of</strong> District<br />
0.6 0.5<br />
7.5
Fisheries<br />
There is a general steady increase in<br />
fish catch in <strong>Uganda</strong>. The estimated<br />
fish catch increased from 249.0 tons<br />
in 2004 to 721.0 tons in 2006. Most <strong>of</strong><br />
the catch is however processed for<br />
export, leaving very little fish on the<br />
local market. Fish prices have skyrocketed,<br />
yet fish previously provided<br />
for a cheap and easily accessible<br />
source <strong>of</strong> animal protein for the poor.<br />
60.0<br />
50.0<br />
40.0<br />
30.0<br />
20.0<br />
10.0<br />
-<br />
50.0<br />
40.0<br />
30.0<br />
20.0<br />
10.0<br />
-<br />
ABIM<br />
31.7<br />
BULIISA<br />
800<br />
600<br />
400<br />
200<br />
0<br />
49.1<br />
ADJUMANI<br />
9.6<br />
AMOLATAR<br />
33.2<br />
BUNDIBUGYO<br />
Woodland and forest cover as a % <strong>of</strong> the total area in a district for the<br />
Northern region<br />
3.2<br />
AMURU<br />
36.5<br />
APAC<br />
6.0<br />
ARUA<br />
20.2<br />
Source: NFA 2008<br />
23.5<br />
BUSHENYI<br />
HOIMA<br />
17.0<br />
Forests and Woodlands % <strong>of</strong> District<br />
DOKOLO<br />
0.5<br />
Forests & Woodlands % <strong>of</strong> District<br />
GULU<br />
35.0<br />
KAABONG<br />
8.5<br />
18.5<br />
KITGUM<br />
KOBOKO<br />
10.9<br />
KOTIDO<br />
7.6<br />
LIRA<br />
3.7<br />
16.2<br />
Forests and Forests Woodlands & Woodlands % <strong>of</strong> District<br />
IBANDA<br />
11.1<br />
0.3<br />
ISINGIRO<br />
KABALE<br />
6.3<br />
KABAROLE<br />
31.3<br />
KAMWENGE<br />
21.8 19.6<br />
KANUNGU<br />
KASESE<br />
23.4 23.1<br />
KIBAALE<br />
9.9<br />
KIRUHURA<br />
25.8<br />
16.0<br />
KISORO<br />
14.7<br />
9.6<br />
6.7<br />
2.1<br />
24.2 27.2<br />
MOROTO<br />
MOYO<br />
NAKAPIRIPIRIT<br />
NEBBI<br />
NYADRI<br />
OYAM<br />
PADER<br />
YUMBE<br />
Woodland and forest cover as a % <strong>of</strong> the total area in a district for the<br />
Western region<br />
Source: NFA 2008<br />
Fish Catches (tons) in <strong>Uganda</strong><br />
Fish Catches (tons) in <strong>Uganda</strong><br />
KYENJOJO<br />
35.1<br />
45.2<br />
MASINDI<br />
MBARARA<br />
2.5 1.5<br />
NTUNGAMO<br />
16.9<br />
RUKUNGIRI<br />
1990 1991 1992 1993 1994 1995 1996 1997 1998 1999 2000 2001 2002 2003 2004* 2005* 2006*<br />
Source: Fisheries Department 2008<br />
175
Latrine Coverage<br />
The use <strong>of</strong> proper toilet facilities is<br />
important in ensuring hygiene and<br />
preventing hygiene related diseases.<br />
In 2005,10.6 percent <strong>of</strong> the households did<br />
not have toilet facilities and used bushes.<br />
About 86 percent <strong>of</strong> households used<br />
a pit latrine and only 3 percent used a<br />
Ventilated Pit-Latrine (VIP).The proportion<br />
<strong>of</strong> households without any toilet facilities<br />
is higher in rural areas than urban areas.<br />
The overall proportion <strong>of</strong> people without<br />
toilet facilities however, decreased from<br />
16.2 percent (2002 <strong>Uganda</strong> Population and<br />
Housing Census, Analytical Report) in 2002<br />
to 10.6 percent in 2005/6 (UNHS 2005/6)<br />
The northern and eastern parts <strong>of</strong> the<br />
country had the largest proportions<br />
<strong>of</strong> households without toilet facilities<br />
with proportions <strong>of</strong> 21 and 16 percent<br />
respectively.<br />
A VIP latrine<br />
176<br />
Latrine in a surbub wetland<br />
NEMA 2008<br />
Percent<br />
Percent<br />
Percent<br />
Distribution <strong>of</strong> Household with Toilet Facility by Residence (2002)<br />
Source: UBOS, UNHS 2005/6<br />
Distribution <strong>of</strong> Household with Toilet Facility by Residence (2005)<br />
Source: UBOS, UNHS 2005/6<br />
Distribution households by Type <strong>of</strong> Toilet Facility by Region<br />
Source: UBOS, UNHS 2005/6
A tadooba<br />
Access to Energy<br />
The energy and technology types used for<br />
cooking and lighting have an impact on<br />
the health and safety <strong>of</strong> households.<br />
In 2005/6, 11 percent <strong>of</strong> households used<br />
electricity as the main source <strong>of</strong> lighting.<br />
71 percent <strong>of</strong> households used tadooba<br />
(kerosene candle - see picture on left).<br />
The large proportion <strong>of</strong> people using<br />
tadooba indicates the size <strong>of</strong> the problem<br />
<strong>of</strong> indoor smoke pollution in <strong>Uganda</strong>.<br />
14 percent used kerosene lanterns.<br />
Construction <strong>of</strong> Nyagak Hydro electric power plant<br />
Solar energy: phone, battery and lantern charging at<br />
Wobutungulu by Joint Energy and <strong>Environment</strong> Projects (JEEP)<br />
Ferrying firewood for domestic use<br />
NEMA 2008<br />
JEEP 2008<br />
Percent<br />
Percent<br />
Percent<br />
Percent<br />
Distribution <strong>of</strong> Households by Lighting Fuel and Residence, (%)<br />
Source: UBOS, UNHS 2005/6<br />
Distribution <strong>of</strong> Households by Lighting Energy and Region, (%)<br />
Source: UBOS, UNHS 2005/6<br />
Distribution <strong>of</strong> Households by Lighting Energy and Source, (%)<br />
Source: UBOS, UNHS 2005/6<br />
NEMA 2008<br />
Community training in construction <strong>of</strong> a Lorena fuel<br />
saving stove, Arua District<br />
177<br />
NEMA 2008
Energy for cooking in 2005-2006<br />
Overall, 96 percent <strong>of</strong> the households in <strong>Uganda</strong><br />
depend on wood fuel for cooking purposes.<br />
This is a challenge to achieving the MDG targets<br />
and promotion <strong>of</strong> environment sustainability.<br />
Less than 1 percent use electricity as the main<br />
source <strong>of</strong> energy for cooking.<br />
Roadside charcoal business along<br />
Arua-Pakwach highway, Arua District<br />
Biomass use<br />
Region Biomass % Modern %<br />
<strong>Uganda</strong> 93 7<br />
Kenya 70 30<br />
Rwanda 90 10<br />
Tanzania 90 10<br />
Source: NEMA (2007). Pilot Integrated Ecosystem Assessment. National<br />
<strong>Environment</strong> Management Authority and UNEP, Kampala, <strong>Uganda</strong><br />
Odiipio Edward A. 2008<br />
Pupils display charcoal briquettes during exhibitions to mark World <strong>Environment</strong><br />
Day 2008 celebrations held at Bombo Commom Primary School, Luwero District.<br />
The celebrations were organised by ACEPA, a local NGO in Luwero District.<br />
178<br />
A cook charcoal stove (sigiri),<br />
commonly used in urban<br />
households<br />
NEMA 2008<br />
Percent<br />
Percent<br />
Percent<br />
Energy for cooking in <strong>Uganda</strong><br />
Source: UBOS, UNHS 2005/6<br />
Energy for cooking 2002-2005<br />
Source: UBOS, UNHS 2005/6<br />
Energy for cooking 2005-2006<br />
Source: UBOS, UNHS 2005/6
Per capita arable land by region<br />
Central region<br />
Lyantonde has the largest Per capita arable land<br />
<strong>of</strong> about 4.6 acres while Kampala, Wakiso, and<br />
Mukono are among the districts with the lowest<br />
per capita potential arable land.<br />
Eastern region<br />
Kaberamaido, Katakwi and Amuria have the<br />
largest per capita arable land <strong>of</strong> about 1.0,<br />
0.9 and 0.8 acres respectively while Bukwo,<br />
Kapchorwa, Jinja and Mbale were among the<br />
districts with lowest per capita <strong>of</strong> below 0.3 acres.<br />
Western region<br />
Kiruhura has the largest per capita arable land <strong>of</strong><br />
about 2.2; Hoima, Bulisa, Kibaale and Kyenjojo<br />
had per capita Arable land <strong>of</strong> about 0.3, 0.4 and<br />
0.4 acres respectively.<br />
Northern region<br />
Kitgum, Amuru and Pader have the largest per<br />
capits arable land <strong>of</strong> about 3.6, 3.5 and 2.4 acres;<br />
Abim, Kaabong, Kotido, Moroto and Nakapiripirit<br />
had almost no per capita arable land <strong>of</strong> all.<br />
1.2<br />
1.0<br />
0.8<br />
0.6<br />
0.4<br />
0.2<br />
-<br />
0.8<br />
0.3<br />
0.2<br />
0.3<br />
0.7<br />
0.0<br />
Wakiso<br />
Sembabule<br />
Rakai<br />
Nakasongola<br />
Nakaseke<br />
Nakaseke<br />
Mukono<br />
Mukono<br />
Mubende<br />
Mpigi<br />
Mityana Mityana<br />
Masaka<br />
Lyantonde<br />
Amuria<br />
Budaka<br />
Bududa<br />
Bugiri<br />
Bukedea<br />
Bukwo<br />
Busia<br />
Butaleja<br />
Iganga<br />
Jinja<br />
Kaberamaido<br />
Kaliro<br />
Kamuli<br />
Kapchorwa<br />
Katakwi<br />
Kumi<br />
Manafwa<br />
Mayuge<br />
Mbale<br />
Namutumba<br />
Pallisa<br />
Sironko<br />
Soroti<br />
Tororo<br />
4.0<br />
3.0<br />
2.0<br />
1.0<br />
-<br />
Abim<br />
0.0<br />
Adjumani<br />
0.6<br />
Amolatar<br />
1.1<br />
Amuru<br />
3.5<br />
Apac<br />
1.0<br />
Arua<br />
LuwLuwero eero<br />
Kiboga<br />
Kiboga<br />
Kayunga<br />
Kampala<br />
Kalangala<br />
Per Capita Potential Arable Land (Acres)<br />
Per Capita Potential Arable land (Acres)<br />
0.0<br />
0.3<br />
0.2<br />
0.2<br />
0.4<br />
0.6<br />
Per Capita Potential Arable land (Acres)<br />
Per Capita Potential Arable Land (Acres)<br />
0.3<br />
0.4<br />
0.3<br />
0.2<br />
1.0<br />
0.4<br />
0.5<br />
0.8<br />
1.0<br />
1.2<br />
1.1<br />
1.4<br />
1.5<br />
1.7<br />
2.0<br />
- 1.0 10 20 2.0 30 3.0 40 4.0 50 5.0<br />
0.0<br />
0.9<br />
0.6<br />
Per Capita Per Potential Capita Potential Arable Land land (Acres) (Acres)<br />
0.9 0.8<br />
Dokolo<br />
Gulu<br />
1.4<br />
Kaabong<br />
0.0<br />
Kitgum<br />
3.6<br />
Koboko<br />
0.5<br />
Kotido<br />
0.0<br />
Lira<br />
1.0<br />
Moroto<br />
0.0<br />
Moyo<br />
0.2 0.3<br />
0.4<br />
Nakapiripirit<br />
0.0<br />
Nebbi<br />
0.2<br />
0.8<br />
0.5<br />
Nyadri<br />
0.7<br />
0.3 0.4<br />
Oyam<br />
0.9<br />
2.8<br />
Pader<br />
2.4<br />
0.7<br />
Yumbe<br />
0.8<br />
0.3<br />
1.1<br />
4.6<br />
179
Arable land<br />
Almost all <strong>Uganda</strong>’s land is arable; excluding wetlands,<br />
impediments, protected areas, and open water sources.<br />
The northern region has the largest per capita potential<br />
arable land <strong>of</strong> 1.5 acres while the East has the smallest<br />
per capita arable land <strong>of</strong> about 0.6 acres.<br />
Potential per capita arable land is likely to reduce with<br />
time if the population keeps increasing.<br />
2.5<br />
2.0<br />
1.5<br />
1.0<br />
0.5<br />
-<br />
Buliisa<br />
1.1<br />
Per Capita Potential Arable land<br />
Bundibugyo<br />
0.4<br />
Bushenyi<br />
0.5<br />
1.8<br />
1.6 1.6<br />
1.4 1.4<br />
1.2 1.2<br />
1.0<br />
0.8<br />
0.6<br />
0.4<br />
0.2<br />
0.2<br />
0.0<br />
Hoima<br />
1.1<br />
Ibanda<br />
0.6<br />
Isingiro<br />
0.9<br />
1.0<br />
Kabale<br />
Per Capita Potential Arable Land<br />
0.5 0.5<br />
Kabarole<br />
Kamwenge<br />
0.9<br />
Kanungu<br />
0.6<br />
Kasese<br />
0.3<br />
Kibaale<br />
1.1<br />
Kiruhura<br />
2.2<br />
Kisoro<br />
0.4<br />
Kyenjojo<br />
1.1<br />
Masindi<br />
Per Per Capita Potential Arable land Land by by Region Region (Acres) (Acres)<br />
0.6<br />
1.5<br />
1.0<br />
Mbarara<br />
0.6<br />
Ntungamo<br />
Central Eastern Northern Western<br />
Central Eastern Northern Western<br />
1.1<br />
0.7<br />
Rukungiri<br />
0.5
Key findings and recommendations<br />
Chapter 5<br />
K e y f i n d i n g s a n d r e c o m m e n d a t i o n s<br />
Key findings<br />
1. Mabira and Budongo forest reserves have shown recovery over the last 30 years. This is due to<br />
increased enforcement by the responsible institutions.<br />
2. The melting <strong>of</strong> ice on the Rwenzori Mountains due to global warming has caused increased water flow<br />
in the Semliki eroding its banks and silting the Lake Albert.<br />
3. The loss <strong>of</strong> woody biomass in Nakaseke and Nakasongola is alarming and undermines <strong>Uganda</strong>’s<br />
development path.<br />
4. The consumption <strong>of</strong> forest and woody biomass resources in both natural and planted forest is<br />
unsustainable.<br />
5. Although there is increase in agricultural areas in the Karamoja region the problem <strong>of</strong> food insecurity<br />
will persist because <strong>of</strong> lack <strong>of</strong> water.<br />
6. Siltation from the river Kagera is a threat to Lake Victoria and needs immediate action.<br />
7. Building in water ways <strong>of</strong> Nsooba - Lubigi and Nakivubo channels in Kampala City is the main cause<br />
<strong>of</strong> flooding in the low lying areas. The situation is bound to become worse as the weather patterns are<br />
changing due to climate change and variability.<br />
8. Expansion <strong>of</strong> Kampala City and reduction in green belts has increased the hard surface (built-up area)<br />
leading to increased run<strong>of</strong>f and silting Lake Victoria through Nakivubo channel.<br />
9. Degradation <strong>of</strong> wetlands especially in the mountainous areas <strong>of</strong> Kabale and Kisoro will have far<br />
reaching impacts on the food security <strong>of</strong> these areas. These wetlands have a positive influence on the<br />
local weather even during droughts and should be restored if prosperity is to be achieved.<br />
10. The flooding <strong>of</strong> the Teso region in 2007 occurred in areas mapped as seasonal wetlands which have<br />
been degraded due to overgrazing. Settlements should not be allowed in these zones.<br />
11. Encroachment <strong>of</strong> the Mount Elgon National park especially by the Benet is part <strong>of</strong> the problem causing<br />
increased run-<strong>of</strong>f, resulting in water logging and flooding in the low-lying areas <strong>of</strong> Ngenge and Lake<br />
Bisina.<br />
12. Although bush burning is illegal, most parts <strong>of</strong> the country are in flames during the months <strong>of</strong> January<br />
and February. The areas most affected are Kooki hills in Rakai, the Ngenge plains in the east, the areas<br />
surrounding Budongo forest and Pader District in the North.<br />
13. Civil strife and unrest resulting in IDPs increases the vulnerability <strong>of</strong> <strong>Uganda</strong> as a country and<br />
diminishes the chances <strong>of</strong> achieving MDGs targets.<br />
14. In 2002, the percentage <strong>of</strong> households that used electricity was 80%, tadooba 76% and lantern 11%.<br />
Households using electricity in urban areas was 41% and only 4% in rural areas.<br />
Kampala had 61% <strong>of</strong> households using electricity, central 15%, north only 1%.<br />
191
182<br />
Recommendations<br />
1. Efforts to reduce siltation <strong>of</strong> lakes Albert and Victoria should be stepped up. These lakes are likely<br />
to die if the situation is left to continue.<br />
2. The Tree planting Act should be enforced if the country is to be maintained as one <strong>of</strong> the green<br />
belts <strong>of</strong> Africa.<br />
3. Protection <strong>of</strong> Mount Elgon National Park should be a key priority for government. This park is not<br />
only protected for animals but also as a water catchment area. Degradation <strong>of</strong> this area will have<br />
far reaching impacts to both the communities in the Mt. Elgon area and the Teso plains.<br />
4. Development in Kampala City should be carefully planned otherwise the risk <strong>of</strong> disasters will<br />
continue to rise.<br />
5. Building in waterways and channels should stop.<br />
6. Wetlands should be jealously protected as important ecosystems if we are to sustain the country’s<br />
water regime and improve on people lives.<br />
7. Bush burning has to stop. It is recommended that if one is to burn it should only be done once in<br />
five years.
Restored riverbank in Moyo District (2008)<br />
183<br />
NEMA 2007
184<br />
Kika Group, a local dance troupe performs an Ozone layer<br />
creative dance during National World Ozone Day celebrations<br />
held in Mukono on 16 September 2006<br />
NEMA 2006
S p e c i a l f e a t u r e s<br />
Conservation and Wildlife<br />
Species 1960s 1982-1983 1995-1996 1999-2003 2004 - 2006 Status in <strong>Uganda</strong><br />
<strong>Uganda</strong> kob 70,000 40,000 30,000 44,000 34,461 Population decreasing<br />
Buffalo 60,000 25,000 18,000 17,800 30,308 Population increasing<br />
Elephant 30,000 2,000 1,900 2,400 4,322 Population low, but slowly increasing<br />
Hippopotamus 26,000 13,000 4,500 5,300 7,542 Population increasing slowly<br />
Hartebeest 25,000 18,000 2,600 3,400 4,439 Population increasing slowly<br />
Topi 15,000 6,000 600 450 1,669 Population increasing<br />
Impala 12,000 19,000 6,000 3,000 4,705 Population low, but beginning to increase<br />
Waterbuck 10,000 8,000 3,500 6,000 6,493 Population increasing<br />
Burchell’s zebra 10,000 5,500 3,200 2,800 6,062 Population increasing<br />
Eland 4,500 1,500 500 450 309 Population low, may still be decreasing<br />
Rothschild’s giraffe 2,500 350 250 240 259 Population stable<br />
Bright’s gazelle 1,800 1,400 100 50 0 Very rare, precarious<br />
Roan antelope 700 300 15 7 0 Very rare, precarious<br />
Oryx 2,000 200 0 0 0 Extinct in <strong>Uganda</strong><br />
Black rhino 400 150 0 0 0 Extinct in <strong>Uganda</strong>.<br />
White rhino 300 20 0 0 8 2 at UWEC and 4 in the sanctuary<br />
(Ziwa Rhino ranch)<br />
Derby’s eland 300 0 0 0 0 Extinct in <strong>Uganda</strong><br />
Wildlife Population trends in <strong>Uganda</strong><br />
Chimp at the Chimpanzee Sanctuary & Wildlife Conservation Trust (CSWCT),<br />
Ngamba Island, Mukono District.<br />
<strong>Uganda</strong> the Pearl 2007<br />
Time to relax: the Hippopotamus in Murchison Falls National park<br />
185<br />
UWA 2008
Wildlife<br />
Where is my food- The Giraffe in Murchison falls national park looking<br />
for food after a wild fire.<br />
Spectacular male hot spring in Semuliki National Park<br />
186<br />
The Zebra: the beauty <strong>of</strong> lake Mburo National Park<br />
UWA 2008<br />
A lioness in Kidepo National park receives attention<br />
Sempaya female hot springs in Semliki National Park<br />
Sempaya Hotspring in Semulki National Park<br />
UWA 2008<br />
UWA 2008<br />
I am coming for you: the elephant territory in Murchison Falls<br />
National Park<br />
UWA 2008<br />
UWA 2008<br />
UWA 2008
Biodiversity<br />
Kitagata Hotsprings in Bushenyi District<br />
Teso Rocks<br />
Children have fun with their cattle near Lwampanga landing site in Nakasongola District<br />
Below Left to Right: Agriculture in Kiruhura District: cattle, goats and invasive species (lantana camara respectively)<br />
NEMA file photo (2008)<br />
NEMA 2008<br />
NEMA 2008<br />
NEMA 2008<br />
Napak Rocks in Karamoja<br />
Indegenous tree in northern <strong>Uganda</strong><br />
Ankole cattle rangelands<br />
187<br />
NEMA 2008<br />
NEMA 2008<br />
NEMA 2006<br />
NEMA 2008
Biodiversity<br />
Ecotourism: Heart-shaped lake in Kabarole District<br />
188<br />
Rose Hogan 2006<br />
NEMA 2006<br />
Katwe salt lake lake in Kasese District<br />
A Marabou stock (karoli) mother feeds its chicks outside NEMA House (2008) Left to Right: Dried trees at Kumi and Kasese District Headquarters respectively;<br />
Thorny tree with rare bird nests in Queen Elizabeth National Park.<br />
The cheeky monkeys in Queen Elizabeth National Park Below: some <strong>of</strong> the <strong>Uganda</strong> fruits and vegetables<br />
Pawpaws<br />
Oranges<br />
Carrots<br />
NEMA 2006<br />
Mango tree with ripe fruit<br />
NEMA 2007<br />
Mangoes<br />
Avocado<br />
Green bananas (matooke)<br />
NEMA 2008<br />
NEMA 2008<br />
Green<br />
vegetables<br />
(doodo)<br />
Jack fruit<br />
(fene)
Hon. Maria Mutagamba, Minister <strong>of</strong> Water and<br />
<strong>Environment</strong>, plants a tree in Kasese (2007)<br />
NEMA 2007<br />
National World <strong>Environment</strong> Day Celebrations<br />
NEMA staff during the match-past,<br />
Arua (2008)<br />
UWEC display<br />
Chimpanzee sanctuary,<br />
Ngamba island (2008)<br />
NEMA 2008<br />
NEMA 2008<br />
Hon. Jesca Eriyo, Minister <strong>of</strong> State for<br />
<strong>Environment</strong>, plants a tree in Arua (2008)<br />
Hon. Jennifer Namuyangu, Minister <strong>of</strong> State<br />
for Water, plants a tree in Arua (2008)<br />
189<br />
NEMA 2008<br />
NEMA 2008
190<br />
Areas <strong>of</strong> interest<br />
Houses <strong>of</strong> Parliament, Kampala<br />
Mulago National Referral Hospital, Kampala<br />
Communications<br />
House, Kampala<br />
Workers House,<br />
Kampala<br />
The Independence monument, Kampala<br />
Makerere University Main Building, Kampala<br />
The CHOGM monument, Kampala<br />
East African Development Bank and Bank <strong>of</strong> <strong>Uganda</strong><br />
adjacent to the Constitutional Square, Kampala
Monuments marking the source <strong>of</strong> the River Nile, Jinja The spot where John H. Speke discovered the source <strong>of</strong> River Nile at Jinja in 1862<br />
Mandela National Stadium at Nambole, Wakiso District<br />
Main Post Office in Kampala City Centre<br />
Statue <strong>of</strong> a cow, a symbol for Mbarara District, at the entrance<br />
to Mbarara Municipality, Western <strong>Uganda</strong> The <strong>Uganda</strong> Museum, Kampala<br />
Kampala Northern by-pass under construction<br />
191
A modern country homestead near Mbarara town, surrounded by banana (matooke)<br />
gardens, pasture and hills<br />
Murchison Falls<br />
192<br />
Nature<br />
Below: Flocking birds<br />
Ndeija hills in Ntungamo District<br />
Sezibwa Falls<br />
Below: Kalagala Falls
Impacts on our environment<br />
Kalerwe market in a Kampala surbub Burning unsorted soild waste at Nakawa market in Kampala<br />
Residents <strong>of</strong> Kashaka, Kashari, Mbarara District inspecting their gardens after a 1 hr hail<br />
storm hit their area on the afternoon <strong>of</strong> 24th February 2007. A lot <strong>of</strong> crops were distroyed<br />
Above: Part <strong>of</strong> the ever congested Old taxi park in Kampala.<br />
Below: A heap <strong>of</strong> plastic bags (kavera) waste in Makindye near Kampala<br />
Burning unsorted soild waste in rural Aruaa town<br />
Above: Down town Kampala on the Burton Street-Luwum Street junction<br />
Below: Nakulabye slum area<br />
193
Places <strong>of</strong> worship<br />
Namirembe Cathedral (Anglican)<br />
Rubaga Cathedral (Catholic)<br />
Najanankumbi Seventh Day Adventist (SDA)<br />
194<br />
Namugongo Martyrs Basillica (Catholic)<br />
Kibuli Mosque<br />
Namungoona (Orthodox)
Kasubi tombs, burial grounds <strong>of</strong> Buganda kings, Buganda kingdom Mparo tombs in Bunyoro kingdom<br />
Bulange, House <strong>of</strong> Buganda kingdom at Mengo, Kampala<br />
A Batwa household, Kisoro District<br />
Cultural aspects<br />
Princess Komuntale <strong>of</strong> Tooro kingdom<br />
Mbale Cultural site, Mbale District<br />
195
Traditional aspects<br />
Gisu Imbalu (circumcision) traditional dance<br />
Baganda Bakisimba traditional dance<br />
Traditional dance from northern <strong>Uganda</strong><br />
Elderly men from Namunyumya blowing traditional Ngwaala horns<br />
Karamojong girls in their traditional attire Soga girls dance kamenhaibuga traditional dance<br />
196
Unique innovations and appearances<br />
Self-discipline: An <strong>of</strong>fice in Moyo District<br />
Statue <strong>of</strong> a cow at the junction to Nakasongola District Headquarters<br />
Gender balance: participation in national elections at grass root level, Kamuli District<br />
Stone carvings <strong>of</strong> a “bird” and “eggs” at the Chimpanzee Sanctuary, Ngamba island<br />
197
Crater lakes in <strong>Uganda</strong><br />
198
Editorial and Production Team<br />
Technical Coordination and Support<br />
Technical coordination<br />
Kitutu K. Mary Goretti NEMA<br />
Inception and planning team<br />
Telly Eugene Muramira NEMA<br />
Dr. Bagoora Festus NEMA<br />
Kitutu K. Mary Goretti NEMA<br />
Adimola Beatrice NEMA<br />
Mpabulungi Firipo NEMA<br />
Elizabeth Mutayanjulwa NEMA<br />
Turyatunga Frank UNEP <strong>GRID</strong>-<strong>Arendal</strong>, Norway<br />
Sebukeera Charles UNEP-Nairobi, Kenya<br />
Bright Kimuli Richard <strong>Uganda</strong> Bureau <strong>of</strong> Statistics<br />
Lwanga B. Athansius District <strong>Environment</strong> Officer, Sembabule<br />
Chemisto Samuel District <strong>Environment</strong> Officer, Kapchorwa<br />
Wandera Callist Department <strong>of</strong> Surveys and Mines<br />
Bbira Yasin District <strong>Environment</strong> Officer, Mityana<br />
Magezi Akiiki Department <strong>of</strong> Meteorology<br />
Wamunga George District <strong>Environment</strong> Officer, Bududa<br />
Wanume Paul District <strong>Environment</strong> Officer, Mityana<br />
Fualing Doreen District <strong>Environment</strong> Officer, Nebbi<br />
Sabiiti Paul M District <strong>Environment</strong> Officer, Kabale<br />
Odipio Edward Adraku District <strong>Environment</strong> Officer, Arua<br />
Omute Paul Wetlands Management Department<br />
Bakunda Aventino Department <strong>of</strong> Fisheries<br />
Isabirye Moses National Agricultural Research Laboratory<br />
Edema Maurice District <strong>Environment</strong> Officer, Moyo<br />
Mpoza Esau District <strong>Environment</strong> Officer, Wakiso<br />
Diisi John National Forestry Authority<br />
Maganda Moses District <strong>Environment</strong> Officer, Jinja<br />
Sekamuli Benjamin Directorate <strong>of</strong> Water Resources<br />
Management Department, Entebbe<br />
Otunga Anthony District <strong>Environment</strong> Officer, Amolatar<br />
John Kitaka Department <strong>of</strong> Surveys and Mapping<br />
Nakimbugwe Anne Mukono District <strong>Environment</strong> Office<br />
Wakube Charles District <strong>Environment</strong> Officer, Mbale<br />
Najjuma Florence District <strong>Environment</strong> Officer, Rakai<br />
Kooli Augustine District <strong>Environment</strong> Officer, Kasese<br />
Apolot Elizabeth District <strong>Environment</strong> Officer, Katakwi<br />
Gubya Phoebe <strong>Environment</strong> Officer, Kampala City Council<br />
Kunobere James Bond District <strong>Environment</strong> Officer, Nakasongola<br />
Sikor M Stephen District <strong>Environment</strong> Officer, Bukwo<br />
Musingwire Jeconious District <strong>Environment</strong> Officer, Mbarara<br />
Okello Samuel District <strong>Environment</strong> Officer, Gulu<br />
Majaliwa J.G.M Makerere University Institute <strong>of</strong><br />
<strong>Environment</strong> and Natural Resources<br />
Tumuhimbise John Ministry <strong>of</strong> Energy and Mineral Development<br />
Muja Judith District <strong>Environment</strong> Officer, Kisoro<br />
Namanya B Didas Ministry <strong>of</strong> Health<br />
Wejuli Wilber Intern - NEMA<br />
Kimera Dennis Intern - NEMA<br />
Strategic Advisory team<br />
Top Policy Committee Ministry <strong>of</strong> Water and <strong>Environment</strong><br />
Dr. Aryamanya-Mugisha, Henry - NEMA<br />
NEMA Senior Management NEMA<br />
Charles Sebukeera UNEP-Nairobi, Kenya<br />
Ashbindu Singh UNEP <strong>GRID</strong>-Sioux Falls, USA<br />
Frank Turyatunga UNEP <strong>GRID</strong>-<strong>Arendal</strong>, Norway<br />
Authors<br />
Kitutu K. Mary Goretti NEMA<br />
Telly Eugene Muramira NEMA<br />
Dr. Festus Bagoora NEMA<br />
Firipo Mpabulungi NEMA<br />
Kimuli Bright UBOS<br />
John Kitaka Surveys and Mapping<br />
John Diisi NFA<br />
Maurice Endema Moyo District<br />
Lwasa James NARL<br />
Phoebe Gubya KCC<br />
Benjamin Sekamuli DWRM<br />
Omute Paul WMD<br />
Bruce Pengra ASRC Research & Technology Solutions,<br />
USGS<br />
Research and technology solutions<br />
Bruce Pengra USGS /UNEP<br />
John Kitaka Department <strong>of</strong> Surveys and Mapping<br />
Kimberly Giese Stinger Ghaffarian Technologies (SGT, Inc.)<br />
Kitutu K. Mary Goretti NEMA<br />
Elizabeth Mutayanjulwa NEMA<br />
Contributors from UNEP <strong>GRID</strong>-Sioux Falls<br />
Ashbindu Singh UNEP<br />
Kimberly Giese Stinger Ghaffarian Technologies (SGT, Inc.)<br />
Bruce Pengra ASRC Research & Technology Solutions<br />
Arshia Chander Stinger Ghaffarian Technologies (SGT, Inc.)<br />
Michelle Anthony Stinger Ghaffarian Technologies (SGT, Inc.)<br />
Team that compiled <strong>Atlas</strong><br />
Kitutu K. Mary Goretti NEMA (Coordinator)<br />
Elizabeth Mutayanjulwa NEMA<br />
Kimberly Giese Stinger Ghaffarian Technologies (SGT, Inc.)<br />
Mugambwa Everest K. NEMA<br />
Mwansa Lukwesa <strong>Environment</strong> Council, Zambia<br />
Technical Editors<br />
Frank Turyatunga, Eugene T. Muramira, Dr. Festus Bagoora, Kitutu K.<br />
Mary Goretti<br />
Design and layout<br />
Elizabeth Mutayanjulwa<br />
Photography<br />
Main photographers: Kitutu K. Mary Goretti, Mugambwa Everest K.,<br />
Elizabeth Mutayanjulwa, Firipo Mpabulungi, George Lubega, Fred Onyai<br />
Other photographers: Photos were acknowledged accordingly<br />
Logistics<br />
Kasekende M. Aristarco, Kasagga Allan, Moses K. Kayima, Perry I. Kiza,<br />
Allen Asasira, Maria Kagusuuru<br />
Acknowledgements<br />
The Government <strong>of</strong> <strong>Uganda</strong> and NEMA thank the following contributors:<br />
<strong>Uganda</strong><br />
All Ministries<br />
All Districts<br />
Local Governments<br />
<strong>Uganda</strong> Bureau <strong>of</strong> Statistics<br />
National Forest Authority<br />
National Agricultural Research Laboratories<br />
Kampala City Council<br />
<strong>Uganda</strong> Wildlife Authority<br />
Dr. Nangendo Grace<br />
<strong>Uganda</strong> Museum<br />
Nature <strong>Uganda</strong><br />
Norway<br />
UNEP <strong>GRID</strong>-<strong>Arendal</strong><br />
UNEP <strong>GRID</strong>-Sioux Falls, USA<br />
Ashbindu Singh<br />
Kimberly Giese<br />
Bruce Pengra<br />
Arshia Chander<br />
UNEP Nairobi<br />
Executive Diretor, UNEP<br />
Charles Sebukeera<br />
Chris Ambala<br />
Cover photo credits (left to right): Beautiful sunset ©<strong>Uganda</strong> the Pearl 2007; UPE-<br />
Jjanyi Primary School ©NEMA; Workers House, Kampala ©NEMA; Hon. Minister<br />
M.Mutagamba during wastewise campaign, Nakawa Kampala 2008 ©NEMA; Mt.<br />
Elgon; Mugahinga mountains ©UWA; Rainfall in <strong>Uganda</strong> ©<strong>Atlas</strong> <strong>of</strong> <strong>Uganda</strong>; Mt.<br />
Rwenzori ©UWA; Mountain gorillas in Bwindi impenetrable forest ©UWA; Lake<br />
Victoria-Kagera mouth<br />
199
Acronyms<br />
AEZ Agro-ecological Zoning<br />
AIDS Acquired Immune Deficiency Syndrome<br />
AKDN Aga Khan Development Network<br />
AKFED Aga Khan Fund for Economic Development<br />
AMCOW African Ministerial Council on Water<br />
CEC Cation Exchange Capacity<br />
CHOGM Commonwealth Heads Of Government Meeting<br />
DRC Democratic Republic <strong>of</strong> Congo<br />
DWD Directorate <strong>of</strong> Water Development<br />
EAC East African Community<br />
EIN <strong>Environment</strong> Information Network<br />
ENR <strong>Environment</strong> and Natural Resources<br />
EROS Earth Resources Observation and Science<br />
ESRI <strong>Environment</strong>al Systems Research Institute<br />
FAO Food and Agriculture Organization<br />
GDP Gross Domestic Product<br />
GHGs Green House Gas<br />
GoU Government <strong>of</strong> <strong>Uganda</strong><br />
HIV Human Immunodeficiency Virus<br />
IBAs Important Bird Areas<br />
ICT Information and Communication Technology<br />
IDP Internally Displaced People<br />
ITCZ Inter-Tropical Convergence Zone<br />
IUCN International Union for Conservation <strong>of</strong> Nature<br />
JEEP Joint Energy and <strong>Environment</strong> Projects<br />
MDGs Millennium Development Goals<br />
MFACOI Multi Purpose Farmers Community Initiative<br />
MFPED Ministry <strong>of</strong> Finance Planning and Economic Development<br />
MSS Multi Spectral Scanner<br />
MWE Ministry <strong>of</strong> Water and <strong>Environment</strong><br />
NASA National Aeronautics and Space Administration<br />
NBI Nile Basin Initiative<br />
NDP National Development Plan<br />
NEMA National <strong>Environment</strong> Management Authority<br />
NFA National Forestry Authority<br />
NGA National Geospatial-Intelligence Agency<br />
NGO Non Governmental Organisation<br />
NILE-COM Nile Council <strong>of</strong> Ministers<br />
NSOER National State <strong>of</strong> <strong>Environment</strong> Reports<br />
PA Protected Area<br />
PEAP Poverty Eradication Action Plan<br />
QENP Queen Elizabeth National Park<br />
RCMRD Regional Centre for Mapping <strong>of</strong> Resources for Development<br />
SOCADIDO Soroti Catholic Diocese Integrated Development Organisation<br />
SOE State <strong>of</strong> <strong>Environment</strong><br />
SOER State <strong>of</strong> <strong>Environment</strong> Report<br />
THF Tropical High Forests<br />
TM Thematic Mapper<br />
UBOS <strong>Uganda</strong> Bureau <strong>of</strong> Statistics<br />
UHSBS <strong>Uganda</strong> HIV/AIDS Sero Behavioral Survey<br />
UNEP United Nations <strong>Environment</strong>al Programme<br />
UNHS <strong>Uganda</strong> National Household Survey<br />
UPE Universal Primary Education<br />
USD United States Dollar<br />
USGS United States Geological Survey<br />
UTM Universal Transverse Mercator<br />
UWA <strong>Uganda</strong> Wildlife Authority<br />
UWEC <strong>Uganda</strong> Wildlife Education Centre<br />
VIP Ventilated Pit-Latrine<br />
200
References<br />
A Comparison <strong>of</strong> Soil Fertility Indicators for Women and Men’s Agricultural Plots. (http://web.africa.ufl.<br />
edu/asq/v6/v6i1a2.htm#_edn1)<br />
Bagoora F.D.K, 1993: An assessment <strong>of</strong> some cases and effects <strong>of</strong> soil erosion hazards in Kabale highland,<br />
south-western <strong>Uganda</strong>, and people’s attitude towards conseravtion. In a Bencherifa (Ed.) Resource Use and<br />
Conservation; Faculty <strong>of</strong> Socila Sceiences, Mohammed U University, Rabat, Morocco pp215-236<br />
Bagoora F.D.K, 1997: An analysis <strong>of</strong> run-<strong>of</strong>f and Soil loss on upland peasant farms in Rukiga highland,<br />
eastern Kabale and the Municipalities for <strong>Environment</strong> conservation. Unpublished PhD Thesis, Faculty <strong>of</strong><br />
Science, Makerere University, Kampala.<br />
FAO World Soil Reference Base, Food and Agriculture Organization <strong>of</strong> the United Nations, Rome,1988.<br />
Global Carbon Project, CSIRO Marine and Atmospheric Research, Canberra, ACT 2601, Australia<br />
http://www.ugandacf.org/Projects/ksr_project.html<br />
J. G. Canadell1, M. R. Raupach 1, and R. A. Houghton2 Anthropogenic CO2 emissions in Africa<br />
Katende, A et al, 1990, Birds and Woody Perennials Inventory: Mount Elgon Forest Reserve, Sustainable<br />
Development and Forest Conservation in <strong>Uganda</strong>, Technical Report No. 1, IUCN.<br />
Langlands B.W, 1974: <strong>Uganda</strong> in Maps, Parts Two and Three - The <strong>Environment</strong> (Preliminary Non-Edition),<br />
Geography Department, Makerere University, Kampala <strong>Uganda</strong><br />
Langlands 1974) - Parts II and III, page 352<br />
Moyini, yakobo et al. 2008. Economic valuation <strong>of</strong> the proposed degazettement <strong>of</strong> part <strong>of</strong> Mabira central<br />
forest reserve.<br />
Ministry <strong>of</strong> Water and <strong>Environment</strong>, 2001<br />
Nature <strong>Uganda</strong><br />
National State <strong>of</strong> <strong>Environment</strong> Report for <strong>Uganda</strong> 2004-2005<br />
NEMA (2007). Pilot Integrated Ecosystem Assessment. National <strong>Environment</strong> Management Authority and<br />
UNEP, Kampala, <strong>Uganda</strong><br />
NEMA (2008): National State <strong>of</strong> <strong>Environment</strong> Report for <strong>Uganda</strong> (2008)<br />
NEMA (2007). Pilot Integrated Ecosystem Assessment. National <strong>Environment</strong> Management Authority and<br />
UNEP, Kampala, <strong>Uganda</strong><br />
NEMA (2008): National State <strong>of</strong> <strong>Environment</strong> Report for <strong>Uganda</strong> (2008)<br />
NEMA SOE Reports (1998, 2002, 2004-2005)<br />
P. Nkedi-Kizza et al. Gender and Soil Fertility in <strong>Uganda</strong>:<br />
<strong>Uganda</strong> Wildlife Authority 2007: Aerial total count <strong>of</strong> medium – large mammals in Kabwoya Wildlife Reserve<br />
and Kaiso-Tonya Community Wildlife area<br />
P. Nkedi-Kizza et al. Gender and Soil Fertility in <strong>Uganda</strong>:<br />
A Comparison <strong>of</strong> Soil Fertility Indicators for Women and Men’s Agricultural Plots.<br />
(http://web.africa.ufl.edu/asq/v6/v6i1a2.htm#_edn1)<br />
Richards, P. W. (1996). The Tropical Rain Forest. Cambridge University Press, 2 nd Edition<br />
Scott, P. (1995). IUCN technical report no. 15, unpubl.<br />
Stephen Muwaya (2008) Ministry <strong>of</strong> Agriculture, Animal Industry and Fisheries<br />
Synnott, T. J. (1968). Working Plan for Mount Elgon Central Forest Reserve. 1st Revision. Period 1968 to1978.<br />
<strong>Uganda</strong> Forest Department, Entebbe.<br />
Van Heist, M. (1994). Land Unit Map <strong>of</strong> Mount Elgon National Park. IUCN technical report, unpubl.<br />
Woods Hole Research Center, Falmouth, MA 02540, USA<br />
201
Index<br />
A<br />
Abim 60,181<br />
Abstraction 18<br />
Aburiji 104<br />
Acacia species 102<br />
Acholi-Kyoga 8,9<br />
Act <strong>of</strong> Parliament 58<br />
Aesthetic 28<br />
African 3, 25<br />
African Ministerial Council on Water (AMCOW) 27<br />
African plateau 3 African plateau 4<br />
African Surface 17, 84<br />
Agricultural 155<br />
Agricultural Ministry 54<br />
Agricultural productionv 158<br />
Agricultural systems 3<br />
Agriculture 4, 61, 108<br />
Agro-ecological Zoning (AEZ) 45<br />
Agro-pastrolism 60<br />
Albertin Graben Region 166<br />
Albertine Graben 143<br />
Albertine Rift (Western Rift Valley) 140<br />
Albertine Rift 152<br />
Albertine rift valley 9<br />
Algae Bloom 17,113<br />
Algae growth 145<br />
Altitude 7, 3<br />
Altitude141<br />
Aluminum 44<br />
Amelioration 37<br />
Amua 104<br />
Amuria 106<br />
Amuria 181<br />
Amuru 175<br />
Amuru 181<br />
Ankole Kingdom 166<br />
April 7,9<br />
Aquatic biodiversity 101<br />
Aquatic vegetation 87<br />
Arable land 181<br />
Arenic gleysols 85<br />
Arenosols 85<br />
Aswa 5<br />
Aswa county 7<br />
August 7, 9<br />
B<br />
Baker 138<br />
Banana 59<br />
Basement rocks 3<br />
Basin Initiative (NBI) 135<br />
Batuku 140<br />
Beans 59<br />
Benet grasslands 90<br />
Berengei 37, 90, 95<br />
Biodiversity 10, 28, 36<br />
Biodiversity 135,139,143<br />
Biological environments 3<br />
Biological fixation 44<br />
biological resources 167<br />
Biomass 128, 164<br />
Blooms <strong>of</strong> algae 147<br />
Blue-green algae146<br />
Boreholes 162<br />
Budongo 71, 72<br />
Budongo forest 70<br />
Bududa 175<br />
Bududa 175<br />
buffer zones 129<br />
Buganda plateau 84<br />
Buganda surface 84<br />
Bugiri District 18,63<br />
Buhweju 86<br />
Bukedea 106<br />
Bukwo 175, 176, 181<br />
Bulisa 181<br />
Bundibugyo142<br />
202<br />
Burundi 14,145<br />
Bushenyi 86, 52<br />
Bushenyi District 152<br />
Bwaise 128, 129<br />
Bwaise-Kalerwe 5<br />
Bweyogere 110<br />
Bwindi 37, 39<br />
C<br />
Carbon sequestration 37<br />
Cassava 61<br />
Catchment Areas 11<br />
Catchments 100,144,162<br />
Catchments142<br />
Cation exchange capacity (CEC) 44<br />
Cations 44<br />
Cattle 7, 59<br />
Cattle corridor 5,58,60<br />
Celestial objects x<br />
Centenary Park 113<br />
Central 166<br />
Central Africa 17<br />
Central region 168,176,181<br />
Central <strong>Uganda</strong> 5<br />
Cereal-cotton-cattle farming systems 60<br />
Cereals 61<br />
Chahafi 99, 100, 101<br />
Chala 104<br />
Charcoal 69, 78, 128<br />
Chimpanzee153<br />
Clay mining 28<br />
Climate 4, 7<br />
Climate change 101<br />
Climate disaster 7<br />
Climate rainfall 4<br />
Climatic changes 103<br />
Climatic conditions 3<br />
Climatic zones 7, 8, 9<br />
C<strong>of</strong>fee 59<br />
Combrentum 102<br />
Communication Commission 55<br />
Concave pediments<br />
Congo 102<br />
Conservation 26, 39<br />
Constitution 21<br />
Continental 5<br />
Convention 27<br />
Cotton 61<br />
Cultivation 59, 62<br />
Cyperus papyrus 28<br />
D<br />
Damboos 28<br />
December x, 7, 9<br />
Deforestation 128,163,173<br />
Degradation142<br />
Democratic Republic <strong>of</strong> Congo (DRC) 140<br />
Democratic Republic <strong>of</strong> Congo 3,135,141<br />
Denudation process 84<br />
Deoxygenating 146,147<br />
Department in the Ministry <strong>of</strong> Water and<br />
<strong>Environment</strong> 26<br />
Desertification 68<br />
Development 55<br />
Directorate <strong>of</strong> Water Development (DWD) 150<br />
Disease 169<br />
District 26<br />
Diversity 3<br />
Droughts 61<br />
Drowned valleys 86<br />
Dufile 104<br />
E<br />
EAC 135<br />
Earth x<br />
East Africa 3,96<br />
East Africa Meteorological Department 85<br />
East African Community 135<br />
East African region 54,63,164<br />
East African Rift Valley 3<br />
Eastern 166<br />
Eastern region 181<br />
Eastern <strong>Uganda</strong> 58<br />
Ebemi 104<br />
Eco- tourism 28,37<br />
E-colis 129<br />
Ecological 28, 37<br />
Ecological functions 94<br />
Economic 55<br />
Economic development 28<br />
Economic evaluation 66<br />
Economy 157<br />
Ecosystem 21, 66, 87,100, 94, 136<br />
Ecosystems 3, 39, 37, 135<br />
Ecosystem services 66<br />
Edward 138<br />
Effluents 129<br />
Egypt 150<br />
El Nino 149<br />
Elgon 4<br />
Emissions load 163<br />
Encroached (10), 87<br />
Encroachment 37, 39<br />
Encroachment 69, 101, 128, 129<br />
Endemic birds 95<br />
Energy 164,179,180<br />
Energy generation 5<br />
Entebbe 110,146,166<br />
<strong>Environment</strong> African Union 27<br />
<strong>Environment</strong> and natural resource (ENR) 157<br />
<strong>Environment</strong> management 19<br />
environmental degradation 158<br />
<strong>Environment</strong>al impact 78<br />
<strong>Environment</strong>al resource 5<br />
<strong>Environment</strong>al sustainability 17, 162<br />
Equator 3,4,144<br />
Equatorial position 5<br />
Erosion 3, 36<br />
Erosion control 37<br />
Escapement 72<br />
Eucalyptus 76<br />
Eutrophication 87,46,87,146<br />
Evaporation 4,26<br />
Extraction <strong>of</strong> timber 88<br />
F<br />
Faecal contamination 129<br />
Farming 59<br />
Farmlands 79<br />
Fauna species 39<br />
Fauna148<br />
Ferralic Acrisols 85<br />
Ferralic arenosols 85<br />
Ferralsols 84<br />
Fertile soils 158<br />
Figs 102<br />
Fisheries 3,68,177<br />
Fisheries resources 10<br />
Flora 39, 148<br />
Food security 63<br />
Foreign exchange 63<br />
Forest 173<br />
Forest Department 88<br />
Forest rehabilitation 89<br />
Forest Reserve 39,89<br />
Forest resources 36<br />
Forest woodlands 176<br />
Forestry 37<br />
Forests 3,37,158,175<br />
Forests 3, 37<br />
Formulation 26<br />
Fossil fuel emissions 164
G<br />
Gaba 25<br />
Gazettted 36, 39<br />
GDP 157,158<br />
Gemorphologically 84<br />
Genetic resources conservation 28<br />
Geological 25<br />
Geological structures 3<br />
Geological times 17<br />
Geology 2, 18<br />
George 138<br />
Global warming 4,27,138<br />
Gneissic 18<br />
Goats 59<br />
Gorilla 37<br />
Government 26,74<br />
Grazing resources 28<br />
Green Algae bloom 146<br />
Green House Gas Emissions 163<br />
Groundnuts 59, 61<br />
Groundwater 10, 18<br />
Gulu 166<br />
H<br />
Halpic arenosols 85<br />
Halpic gleysols 85<br />
Halpic luvisols 85<br />
Hectares 26<br />
Hoima 181<br />
House gas emissions163<br />
Humidity 9<br />
Hyacinth 147<br />
Hydro-electric 17<br />
Hydro-electric power 56<br />
Hydrological 21,28,86,94,148<br />
Hydro-power 158<br />
Hyper-accelerated 100<br />
Hyperskeletic Leptosols 84<br />
Hypoxic water147<br />
I<br />
Ibanda 152<br />
IBAs 95<br />
Ice cap 4<br />
Ice cover 138<br />
Implementation 26<br />
Industrialization 55,110<br />
Infiltration 18<br />
Infrastructure 167<br />
Innovation 55<br />
Inorganic 44<br />
International cooperation 26<br />
International treaty 26<br />
Internet subscribers 55<br />
Inter-Tropical Convergence Zone (ITCZ) 7<br />
Iran 26<br />
Iron 44<br />
Irrigation 5<br />
Isingiro 176<br />
ITCZ 9<br />
Itojo 86<br />
Iyamuriro 97<br />
Iyamuriro wetland 94<br />
J<br />
January 7<br />
Jinja 135,166,175,181<br />
July 7, 11, 9<br />
June 9<br />
Jupiter x<br />
K<br />
Kaabong181<br />
Kaawa Boat docks<br />
Kabale District 11, 75<br />
Kabale-Kisoro 97<br />
Kabarole 176<br />
Kaberamaido 181<br />
Kaabong 60<br />
Kacheera 86<br />
Kagera River 144,145<br />
Kampala 5,25,56,108,110,128,129,<br />
166,175,181<br />
Kampala City 129<br />
Kampala City Council 128<br />
Kampala-Entebbe Highyway<br />
Kampala-Wakiso 129<br />
Kamuli District 10,18<br />
Kamwenge 152<br />
Kamwokya 129<br />
Kanagisa wetlands 86<br />
Kaniyo Pabidi 72<br />
kaolinite 44<br />
Kapchorwa 91,107,175,181<br />
Karagwe-Ankolean 82, 83<br />
Karamoja 7,8,958<br />
Karamoja region 5,60<br />
Kasese District 143<br />
Kasyoha–Kitomi Forest Reserve 152<br />
Katabaluka 83<br />
Katakwi 106,181<br />
Katiarizo hills 83<br />
Katonga 92<br />
Katonga Basin 92<br />
Katonga River 92<br />
Katugo 75, 76<br />
Kayumba 99, 100, 101<br />
Kenya 3,135,136,144,144<br />
Kerosene lanterns 179<br />
Kibaale 39,181<br />
Kibanda 82, 83<br />
Kibare-Bukora 86<br />
Kibimba 54,92<br />
Kibimba Rice Scheme 63<br />
Kibimba River 92<br />
Kidepo 39<br />
Kigezi 96<br />
Kigezi-Ankole 84<br />
Kijanebalola 86<br />
Kilns 103<br />
Kilometres x<br />
Kiira 110,166<br />
Kiruhura 58,176,181<br />
Kisoro District 97, 99,100<br />
Kisumu 135<br />
Kitgum 106,181<br />
Kitomi 152<br />
Kitomi Forest 152<br />
Kooki 83, 84, 86, 87<br />
Kooki County 82<br />
Kooki hills 82, 84<br />
Kotido 60,181<br />
Kumi19<br />
Kwania 148<br />
Kyambogo 5<br />
Kyambogo junction 113<br />
Kyambura Wildlife Reserve 152<br />
Kyengera 110<br />
Kyenjojo 176,181<br />
Kyoga 11,17,148<br />
Kyoga system 148<br />
L<br />
Lacustrine 28<br />
Lagoon 104<br />
Lagoons Perennial 104<br />
Lake Albert 3,10,11,12139,140,<br />
141,142,143<br />
Lake Basin 12<br />
Lake Bisina 107<br />
Lake Bunyonyi 11,96,98,99,100,101<br />
Lake Edward 11,140,141<br />
Lake George 11<br />
Lake Kejanebalola 86,87<br />
Lake Kyoga 58,141,148<br />
Lake Mburo 39<br />
Lake Mutanda 97,98,99,100,101<br />
Lake Turkana 11,136<br />
Lake Victoria 4,7,9,10,12,17,27,29,66,86,135,<br />
136,144,146<br />
Lake Victoria Basin 4, 8, 9<br />
Lake Wamala 92,93<br />
Lakes Kacheera 86<br />
Land management 100<br />
Landlocked 3<br />
Landsat 80<br />
Landsat TM image 141,153<br />
Landsate satellite images 72<br />
Landscape 3,25<br />
Landscape 84,86<br />
Landscape structure 17<br />
Landuse 101<br />
Laropi 102,104<br />
Laterite 84<br />
Latitude 3<br />
Latrine coverage 178<br />
Lava 96,98,100<br />
Lava band 97<br />
Lava flow 97<br />
Legislation 26<br />
Lira 166<br />
Livestock agriculture 5<br />
Long wind-fetch 5<br />
Longitude 3<br />
Lower relative humidity 4<br />
Lubigi drainage channel<br />
Lutembe 27<br />
Luvisols 85<br />
Luwero 175<br />
Luzira129<br />
Lyantonde 176<br />
Lyantonde 181<br />
Lyantonde175<br />
M<br />
Mabira forest 10<br />
Mabira forest reserve 66<br />
Mafuga 75<br />
Magherita peak 3<br />
Maize 59,61<br />
Major lakes 11<br />
Makerere University 55<br />
Manafwa 175<br />
Manafwa District 4<br />
Management systems 21<br />
March 7, 9<br />
Masaka 166<br />
Matooke 90<br />
May 7, 9, 11<br />
Mayuge 175<br />
Mbale 166,175<br />
Mbarara 166<br />
Mbarara 58, 86<br />
Mburo 86<br />
MDG 180<br />
MDG 7 162<br />
Mediterranean sea 135<br />
MENP 90<br />
Meteorology Department 8<br />
Metropolitan 110<br />
Mgahinga 39<br />
Mgahinga forests 37<br />
Micro-catchments 86<br />
Micro-climate 95<br />
Migration 168<br />
Millet 59<br />
Minerals 158<br />
Minerals 44<br />
Mityana District 92<br />
Monsoons 7<br />
Monsoons winds 9<br />
Montane forest136<br />
203
Montane forests 90<br />
Moon x<br />
Moroto 60,181<br />
Mount Elgon 8,9,89,88,91<br />
Mount Elgon Crown 88<br />
Mount Elgon National Park 90,136<br />
Mount Elgon’s ecosystem 90<br />
Mount Rwenzori 142<br />
Mountain gorillas 166<br />
Moyo 15<br />
Moyo district 104<br />
Mpamujugu 93<br />
MSS image 141<br />
Mt Elgon 4,39,136<br />
Mt. Rwenzori 4,140<br />
Mudstone 83<br />
Muhavura mountains 9<br />
Mukono 181,110<br />
Munyonyo 27<br />
Murchison Falls 26,39,141<br />
Murchison falls National Park 70 ,73<br />
Murehe 99,100,101<br />
Musa sapientum 90<br />
Mutanda 100,101<br />
Mwenge 76<br />
Mwenge Forest reserves 75<br />
N<br />
Nairobi 85<br />
Nakapiripirit 60,181<br />
Nakaseke 175,176<br />
Nakasongola 58<br />
Nakasongola District 68,76<br />
Nakivubo Channel 17,129<br />
Nakivubo drainage system 128<br />
Nakivubo wetland 113,128<br />
Nakivubo wetland system 129<br />
Namungoona 110,129<br />
Nanasana166<br />
National Development Plan (NDP) 55<br />
National Park 89<br />
Natural environment 128<br />
Natural resource 3,135,167,170<br />
Natural vegetation 142<br />
Nbale 91<br />
Ndorobos 90<br />
Nebbi District 10<br />
Ngenge 107<br />
Nile 103,139,149<br />
Nile River 150<br />
Nile River system 136<br />
Nitrogen 44<br />
Nomadic 58<br />
Non-conifers 76<br />
Non-renewable 158<br />
North 4<br />
Northeast 4, 9<br />
North-East 7<br />
Northern region 169,172,175,181,182<br />
Northern region <strong>of</strong> <strong>Uganda</strong> 166<br />
Northern regions 166<br />
Northern <strong>Uganda</strong> 5,18<br />
November x,9<br />
Nsooba–Lubigi wetland system 128,129<br />
Nsooba 113<br />
Nsooba-Lubigi drainage system 128<br />
Nsooba–Lubigi Nakivubo Wetland systems 128<br />
Ntungamo 86,176<br />
O<br />
October 9<br />
Oil 26<br />
Open water bodies 10<br />
Orographic 9<br />
Owen Falls Dam 56<br />
Oxides 44<br />
Oyo ecosystems 104<br />
204<br />
P<br />
Pader 106,181<br />
Pader District 80<br />
Papyrus 28,150<br />
Papyrus yellow warble 95<br />
Pastoralists 58,90<br />
Pearl <strong>of</strong> Africa 1,3<br />
Per Capita Forest 172<br />
Petroleum zone143<br />
Phosphorus 44,146<br />
Phyllite 83<br />
Pine 76<br />
Planosols 44<br />
Plantations 175<br />
Plinthic Ferralsols 84<br />
Plinthosols 44<br />
Poaching 39<br />
Port Bell 17,113<br />
Potassium 44<br />
Potatoes 59,90<br />
Poverty Eradication Action Plan (PEAP) 55<br />
Power generation 10<br />
Pre- Cambrian age 3,18<br />
Predominant 44<br />
Primary 44<br />
Primary Schools 19<br />
Producers 62<br />
Production 21,62<br />
Productivity 55<br />
Protected 39<br />
Q<br />
QENP 153<br />
Quartz 44<br />
Queen Elizabeth 39<br />
Queen Elizabeth National Park (QENP) 152<br />
R<br />
Rainfall 3, 5, 7, 6, 9<br />
Rainforests 66,166<br />
Rakai 58,85<br />
Rakai District 9,82<br />
Rakai hills 84<br />
Ramsar 26,27<br />
Ramsar Convention 26<br />
Reclamation <strong>of</strong> wetlands 87<br />
Refugee settlements 78<br />
Refugees 155<br />
Relative humidity 5<br />
Renewable 158<br />
Republic <strong>of</strong> <strong>Uganda</strong> 21<br />
Research 55<br />
Resources 26,158<br />
Restoration 88<br />
Rhino Camp 154,155<br />
Rhino Camp 78,79<br />
Rice 54,62<br />
Rice growing 7<br />
Rift valley area 72<br />
River basins 14<br />
River Congo 17<br />
River Kaku 99,100<br />
River Nile 14,15,56,78,99,100,103,104,<br />
135,144,166<br />
River Nile Basin 11<br />
River Semliki 99,140,142<br />
River Semliki system 100<br />
River valley 87<br />
Ruhuuma 97<br />
Rukiga 101<br />
Rural migration 169<br />
Rwampara 86<br />
Rwanda 3,135,144,145<br />
Rwebisengo 142<br />
Rwenzori 4,9,26,39<br />
Rwenzori Mountains 3,39<br />
Rwizi-Kibare 86<br />
Rwizi-Kibare-Bukora 86<br />
S<br />
Safe water 162<br />
Sango Bay 86<br />
Satellite 59,140<br />
Satellite image 149,150<br />
Satellite images 60,63,81<br />
Satellite towns 110<br />
Savannah ecosystem 39<br />
Savannah grasslands 39<br />
Science 55<br />
Scientific 39<br />
Sea level 3<br />
Seasonal 104<br />
Sembabule<br />
Semliki 39,142<br />
Semliki flats 142<br />
Semliki National Park 140,142<br />
Semliki River 139,141<br />
Sensitivity 18<br />
Shale 83<br />
Shale rock systems 83<br />
Sheep 59<br />
Shoreline 97<br />
Silt 145<br />
Silted streams 15<br />
Silting 11,101<br />
Sironko 107,175<br />
Small scale farming 172<br />
Social 28<br />
Socio-economic 135<br />
Soil degradation 86<br />
Soils 45<br />
Solanum tuberosum 90<br />
Solar energy 5<br />
Solar system x<br />
Solar system’s x<br />
Sorghum 61<br />
Soroti Catholic Diocese Integrated Development<br />
Organisation (SOCADIDO) 19<br />
South 9<br />
South Sudan 78,154<br />
South Western 9<br />
South western <strong>Uganda</strong> 58<br />
South-East 7<br />
Southeast 9<br />
Southern 5<br />
Southern Sudan 79,155<br />
Southern <strong>Uganda</strong> 8,9<br />
South-west 3,141<br />
Southwest 4<br />
South-western 101<br />
South-western highlands 86<br />
Spatial 5<br />
Speke 138<br />
Stanely 138<br />
State <strong>of</strong> Emergency 106<br />
Strategic plan 26<br />
Streams 104<br />
Sudan 135<br />
Sudanese 78,154<br />
Sudanese refugees 154<br />
Sudds 150<br />
Sugarcane 66<br />
Sun x<br />
Sunflower 61<br />
Surface water sources 162<br />
Suspended solids 145<br />
Sustainability 28,180<br />
Sustainable development 19,170<br />
Sustainable management 4, 27<br />
Symbiotic 44<br />
T<br />
Tadooba (kerosene candle) 179<br />
Tanzania 3,135,144,145<br />
Technological 5<br />
Technology 55,179<br />
Tectonic 3, 17, 25<br />
Telephone 55
Temperature 4, 9<br />
Temporal 5<br />
Termites 68<br />
Terrestrial eco-systems 10<br />
Teso 7,58<br />
Teso region 107<br />
Teso wetlands 107<br />
The Semliki River 142<br />
Timber extraction 89<br />
Timber resource 66<br />
Topographic 153<br />
Topomaps 141<br />
Tourism 139,170<br />
Tourist 66,166<br />
Tropical High Forests 175<br />
Tropical high forests 36<br />
U<br />
UBOS 4<br />
<strong>Uganda</strong> 2,3,4,5,6,7,8,10,11,14,17,19,21,<br />
24,25,26, 27,28,36,37,39,44,55,62,63,74,<br />
85,88,101,110,135,136,141,142,144,144,<br />
145,147,154,163,164,166,177,180<br />
<strong>Uganda</strong> terrestrial biodiversity 21<br />
<strong>Uganda</strong>’s Geography 1,3<br />
<strong>Uganda</strong>’s Relief <strong>of</strong> Land 1<br />
<strong>Uganda</strong>-Democratic Republic <strong>of</strong> Congo (DRC) 99,100<br />
Unsustainable 77<br />
Urbanization 110, 128, 129<br />
Urbanization Wind breaks 37<br />
Utilization 21<br />
V<br />
Vegetation cover 86, 172<br />
Ventilated Pit-Latrine (VIP) 178<br />
Venus x<br />
Vermin 39<br />
Vertisols44<br />
Victoria Nile 141<br />
Volcanic 17<br />
Volcanic activities 3<br />
Volcanic lava 96<br />
Volcanic soils 44<br />
W<br />
Wakiso 110,181<br />
Wamala Basin 92<br />
Water bodies 16<br />
Water catchments 86<br />
Water hyacinth 147<br />
Water levels 11<br />
Water quality129<br />
Water reservoirs107<br />
Water resources 10,11<br />
Weathering 44<br />
West Nile 154<br />
West Nile region 9,15,143<br />
West Nile Sudanese refugees 78<br />
Western 9,166<br />
Western region 166,176,181<br />
Western Rift Valley 17<br />
Western Rift valley 96<br />
Western Rift valley system 86<br />
Western <strong>Uganda</strong> 3,7,8,9,11<br />
Wetland 7,106<br />
Wetland encroachment 128<br />
Wetland system 97,129<br />
Wetlands 10,24,25,26,27,28<br />
Wetlands 79,107,128,155,158,182,<br />
Wildlife 39,158<br />
Wind speeds 5<br />
Wiringo 73<br />
Woodland 36,39,176<br />
World <strong>Environment</strong> Day 19<br />
205
The <strong>Uganda</strong> <strong>Atlas</strong> <strong>of</strong> <strong>Our</strong> <strong>Changing</strong> <strong>Environment</strong> is a unique publication by the Government <strong>of</strong> <strong>Uganda</strong> that is modelled<br />
after Africa: <strong>Atlas</strong> <strong>of</strong> <strong>Our</strong> <strong>Changing</strong> <strong>Environment</strong> previously published by the United Nations <strong>Environment</strong> Programme.<br />
This environmental atlas seeks to safeguard the country’s environment and inspire decision makers to action. In line<br />
with the One Planet Many People theme, <strong>Uganda</strong> in its natural splendour is undoubtedly the Pearl <strong>of</strong> Africa.<br />
The objectives <strong>of</strong> this atlas are to:<br />
• Integrate into and harmonize matters <strong>of</strong> the environment with <strong>Uganda</strong>’s development goals<br />
• Make use <strong>of</strong> satellite images to provide evidence on the country’s changing environment<br />
The <strong>Atlas</strong> reinforces the core values and aspirations <strong>of</strong> the National Sustainable Development Strategy and<br />
Vision 2025, which are major cornerstones linking the country’s environmental outlook to its dynamic society. It<br />
further reaffirms <strong>Uganda</strong>’s commitment to meeting Millennium Development Goal (MDG) No. 7, the targets <strong>of</strong> the<br />
Government’s “Prosperity For All (PFA)” Programme, and ensuring environmental sustainability. In our fast changing<br />
world characterized by increased human activities, the <strong>Atlas</strong> documents and quantifies environmental changes.<br />
It combines ground photography and a bird’s eye view <strong>of</strong> current and historical satellite imagery, illustrating<br />
extensive scientific evidence <strong>of</strong> our changing environment.