Document - UNEP/GRID-Sioux Falls
Document - UNEP/GRID-Sioux Falls
Document - UNEP/GRID-Sioux Falls

Create successful ePaper yourself
Turn your PDF publications into a flip-book with our unique Google optimized e-Paper software.
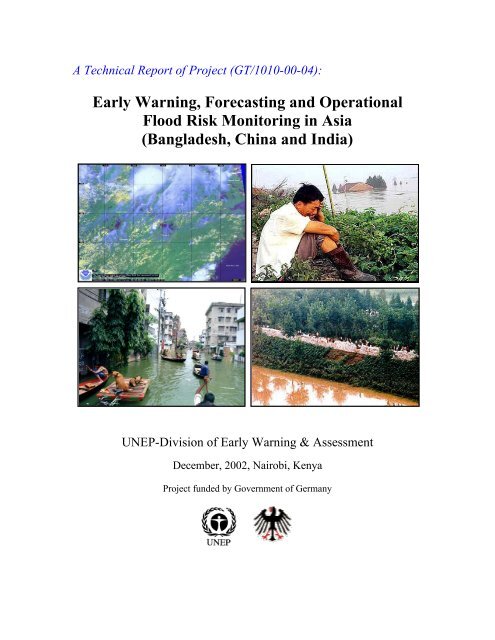
A Technical Report of Project (GT/1010-00-04):<br />
Early Warning, Forecasting and Operational<br />
Flood Risk Monitoring in Asia<br />
(Bangladesh, China and India)<br />
<strong>UNEP</strong>-Division of Early Warning & Assessment<br />
December, 2002, Nairobi, Kenya<br />
Project funded by Government of Germany
Technical report of project (GT/1010-00-04)<br />
Preface<br />
Floods are one of the most common natural disasters throughout the globe. Due to high<br />
population density along rivers especially in Asian countries such as Bangladesh, China<br />
and India, floods cause huge losses of lives and property every year. It is proposed to<br />
develop an operational flood risk monitoring system for flood-affected developing<br />
countries using various factors leading to floods. Through this project, numerous<br />
parameters will be brought together into a Geographic Information System (GIS) for<br />
selected pilot river basins in the Asian region. This will demonstrate to countries affected<br />
by floods the usefulness of GIS systems to visualize the onset of floods, the probability of<br />
floods and how floods affect areas. The output of the proposed work would be used by<br />
<strong>UNEP</strong> in providing advisory services based on sound scientific methods related to early<br />
warning systems suitable for developing countries to avoid enormous damages caused by<br />
frequent floods.<br />
This project was implemented by the United Nations Environment Programme – Division<br />
of Early Warning and Assessment (<strong>UNEP</strong>/DEWA) and was funded by the German<br />
Government, in cooperation with the U.S. Geological Survey (USGS) EROS Data Center<br />
(EDC). The following people contributed to the report:<br />
Staff from <strong>UNEP</strong>/DEWA-North America, USGS EDC:<br />
Dr. Ashbindu Singh<br />
Dr. Eugene A. Fosnight<br />
Ms. Jane S. Smith<br />
Mr. Mark Ernste<br />
Ms. Kim Giese<br />
Scientists from three countries:<br />
Dr. Hua Shi (China)<br />
Dr. Ramesh Singh (India)<br />
Mr. Nazmul Hossain (Bangladesh)<br />
2
Technical report of project (GT/1010-00-04)<br />
For bibliographic and reference purposes this report should be cited as:<br />
<strong>UNEP</strong> (2002): Early Warning, Forecasting and Operational Flood Risk Monitoring in<br />
Asia (Bangladesh, China and India), A Technical Report of Project (GT/1010-00-04):<br />
Division of Early Warning and Assessment (DEWA), United Nations Environment<br />
Programme (<strong>UNEP</strong>), P.O. Box 30552, Nairobi, Kenya<br />
Disclaimers<br />
The views expressed in this publication are not necessarily those of the agencies involved<br />
in this project. The designations employed and the presentations do not imply the<br />
expression of any opinion whatsoever on the part of cooperating agencies concerning the<br />
legal status of any country, territory, city, or area or its authorities, or of the delineation of<br />
its frontiers or boundaries.<br />
Mention of a commercial company or product in this report does not imply endorsement<br />
by the United Nations Environment Programme. The use of information from this<br />
publication concerning proprietary products for publicity or advertising purposes is not<br />
permitted. Trademark names and symbols are used in an editorial fashion with no<br />
intention of infringement on trademark or copyright laws. We regret any errors or<br />
omissions that may have been unwittingly made.<br />
For further copies of the report, please contact:<br />
Dr. Ashbindu Singh, Regional Coordinator<br />
<strong>UNEP</strong>/Division of Early Warning & Assessment-North America<br />
USGS EROS Data Center, <strong>Sioux</strong> <strong>Falls</strong>, SD 57198-001 USA<br />
Tel: 1-605-594-6117, Fax: 1-605-594-6119, Email: singh@usgs.gov<br />
3
Technical report of project (GT/1010-00-04)<br />
Main Findings<br />
• A number of techniques and models related to the early warning and forecasting<br />
of floods have been developed by many scientists and various organizations.<br />
• From 1960 to 1999, floods accounted for about one third of all natural<br />
catastrophes, caused more than half of all fatalities, and were responsible for a<br />
third of overall economic losses.<br />
• Less than half of all flood disasters occurred in Asia; however, over 80% of the<br />
people killed, affected or homeless were located in this continent.<br />
• There are on average 509 people/km 2 in the Yangtze Basin and 999 people/km 2 in<br />
Ganges/Brahmaputra Basin, compared to 137 people/km 2 in China and 367<br />
people/km 2 in India and Bangladesh.<br />
• About 500 million people, 50% of the population in India and Bangladesh, and<br />
about 300 million people, or about 25% of the population of China, live within<br />
these two basins.<br />
• The population in these three countries has increased from 954 million to 2,411<br />
million in the last 50 years.<br />
• In the Ganges basin, 60.2% of the area is under high population pressure. In the<br />
Yangtze basin, 60% of the area is under high population pressure.<br />
• In the Ganges/Brahmaputra basin, about 6.5% of the land has been accorded some<br />
sort of formal protection.<br />
• In the Yangtze basin, about 7.8% of the land has been accorded some sort of<br />
formal protection. Forests, especially tropical and sub-tropical forests are<br />
biologically the most diverse lands and home to thousands of endemic species.<br />
• Worldwide, 29.8% of the Ganges/Brahmaputra basin and 15.1% of the Yangtze<br />
basin are “bright hot” in the progress of economic development in the countries of<br />
India, China and Bangladesh; at the same time, they are “hotspots" for<br />
biodiversity.<br />
• Of the 25 total hotspots around the world, 2 lie partially within the Yangtze basin.<br />
The mountains of south central China are mostly located in the Yangtze basin and<br />
part of the Indo-Burma hotspot lies within the Yangtze basin. The Indo-Burma<br />
hotspot is largely located in the Ganges/Brahmaputra basin.<br />
• Population pressure is high in the portions of the hotspots that lie in the two<br />
basins, with 27.5 million people at risk in high-density areas.<br />
• Extensive use of these two basins for human activity has led to conflicts between<br />
resource use and environmental quality in these areas.<br />
• Environmental vulnerability is recognized due to recent advances in spatial<br />
information technologies which show that physical changes in the environment,<br />
increasing storm activity, floods and unusual weather patterns have some links to<br />
global climate change.<br />
• The human impact on the environment increases environmental vulnerability,<br />
hopefully increasing human awareness and stimulating human efforts to protect<br />
the environment.<br />
4
Technical report of project (GT/1010-00-04)<br />
Table of contents<br />
Preface .2<br />
Main findings .4<br />
List of figures and tables .9<br />
1 Introduction ...12<br />
2 About floods ...15<br />
2.1 Definitions ...15<br />
2.2 Floods as a hazard ...16<br />
2.2.1 Flooding as a natural hazard ...16<br />
2.2.2 Global patterns and trends ...19<br />
2.3 Types of floods ...21<br />
2.3.1 River floods ...21<br />
2.3.2 Coastal floods ...21<br />
2.3.3 Other flood types from a different perspective ...22<br />
2.4 Causes of floods ...23<br />
2.4.1 General causes of flood ...23<br />
2.4.2 Short-term causes ...24<br />
2.4.3 Long-term causes ...25<br />
2.4.4 Meteorological causes of floods in Asian countries ...28<br />
2.4.5 Floods with special events ...33<br />
2.5 Flood-intensifying factors and condition ...34<br />
• Basin characteristics ...35<br />
• Network characteristics ...35<br />
• Channel characteristics ...35<br />
2.6 Flood alleviation ...35<br />
2.7 Human Causes of flood hazard ...36<br />
3 Damage due to floods in Bangladesh, China and<br />
India ... ...37<br />
3.1 Damage due to floods ...37<br />
3.1.1 Floods in Bangladesh ...38<br />
3.1.2 Floods in China ...42<br />
3.1.3 Floods in India ...43<br />
3.2 Historical analysis of floods ...47<br />
3.2.1 Location of large flood events in Bangladesh, China and India.... 47<br />
3.2.2 Ganges/Brahmaputra and Yangtze River Basins .. ...49<br />
5
Technical report of project (GT/1010-00-04)<br />
4 Parameters for risk monitoring, early warning and<br />
forecasting of floods .. ...54<br />
4.1 General Parameters for risk monitoring, early warning and<br />
forecasting of floods ...54<br />
4.2 Data requirements ...55<br />
5 Review of methodologies in some developed<br />
countries ...57<br />
5.1 History of Flood Warnings ...57<br />
5.1.1 From the 1970s to the 1990s ...58<br />
5.1.2 Artificial Neural Network Model ...60<br />
5.2 Flood prediction in USA ........................................................................61<br />
5.2.1 Hydro-meteorological Data ...62<br />
5.2.2 National Weather Service River Forecast System ...63<br />
5.2.3 Recent advances associated with flood forecast and warning<br />
systems (University of Virginia, Charlottesville) ...64<br />
5.2.4 Flood Warning Systems ...69<br />
5.2.5 NOAA ...69<br />
5.3 Flood Warning Services of Bureau of Meteorology (Australia) ...72<br />
5.4 Atmospheric and Hydrological Model for Flood Forecasting<br />
(Canadian model) ...76<br />
5.4.1 WATFLOOD ...77<br />
5.4.2 Quantitative Precipitation Estimation for Stream-flow Modeling in<br />
Ontario, Canada ...80<br />
5.5 Wide Area Flood Risk Monitoring Model ...81<br />
5.6 MIKE-11 Flood Forecasting System (Danish) ...81<br />
5.7 European Flood Forecasting System (EFFS) ...81<br />
5.7.1 Prediction and Mitigation of Flash Floods ...82<br />
5.7.2 Warning systems and new technologies ...82<br />
5.7.3 Integrated hydro-meteorological approaches ...83<br />
5.8 Flood warning from space in Europe .. .84<br />
5.9 Wave Current Information System (WAVCIS) ...86<br />
5.10 DECIDE Belgium Flood project (Earth Observation Technologies for<br />
Decision Support Demonstrations - The Flood Case) ...87<br />
5.10.1 Scientific Objectives ...88<br />
5.10.2 Statistical versus deterministic methods ...89<br />
6
Technical report of project (GT/1010-00-04)<br />
5.11 Flood Forecasting Using SSM/I data ...90<br />
6 Flood forecasting and warning in developing<br />
countries ...94<br />
6.1 Flood forecasting and warning in Bangladesh ...94<br />
6.2 Flood forecasting and warning in China ...97<br />
6.3 Flood forecasting and warning in India ...98<br />
6.4 Other countries and regions .105<br />
6.4.1 Floods in Pakistan .105<br />
6.4.2 Flash floods in the Indus river basin .105<br />
6.5 Stream Flow Model for Africa .105<br />
6.5.1 Topography .107<br />
6.5.2 Land Cover .108<br />
6.5.3 Soil .108<br />
6.5.4 Model Forcing .109<br />
6.5.5 Satellite Rainfall Estimates (RFE) .109<br />
6.5.6 Integrating Satellite Rainfall Estimates with Digital River Basin<br />
Maps .110<br />
6.5.7 Potential Evapotranspiration (PET) .111<br />
6.5.8 Stream Flow Model Flow Chart .111<br />
6.5.9 Data .112<br />
6.5.10 Daily Prediction Hydrographs .113<br />
6.5.11 Rainfall estimates .113<br />
6.5.12 Wide-Area Flood Risk Monitoring Model .113<br />
6.6 Earth observation and remote sensing a tool for developing early<br />
system .113<br />
6.6.1 Characteristics of remote sensing technologies .114<br />
6.6.2 Telecommunications technology for early warning .116<br />
6.6.3 Towards a global system .117<br />
6.7 World hydrological cycle observing system (WHYCOS) .119<br />
6.7.1 The need for WHYCOS .119<br />
6.7.2 WHYCOS concept .120<br />
6.7.3 WHYCOS data network .120<br />
6.7.4 Working of WHYCOS .121<br />
6.7.5 WHYCOS, other observing systems and data exchange .122<br />
6.7.6 Regional databases .123<br />
6.8 The Global Climate Observing System .125<br />
6.9 Global Atmospheric Watch (GAW) .125<br />
6.10 Foreign assistant in Central America as an example .125<br />
7
Technical report of project (GT/1010-00-04)<br />
6.10.1 Early warning preparedness .125<br />
6.10.2 Coastal assistance as an example .126<br />
7 Study areas and database development .128<br />
7.1 Survey of study areas .128<br />
7.1.1 Selection of t he study areas .128<br />
7.1.2 Basic information of the study areas .128<br />
7.2 Database development .136<br />
7.2.1 <strong>UNEP</strong>/<strong>GRID</strong> database .136<br />
7.2.2 The spatial dimension of information .136<br />
7.2.3 Development of digital data .136<br />
8 Assessing human vulnerability to floods in two<br />
basins .. .142<br />
8.1 Introduction .142<br />
8.2 Key factors that affect people and the environment .143<br />
8.2.1 Main disaster — flood .143<br />
8.2.2 Population concentration .145<br />
8.2.3 Land cover change .146<br />
8.3 Methodology .147<br />
8.3.1 Population density .147<br />
8.3.2 Land cover distributi on .147<br />
8.3.3 Designated protection status .147<br />
8.3.4 Biodiversity hotspots .148<br />
8.4 The assessment of environment in basins .148<br />
8.4.1 Population distribution .148<br />
8.4.2 Distribution and pattern of land cover .149<br />
8.4.3 Status of designated protected areas and bio-diversity hotspots<br />
.151<br />
8.4.4 Surface topographic characteristics .153<br />
8.5 Vulnerability due to floods .153<br />
9 Conclusions and recommendations .156<br />
References .159<br />
Acronyms and Abbreviations .167<br />
8
Technical report of project (GT/1010-00-04)<br />
List of figures and tables<br />
Figures<br />
Cover 1 Yangtze River region in eastern China which experienced serious flooding<br />
over a period of several weeks (NOAA image)<br />
Cover 2 Flooded Yangtze river of China in 1998, the farmer lost his house (CNN<br />
photo)<br />
Cover 3 The flood scene of Dhaka in 1998 showing various transportation tools<br />
used by people (FHI photo)<br />
Cover 4 Flood of 1998. Banking on bags: soldiers and volunteers reinforce the<br />
banks of Donting Lake in the Hunan province of China as rising water<br />
levels prepare to cross record highs (AFP photo)<br />
Fig. 1-1 Flood tracks: A train brimming with passengers moves through flood<br />
water on September 9, 1998 at Arikhola, 40 km from Dhaka<br />
Fig. 1-2 Image: Cyclone in India<br />
Fig. 2.1-1 Flood in Bangladesh; the photo was taken in Bangladesh’s Satkhira<br />
Province during the early days of flooding in October 1998<br />
Fig. 2.2-1 Flood in Bangladesh; the photo was taken in Bangladesh’s Satkhira<br />
Province during the early days of flooding in October 1998<br />
Fig. 2.2-2 Sensitivity to flood hazards expressed in relation to the variability of river<br />
discharge and the degree of socio-economic tolerance at a site<br />
Fig. 2.2-3 Schematic illustration showing human vulnerability to flood hazard caused<br />
by changes in the distribution of flood events and decrease in socioeconomic<br />
tolerance at a site<br />
Fig. 2.2-4 Increase in recorded flood disasters throughout the world according to two<br />
databases from 1945 to 1986 and 1964 to 1995<br />
Fig. 2.4-1 Causes of flood and flood-intensifying factors<br />
Fig. 2.4-2 A scene of a house during a Bangladesh flood<br />
Fig. 2.4-3 A family tries to make its way to a safer place along a submerged express<br />
way in Kendrapara district<br />
Fig. 2.7-1 Flood in Bangladesh<br />
Fig. 3.1-1 Total number of people reported killed, by continent and by type of<br />
phenomenon (1990 to 1999)<br />
Fig. 3.1-2 Major disasters of the world<br />
Fig. 3.1-3 Flood status and river system of Bangladesh<br />
Fig. 3.1-4 A son carries his mother on his back as he wades through flood waters to<br />
reach higher land in Satkhira<br />
Fig. 3.1-5 A Chinese man struggles to carry his bicycle through fast-flowing waters<br />
in a flooded street in the Daijiashan district of Wuhan, near the Yangtze<br />
River yesterday. (Photo by The Associated Press, 1998)<br />
Fig. 3.1-6 Nearly 40 million hectares of land is vulnerable to floods, with about eight<br />
million hectares flooded annually<br />
Fig. 3.1-7 An aerial view shows rising floodwaters at Karnool town in the Cuddapah<br />
district, some 420 km south of Hyderabad October 20, 2001. Andhra<br />
Pradesh on Saturday began counting losses and providing relief to victims<br />
of floods in which at least 73 people were killed earlier this week<br />
9
Technical report of project (GT/1010-00-04)<br />
Fig. 3.2-1 Location map of large flood events in Bangladesh, China and India from<br />
1985 to 2001<br />
Fig. 4.1-1 Global Observing System<br />
Fig. 4.2-1 Flood image in China<br />
Fig. 5.2-1 Flow chart of National Weather Service’s office of Hydrology<br />
Fig. 5.2-2 (a) National Weather Service Office and Forecast Center<br />
Fig. 5.2-2 (b) National Weather Service Office and Forecast Center<br />
Fig. 5.2-3 Reflectivity and approximate surface rainfall rates for each category<br />
Fig. 5.2-4 Radar reflectivity from radar coded messages meteorological development<br />
laboratory national weather service<br />
Fig. 5.3-1 Twenty-four hour rainfalls in Australia<br />
Fig. 5.3-2 Generalized Short-Duration Method of estimating PMP<br />
Fig. 5.3-3 Generalized Tropical Storm Method for estimating PMP<br />
Fig. 5.4-1 Group response unit and runoff routing concept<br />
Fig. 5.4-2 Schematic of the GRU pixel grouping model and channel routing scheme<br />
Fig. 5.8-1 Various Steps of LISFLOOD<br />
Fig. 5.9-1 Wave–current monitoring system for coastal Louisiana<br />
Fig. 5.10-1 Walloon territory and Lesse River<br />
Fig. 5.11-1 Weekly averaged plots of SWE over the northern part of India for 1995<br />
Fig. 5.11-2 Soil wetness index (SWI)<br />
Fig. 6.1-1 Shows various forecast stations<br />
Fig. 6.1-2 Typical hydrograph seen through web page<br />
Fig. 6.1-3 Shows area with expected rainfall intensity<br />
Fig. 6.1-4 Shows inundation map<br />
Fig. 6.3-1 Shows density of meteorological stations in India<br />
Fig. 6.3-2 Shows storm detection radar and cyclone warning radar networks in India<br />
Fig. 6.3-3 Shows storm detection radar and cyclone warning radar networks in India<br />
Fig. 6.3-4 WHYCOS general scheme of data collection and dissemination network<br />
Fig. 6.5-1 Conception of the Stream Flow Model (SFM)<br />
Fig. 6.5-2 Stream Flow Model Inputs<br />
Fig. 6.5-3 Other Derivatives of USGS 1 km DEM<br />
Fig. 6.5-4 Land cover in Africa<br />
Fig. 6.5-5 FAO Digital soil map of Africa<br />
Fig. 6.5-6 (a) Current Rainfall Estimate, NOAA<br />
Fig. 6.5-6 (b) Quantitative Precipitation Forecast, AFWA<br />
Fig. 6.5-7 Integrating Satellite Rainfall Estimates with Digital river basin Map<br />
Fig. 6.5-8 Potential Evapotranspiration, EROS<br />
Fig. 6.5-9 FEWS Flood Risk Monitoring System Flow Diagram<br />
Fig. 6.7-1 WHYCOS regional components around the world<br />
Fig. 6.7-2 Global Precipitation Gauges<br />
Fig. 6.7-3 Shows about 200,000 routinely operating recording precipitation gauges<br />
around the world during the last 4 decades<br />
Fig. 7.1-1 The Maha Kumbh Mela (great urn fair) is the greatest festival in the Hindu<br />
religious calendar<br />
Fig. 7.1-2 Map of the Ganges/Brahmaputra River basin<br />
Fig. 7.1-3 Image of Three Gorges of Yangtze River in China<br />
10
Technical report of project (GT/1010-00-04)<br />
Fig. 7.1-4 Map of the Yangtze River basin, China<br />
Fig. 8.1-1 Tropical cyclone close to the east coast of India<br />
Fig. 8.2-2 Flood in China, Image: RADARSAT Tracks Yangtze River flooding in<br />
China Aug 12, 1998<br />
Fig. 8.2-2 (a) Flood image of Yangtze River basin<br />
Fig. 8.2-3 (b) A life boat during flood in Bangladesh<br />
Fig. 8.2-2 (c) A week after the flood, villages off the Cuttack Paradeep expressway<br />
remain marooned, India<br />
Fig. 8.2-3 Over two million people have to get home after a religious festival! Why<br />
not take the train? No, not all at once! Scenes like this are a photographer's<br />
paradise. Make sure you find a suitable spot. Have all your gear ready and<br />
then shoot to your heart's content. If anything goes wrong, there's always<br />
another chance at next year's festival.<br />
Fig. 8.2-4 Much of the high human loss that occurs during natural disasters happens<br />
because of high population density. The photo above shows a crowded<br />
fish market place in India<br />
Fig. 8.2-5 Land cover change: Degradation in protected areas: the case of Wolong<br />
nature reserve located upstream of Yangtze River, China<br />
Fig.8.4-1 (a) Population density in Ganges/Brahmaputra<br />
Fig.8.4-1 (b) Population density in Yangtze basin<br />
Fig. 8.4-2 (a) Land cover distribution of Ganges/Brahmaputra basin<br />
Fig. 8.4-2 (b) Land cover distribution of Yangtze basin<br />
Fig. 8.4-3 A DEM model map of Ganges/Brahamputra River basin and Yangtze<br />
River basin<br />
Fig. 8.5-1 People try to collect pure drinking water that was scarce during the flood<br />
in Bangladesh. (Source: Daily Tttefaq, 1998)<br />
Fig. 8.5-2 The remains submerged a week after the first flooding in India<br />
Fig. 9.0-1 Yangtze River Flood (July-August 1998)<br />
Tables<br />
Tab. 2.2-1 Percentage of all recorded flood disasters and associated flood impacts<br />
1964-96 by continental area (excluding USA)<br />
Tab. 2.2-2 Total number of people reported killed, by continent and by type of<br />
phenomenon (1990-1999)<br />
Tab. 2.4-1 Principal Glacier-fed river system of the Himalaya (after Hasnain, 1999)<br />
Tab. 3.1-1 A comparison of number of reported natural disaster events and fatalities<br />
in Bangladesh and USA (1990-1999)<br />
Tab. 3.1-2 Number of people killed by major flood in Yangtze River from 1931-1954<br />
Tab. 3.1-3 The average loss over the past four decades<br />
Tab. 3.2-1 Large Flood Events in Ganges/Brahmaputra basin and Yangtze basin of<br />
Bangladesh, China and India during 1985 - 2001<br />
Tab. 8.4-1 Distribution of population pressure in two basins with three countries<br />
Tab. 8.4-2 Land cover distribution in China with Protection status<br />
11
Technical report of project (GT/1010-00-04)<br />
1 Introduction<br />
Large river floodplains around the world support heavy population settlements,<br />
where development goals are most often improved navigation, enhanced agricultural<br />
production and flood protection. Floods are one of the most common devastating natural<br />
hazards in the world, claiming more lives and property than any other natural disaster.<br />
Floods are frequent and a common feature of every year, especially after heavy rains,<br />
heavy thunderstorms, winter snow thaws, strong cyclones, and monsoons. Floods can be<br />
slow or fast rising depending upon the amount of rains and snow melt, and generally<br />
develop over a period of days. Dam failures due to floods are potentially the worst<br />
events, often caused by poor design or structural damage due to a major event such as an<br />
earthquake.<br />
Flood disasters account for about a third of all natural disasters throughout the<br />
world and are responsible for more than half of the fatalities (Berz, 2000). The trend<br />
analyses reveal that major flood disasters and the losses generated by them have<br />
increased drastically in recent years. There is a distinct increase with respect to economic<br />
losses and the rising numbers of events that attracts the attention of international<br />
agencies. Flood losses in the U.S. now exceed US $5 billion in individual years (NOAA,<br />
1994). Flood damage was estimated between US $350-400 million per year in Australia<br />
(Smith and Word, 1998). In the last 10 years, losses amounting to more than US $250<br />
billion have been borne by societies all over the world to compensate for the<br />
consequences of floods (Berz, 2000). Flooding in countries like Bangladesh, China and<br />
India is frequent enough to be considered an annual event.<br />
People all over the world have learned to live with floods. However, the<br />
population sometimes is taken completely by surprise when a river or the sea rises to an<br />
unacceptable level. In this context, three aspects are very important: (i) the dramatic<br />
increase in the world’s population which creates the necessity to settle in risk prone areas;<br />
(ii) the migration of refugees to an unfamiliar environment; and (iii) increased population<br />
mobility and the desire of people to live in areas with a good natural environment and<br />
certain climate. All these factors bring people into areas whose natural features they do<br />
not know. They are not aware of what can happen and they have no idea how to behave if<br />
nature strikes. Even if people have experienced a disaster themselves, they tend to forget<br />
its lessons within a few years (Berz, 2000).<br />
Economically, floods are a leading cause of losses from natural events. One flood<br />
is not only a single disaster event, but creates a cumulative loss from related small and<br />
medium sized events. The money spent worldwide on flood control (dykes, reservoirs,<br />
barrage, etc.) is far greater than that spent on protection against other impacts from<br />
nature.<br />
A comparison of flooding and all other natural hazards in long-term analyses<br />
(1988-97) reveals that (Berz, 2000):<br />
• Floods account for about a third of all natural catastrophes.<br />
• Floods cause more than half of all fatalities.<br />
• Floods are responsible for a third of the overall economic loss.<br />
• Floods’ share in insured losses is relatively small, with an average of less than<br />
10%.<br />
12
Technical report of project (GT/1010-00-04)<br />
A flood is defined as any relatively high water flow that overtops the natural or<br />
artificial banks in any portion of a river or stream. When a bank overflows, the water<br />
spreads over the flood plain and generally becomes a hazard to society. Floods are by and<br />
large a function of location, intensity, volume and duration of precipitation. Floods are<br />
caused by excessive rainfall, snowmelt or dam failure. The rivers generally originate<br />
from mountains. Excessive rainfall or snowmelt in mountainous regions results in<br />
flooded rivers. Mountainous regions become more vulnerable to landslides,<br />
hyperconcentrated flows, debris flows, etc. (Scofield and Morgottini, 1999). In<br />
developing countries such as India, China, Bangladesh, Indonesia and Vietnam, due to<br />
water scarcity, large populations live along the major rivers and as a result the floods are<br />
more devastating, killing millions of people and damaging property every few years.<br />
Fig. 1-1 Flood tracks: A train brimming with passengers move through floodwaters on<br />
September 9, 1998 at Arikhola, 40 kilometers from Dhaka (Source: AFP, 1998)<br />
This study presents an overview of operational flood risk monitoring, early<br />
warning and forecasting in Asia (Bangladesh, China and India), with a focus on the<br />
Ganges/Brahmaputra and Yangtze River basins. The report looks at the flood situation in<br />
each basin in a regional context, and recommends future directions to develop an<br />
operational flood risk monitoring system for flood-affected developing countries.<br />
Through this project, numerous parameters have been brought together into a Geographic<br />
Information System (GIS) for selected pilot river basins in the Asian region. This<br />
demonstrates the usefulness of GIS systems to visualize the onset of floods, chances of<br />
floods and prediction of flood-affected areas. The output of the proposed work could be<br />
used by the United Nations Environment Programme (<strong>UNEP</strong>) to provide advisory<br />
services based on sound scientific methods related to early warning systems suitable for<br />
developing countries to avoid enormous damages caused by frequent floods.<br />
13
Technical report of project (GT/1010-00-04)<br />
The main objectives of this study are:<br />
• To review early warning and flood forecasting tools and models being used by<br />
developed countries and assess the gap in knowledge and technology being<br />
deployed by developing countries. This should assist in knowledge transfer<br />
related to operational systems for flood risk monitoring using the latest tools and<br />
technologies.<br />
• To compile and analyze relevant databases on numerous parameters using a<br />
Geographic Information System (GIS) for the two river basins to demonstrate the<br />
usefulness of GIS in visualizing the early warning of floods, occurrence of floods,<br />
and total affected areas.<br />
• To assess human vulnerability to, and coping capacity for, environmental threats<br />
in the two basins using population pressure, land cover, topographical<br />
characteristics of the landscape, and the probability of natural hazards (flood).<br />
Fig.1-2 Image: Cyclone in India (Source: NNRMS Bulletin-24, 2000, Department of Space,<br />
India)<br />
14
Technical report of project (GT/1010-00-04)<br />
2 About floods<br />
Of all the natural hazards capable of producing a disaster, a flood is by far the<br />
most common in causing loss of life, human suffering, inconvenience and widespread<br />
damage to buildings, structures, crops and infrastructure. Floods can disrupt personal,<br />
economic, and social activities and set back a nation’s security and development by<br />
destroying roads, buildings and other assets.<br />
Flooding is a natural feature of drainage systems and rivers and streams. When<br />
drainage channels are filled and rivers and streams can no longer accommodate excessive<br />
water generated by severe weather conditions, the channels overflow their natural or<br />
artificial banks and water enters the surrounding lands causing flooding.<br />
Severe weather conditions which lead to intense rainfall, such as thunderstorms,<br />
cold fronts, tropical waves, tropical depressions, tropical storms and hurricanes can lead<br />
to flooding.<br />
2.1 The definitions<br />
Floods are physical events and natural hazards. Floods can be slow or fast rising<br />
depending upon the amount of rains and snow melt, generally developing over a period<br />
of days.<br />
Fig. 2.1-1 Flood in Bangladesh; the photo was taken in Bangladesh’s Satkhira Province<br />
during the early days of flooding in October 1998 (Source: FHI, 1998)<br />
15
Technical report of project (GT/1010-00-04)<br />
A number of definitions related to floods have been proposed by various<br />
organizations and many scientists. Some of these definitions are summarized below.<br />
A flood is defined as “any relatively high water flow that overtops the natural or<br />
artificial banks in any portion of a river or stream.” When a bank overflows; the water<br />
spreads over the flood plain and generally becomes a hazard to society. Floods are caused<br />
by excessive rainfall, snowmelt or dam failure. The rivers generally originate from<br />
mountains. Excessive rainfall or snowmelt in mountainous regions results in flooded<br />
rivers. Mountainous regions become more vulnerable to landslides, hyperconcentrated<br />
flows, debris flows, etc. (Scofield and Morgottini, 1999).<br />
Smith and Word (1998) have pointed out that the terms ‘floods’, ‘flooding’ and<br />
‘flood hazard’ cover a very wide range of phenomena, not all of which are treated with<br />
equal emphasis …… The main focus in this project is on river floods, with low-lying<br />
deltas and estuaries of many of the world’s major rivers exposed to the hazards of<br />
flooding from the sea by storm surges and tsunami, as is all low-lying coastal land.<br />
For present purposes, a meaningful definition of a flood should not only<br />
incorporate the notions of inundation and damage, but also move beyond the restrictive<br />
definitions of river floods given. A flood is an overflowing of water from rivers onto<br />
land. Floods also occur when water levels of lakes, ponds, aquifers and estuaries exceed<br />
some critical value and inundate the adjacent land, or when the sea surges on coastal<br />
lands much above the average sea level. Nevertheless, floods are a natural phenomenon<br />
important to the life cycle of many biotas, not the least of which is mankind. Floods<br />
became a problem as humans began establishing farms and cities in the bottomlands of<br />
streams and rivers. In doing so, they not only expose their lives and properties to the<br />
ravages of floods, but also exacerbate floods by paving the soil and constructing stream<br />
channels. Over time, continued urbanization of natural floodplains has caused great<br />
annual losses of both wealth and human life. In this way, in many countries and regions<br />
of the world, floods are the most deadly hazards in terms of both loss of human lives and<br />
material damage (Fattorelli et al., 1999).<br />
2.2 Flood as hazards<br />
2.2.1 Flooding as a natural hazard<br />
Most of the natural hazards result from the potential for extreme geophysical<br />
events, such as floods, to create an unexpected threat to human life and property (Smith,<br />
1996). When severe floods occur in areas occupied by humans, they can create natural<br />
disasters that involve the loss of human life and property plus serious disruption to the<br />
ongoing activities of large urban and rural communities. Although the terms ‘natural<br />
hazards’ and ‘natural disasters’ emphasize the role of the geographical processes<br />
involved, these extreme events are increasingly recognized primarily as the ‘triggers’ of<br />
disaster, which often have more complex origins including many social and economic<br />
factors.<br />
A flood in a remote, unpopulated region is an extreme physical event of interest<br />
only to hydrologists. Entirely natural floodplains can be drastically changed – but not<br />
damaged – by the events that create them. Indeed, most floodplain ecosystems are geared<br />
to periodic inundation. Terms such as flood risk and flood losses are, therefore,<br />
16
Technical report of project (GT/1010-00-04)<br />
essentially human interpretations of the negative economic and social consequences of<br />
natural events. As with other human value judgments, different groups of people have<br />
been found to differ markedly in their selection and definition of the risks from flooding<br />
(Green et al., 1991). In addition, the flood risk in any given locality may be increased by<br />
human activity, such as unwise land-use practices related to flood control structures or by<br />
ineffective emergency planning. The real risk from floods stems from the likelihood that<br />
a major hazardous event will occur unexpectedly and that it will impact negatively on<br />
people and their welfare.<br />
Fig. 2.2-1 Flood in Bangladesh. (Source: FHI, 1998)<br />
Flood hazards result from a combination of physical exposure and human<br />
vulnerability reflected by key social-economic factors such as the number of people at<br />
risk in the floodplain or low-lying coastal zone, the extent of flood, and the ability of the<br />
population to anticipate and cope with hazard. It is the balance between these two<br />
elements, rather than the physical event itself, which defines natural hazard and<br />
determines the outcome of a natural disaster. In Fig. 2.2-2 Smith and Ward (1998) show<br />
variations of river stages through time in relation to the band of social and economic<br />
tolerance available at a hypothetical location. As long as the river flows close to the<br />
average or expected level, there is no hazard and the discharge is perceived as a resource<br />
because it supplies water for useful purposes, such as irrigation or water transport.<br />
However, when the river flow exceeds some predetermined threshold of local<br />
significance and extends outside the band of tolerance, it will cease to be beneficial and<br />
becomes hazardous. Thus, very low or very high flows will be considered to create a<br />
drought or a flood hazard, respectively.<br />
17
Technical report of project (GT/1010-00-04)<br />
Fig. 2.2-2 Sensitivity to flood hazard expressed in relation to the variability of river<br />
discharge and the degree of socio-economic tolerance at a site (Source: Modified from<br />
Hewitt and Burton, 1971)<br />
Fig. 2.2-3 A schematic illustration of increases in human vulnerability to flood hazard<br />
caused by changes in the distribution of flood events and decrease in socio-economic<br />
tolerance at a site (Source: After De Vries, 1985, and Smith and Ward, 1998)<br />
The relationship between physical exposure and human vulnerability is highly<br />
dynamic and can change through time. Fig. 2.2-3 shows various possibilities giving rise<br />
to increased flood risk. Fig. 2.2-3 (A) represents the effect of a constant band of<br />
18
Technical report of project (GT/1010-00-04)<br />
socioeconomic tolerance and constant variability of flows but a trend to higher mean<br />
values leading to more frequent breaches of the tolerance threshold, perhaps due to<br />
channel constructions which limit the capacity of the river banks to contain specified<br />
flood flows. Fig. 2.2-3 (B) represents a constant band of tolerance and constant mean<br />
value of flow but an enhanced risk arising from increased variability of flows. This might<br />
be due to a shift in climate leading to more intense rainstorms. In fig. 2.2-3 (C) the flow<br />
regime of the river does not change but the socio-economic band of tolerance narrows,<br />
perhaps because of floodplain invasion placing more people and property at risk (Smith<br />
and Ward, 1998).<br />
Another important attribute of flood risk is the relative unpredictability of the<br />
event. The difficulty of issuing precise warnings of flood locations and their timing is a<br />
major cause of flood disaster, especially with flash floods. On the other hand, many rivers<br />
exhibit regular floods that, especially in large drainage basins, will rise slowly and<br />
predictably in seasonal ‘flood pulse’, thereby offering an opportunity for an efficient lossreducing<br />
response.<br />
2.2.2 Global patterns and trends<br />
Flooding along low-lying plains adjacent to rivers and coasts is commonly<br />
regarded as the most frequent and widespread natural hazard in the world. Floods<br />
regularly account for about one-third of all global disasters arising from geophysical<br />
hazards and adversely affect more people than any other natural hazard, apart from<br />
drought. This dominance is usually explained by the fact that the overtopping of natural<br />
or artificial boundaries of a watercourse, together with the submergence of coastal zones,<br />
is a frequent occurrence compared with the incidence of other hazards such as damaging<br />
earthquakes or major volcanic eruptions. In addition, the density of much floodplain and<br />
coastal settlement places large numbers of people at risk.<br />
Any estimate of a flood hazard is plagued by the problem of defining basic terms<br />
(e.g. ‘flood disaster’ or ‘flood-prone’) and the related inadequacy of recorded data on<br />
flood events and losses. In the absence of any agreed international database of flood<br />
disasters, it is difficult to authenticate claims about flood losses worldwide and any<br />
related trends.<br />
Area Events Deaths Affected Homeless Damage<br />
Africa 16.0 4.5 1.0 5.1 1.9<br />
Asia 41.1 82.2 95.3 85.1 65.6<br />
C. America 7.1 1.7 0.1 0.5 1.3<br />
Caribbean 3.2 1.2 0.3 0.2 0.2<br />
Europe 8.7 2.1 0.6 0.5 20.1<br />
Near East 4.1 1.5 0.2 1.0 0.7<br />
Pacific 1.2 0.1 0.0 0.0 0.2<br />
S. America 18.6 6.7 2.5 7.6 10.0<br />
Totals 100.0 100.0 100.0 100.0 100.0<br />
Table 2.2-1 Percentage of all recorded flood disasters and associated flood impacts 1964-<br />
96 by continental area (excluding USA) (Source: OFDA, 1996 and Smith, 1998)<br />
19
Technical report of project (GT/1010-00-04)<br />
.<br />
Fig. 2.2-4 The increase in recorded flood disasters throughout the world (Source: Data<br />
from Glickman et al., 1992, and OFDA, 1996)<br />
Because of differing definitions and more general reporting difficulties, all the<br />
resulting figures should be treated with caution. According to Gleckman et al. (1992),<br />
floods are responsible for 31% of the natural disasters that claimed 25 or more lives<br />
worldwide between 1945 and 1986. These data also show that, between 1945 and 1986,<br />
the average annual numbers of floods causing 25 or more deaths have more than tripled, a<br />
trend that is confirmed by the OFDA series from 1964 to 1996 (Fig. 2.2-4). The OFDA<br />
figures indicate that, since 1964, 835 floods that occurred outside the USA have killed<br />
over 130,000 people, rendered about 70 million homeless and adversely affected well<br />
over one billion humans. The direct economic cost of such flood disasters is estimated at<br />
over US $91 billion. The burden of flood disasters is most heavily borne by the<br />
impoverished countries of Asia. Table 2.2-1 shows that, while less than half of all flood<br />
disasters occurred in Asia, over 80% of people killed, affected or made homeless are<br />
located in this continent. Table 2.2-2 shows the total number of people reported killed by<br />
continent and by type of phenomenon.<br />
20
Technical report of project (GT/1010-00-04)<br />
US and Rest of<br />
Oceania Canada Americas Europe Africa Asia Total<br />
Slides 279 - 2010 644 225 5,500 8,658<br />
Droughts 98 0 - - 12 2,680 2,790<br />
Earthquakes 70 63 3,456 2,395 816 91,878 98,678<br />
Epidemics 115 138 11,985 411 57,082 14,316 84,047<br />
Extremes temperatures 27 1,218 780 954 102 5,974 9,055<br />
Floods 30 363 35,235 2,839 9,487 55,916 103,870<br />
Wild Fires 8 41 60 127 79 260 575<br />
Wind Storms 262 1,718 11,546 913 1,612 185,739 201,790<br />
Volcanoes 9 - 77 - - 994 1,080<br />
Other<br />
Disasters*<br />
Natural<br />
2,182 - 15 - - 489 2,686<br />
Non-Natural<br />
Disasters**<br />
534 - 12,353 7,832 16,136 42,453 79,308<br />
TOTAL 3,614 3,541 77,517 16,115 85,551 406,199 592,537<br />
Table 2.2-2 Total number of people reported killed, by continent and by type of<br />
phenomenon (1990-1999) (Source: IFRC World Disaster Report 2000. *Insect Infestation,<br />
Wave/Surge, **Industrial, Transport and Misc accidents)<br />
2.3 Type of floods<br />
Among the many classifications of floods, Smith and Ward (1998) classified<br />
floods as river floods and coastal floods.<br />
2.3.1 River floods<br />
• Floods in river valleys occur mostly on floodplains or wash lands as a result of<br />
flow exceeding the capacity of the stream channels and over spilling the natural<br />
banks or artificial embankments.<br />
• Sometimes inundation of the floodplain, or of other flat areas, occurs in wet<br />
conditions when an already shallow water table rises above the level of the<br />
ground surface. This type of water table flooding is often an immediate precursor<br />
of overspill flooding from the stream channels.<br />
• In very dry conditions, when the ground surface is baked hard or becomes<br />
crusted, extensive flat areas may be flooded by heavy rainfall pounding on the<br />
surface. This rainwater flooding is typical of arid and semi-arid environments.<br />
• Sheet wash flooding occurs by the unimpeded lateral spread of water moving<br />
down a previously dry or nearly dry valley bottom or alluvial fan. This is typical<br />
of arid and semi-arid areas where no clearly defined channels exist.<br />
• In urban areas, flooding often results from over spilling or surface pounding, as<br />
described above, but may also occur when urban storm water drains become<br />
supercharged and overflow (Smith and Ward, 1998).<br />
21
Technical report of project (GT/1010-00-04)<br />
2.3.2 Coastal floods<br />
• Floods in low-lying coastal areas, including estuaries and deltas, involve the<br />
inundation of land by brackish or saline water. Brackish-water floods result when<br />
river water overspills embankments in coastal reaches as normal flow into the sea<br />
is impeded by storm-surge conditions, or when large freshwater flood flows are<br />
moving down an estuary.<br />
• Direct inundation by saline water floods may occur when exceptionally large<br />
wind-generated waves are driven into semi-enclosed bays during severe storm or<br />
storm-surge conditions, or when so-called ‘tidal waves’, generated by tectonic<br />
activity, move into shallow coastal waters.<br />
2.3.3 Other flood types from a different perspective<br />
Flash floods<br />
These floods are frequently associated with violent, convection storms of a short<br />
duration. Flash flooding can occur in almost any area, but is most common in mountain<br />
districts subject to frequent severe thunderstorms. Flash floods are often the result of<br />
heavy rains of short duration falling over a small area. This particular type of flooding<br />
has been known to wash away roads and bridges, damage houses and drown livestock.<br />
Riverine floods<br />
A riverine flood occurs in the valley of a large river with many tributaries.<br />
Usually flooding develops from rainfall lasting for hours, sometimes days, and covering a<br />
wide area of the watershed.<br />
Single event floods<br />
This is the most common type of flooding in which widespread heavy rains of 2<br />
to 3 days’ duration over a drainage basin results in severe floods. Such heavy rains are<br />
associated with cyclonic disturbances, such as storms, slow moving depressions etc.,<br />
during the summer monsoon season when air moisture content is very high. In India most<br />
floods belong to this category.<br />
Multiple event floods<br />
Sometimes heavy rainfall occurs when successive weather disturbances follow<br />
each other closely. Floods in the Indo-Gangetic plains and central Indian regions often<br />
are caused by the passage of a series of upper air cyclonic circulations, low-pressure<br />
areas or depressions from the Bay of Bengal, more or less along the same track.<br />
Seasonal floods<br />
These are floods that occur during different seasons. The summer monsoon<br />
season experiences a large number of floods, since major storm activity occurs during<br />
this season. The southern half of the Indian peninsula experiences floods mostly during<br />
the winter monsoon season. These floods are caused by heavy rainfall over a drainage<br />
basin. However, floods can also occur due to unusually high water levels of lakes fed by<br />
22
Technical report of project (GT/1010-00-04)<br />
a river. Sometimes flood events are caused by events other than rainfall e.g. coastal<br />
floods, floods caused by dam failures and estuarine floods.<br />
Coastal floods (or tidal flooding)<br />
Storm surges, tidal waves or earthquakes occurring in the ocean generally cause<br />
these floods. The surge is the outcome of piling of seawater against the coast due to<br />
strong winds generated by a cyclonic storm. The surface waters are driven towards the<br />
coast, where due to shallow water the return flow is retarded by the frictional force of the<br />
seabed. If the surge takes place near the mouth of a river falling into the sea, the river<br />
flow is held up due to the surge that results in severe flooding over and near the coastal<br />
areas. Such coastal floods often occur along the east coast of India during summer and<br />
winter monsoon months due to the activity of tropical cyclones/depressions in the Bay of<br />
Bengal.<br />
Estuarine flood<br />
Estuaries are the only portions of the coastline where the normal tide meets a<br />
concentrated seaward flow of fresh water in a river. The interaction between the seaward<br />
flow of fresh water in the river and landward flow of saline water from the sea during<br />
high tides may result in opposing land water flows, causing a wall of water. Sometimes<br />
the funnel shape characteristic of many estuaries causes an increase in high water levels<br />
in the upper narrow reaches of the river. These types of floods are mostly experienced in<br />
deltaic areas of rivers along the coasts and are not considered serious floods.<br />
Apart from the above factors, occasionally Himalayan rivers experience minor to<br />
medium floods due to a sudden rise in temperature which causes quick melting of snow<br />
and glacier ice in the upper reaches of rivers. Floods also occur due to heavy rains over<br />
snowfields having thick snow cover. Such floods occur during the summer months in the<br />
plains area adjoining the Himalayas. Floods of this type are rather uncommon and occur<br />
mostly in the Himalayan valleys and do not cause large-scale destruction or damage on<br />
the plain.<br />
Floods caused by dam failure<br />
A dam failure or collapse obstructs the flow of water in a river by glacial tongues<br />
moving down the mountain slopes. Landslides across rivers flowing through hills cause<br />
serious floods in the downstream areas due to pressure of accumulated water upstream of<br />
the failure. In 1979, the collapse of the Machhu Dam in Gujarat State of India caused the<br />
loss of about 10,000 human lives.<br />
2.4 Causes of floods<br />
2.4.1 General causes of floods<br />
The causes of flooding, which are discussed in more detail in later chapters, are<br />
summarized in the upper part of Fig. 2.4-1. Most river floods result directly or indirectly<br />
from climatological events such as excessively heavy and/or excessively prolonged<br />
rainfall. In cold winter areas, where snowfall accumulates, substantial flooding usually<br />
occurs during the period of snowmelt and ice melt in spring and early summer,<br />
23
Technical report of project (GT/1010-00-04)<br />
particularly when melt rates are high. Flooding may also result from the effects of rain<br />
falling on an already decaying and melting snow pack. An additional cause of flooding in<br />
cold winter areas is the sudden collapse of ice jams, formed during the break-up of river<br />
ice.<br />
Major landslides may cause flooding in two ways. First, pounding occurs behind<br />
the debris dam across the valley causing upstream flooding; then, as the debris dam is<br />
overtopped, its erosion or collapse delivers massive flows downstream.<br />
Rain Snow<br />
&<br />
Ice<br />
melt<br />
Basin Factor<br />
(stable)<br />
Area, shape,<br />
slope, aspect,<br />
altitude<br />
Combined<br />
Rain &<br />
ice-melt<br />
Ice<br />
jams<br />
River floods<br />
Basin factors<br />
(variable)<br />
Effects of climate,<br />
geology, soil type,<br />
vegetation cover,<br />
anthropogenic<br />
influences on<br />
storage capacity,<br />
infiltration, and<br />
transmissibility<br />
Causes of floods<br />
Landslides Failure of<br />
dams &<br />
control<br />
works<br />
Drainage<br />
Network<br />
Factors<br />
Channel<br />
Factors<br />
Estuarine<br />
interactions<br />
between<br />
stream flow<br />
& tidal<br />
conditions<br />
Estuary<br />
shape<br />
Flood-intensifying factors<br />
Coastal<br />
storm<br />
surges<br />
Fig. 2.4-1 Causes of floods and flood-intensifying factors (Source: Smith and Ward, 1999)<br />
Earthquakes<br />
Estuarine &<br />
coastal floods<br />
Coastline<br />
configuration<br />
Offshore<br />
gradient<br />
of water<br />
depth<br />
Estuarine and coastal floods are usually caused by a combination of high tides and<br />
elevated sea levels, plus large waves associated with storm surges that result from severe<br />
cyclonic weather systems. In estuarine and coastal areas protected by walls or<br />
embankments, inundation may result from either overflow, when the water level exceeds<br />
the level of the crest of the defense, or from overtopping, when the combined effect from<br />
waves and water level results in waves running up and breaking over the defense, or from<br />
structural failure of the defense (Burgess and Reeve, 1994). When a storm surge<br />
coincides in an estuary with large inflows of river water, flood conditions in the estuary<br />
result (as shown by the broken line in fig. 2.4-1). Estuary and coastal flooding may also<br />
be caused by tsunamis which result from the increase in amplitude of seismically<br />
generated long ocean waves when these enter shallow coastal waters.<br />
24
Technical report of project (GT/1010-00-04)<br />
2.4.2 Short-term causes<br />
Monsoon downpour<br />
An increased amount of precipitation can cause flooding. For example, an abovenormal<br />
monsoon downpour in the Ganges-Brahmaputra-Meghna drainage system is<br />
thought to be the primary cause of the 1988 flood in Bangladesh (Government of<br />
Bangladesh (GOB) and UNDP, 1989; Brammer, 1990). It is not known, however, if the<br />
heavy precipitation is actually an effect of other processes such as the greenhouse effect<br />
or destruction of forests in the upstream region.<br />
Synchronization of flood peaks<br />
The synchronization of flood peaks for major rivers may take place within the<br />
same period, which may cause a sudden increase in the water level in virtually all areas<br />
of the Bangladesh (GOB and UNDP, 1989; Brammer, 1990). While the synchronization<br />
of flood peaks can explain the cause of the 1988 flood, it fails to explain the reason for an<br />
overall increased propensity for low frequency floods in recent years (such as those<br />
which occurred in 1974, 1984, 1987, and 1991). The answer might lie in other long-term<br />
processes that reduce the water-carrying capacity of the drainage system and decrease<br />
land elevation with respect to the base level of the rivers in Bangladesh.<br />
2.4.3 Long-term causes<br />
Local relative sea level rise<br />
The ultimate destination of most rivers is the ocean. Land elevation is measured<br />
with respect to sea level in an area. Therefore, any change in sea level causes land<br />
elevation to change. At the present time, sea level is rising globally (Pilkey et al., 1989).<br />
If sea level rises in an area at a rate faster than the rate of land aggradations due to<br />
sedimentation, then land elevation decreases. Any decrease in land elevation can cause<br />
increased inundation by rivers overflowing at bankfull stage. The rate of local relative<br />
sea level rise is 7 mm/year around the coastal areas of Bangladesh (Emery and Aubrey,<br />
1990). An increase in sea level raises the base level of rivers, which in turn reduces the<br />
gradient of river flow. As a result, the discharge of rivers decreases as the water flow<br />
becomes sluggish, creating a backwater effect further inland. The backwater effect<br />
caused by sea level rise can result in more flooding of land from "piled up" river water<br />
inland (Warner, 1987). This certainly seems to be one of the reasons for the increase in<br />
flood intensity in recent years in Bangladesh.<br />
Inadequate sediment accumulation<br />
The only way for land to counter the effects of a rising sea is for sediment to<br />
accumulate at a rate that is sufficient to keep pace with the rate of sea level rise. Limited<br />
data show that the average sediment accumulation rate for the last few hundred years in<br />
the coastal areas of Bangladesh is 5-6 mm/year, not enough to keep pace with the rising<br />
sea level (Khalequzzaman, 1989). As a result, net land elevations must have decreased<br />
over time, resulting in more flood inundations.<br />
25
Technical report of project (GT/1010-00-04)<br />
Subsidence and compaction of sediments<br />
Sediments on a delta plain are rich in decomposed organic matter, and are subject<br />
to compaction due to dewatering and the weight of the overburden. Most deltas subside<br />
due to the weight of the thick sediment layer. Subsidence along with compaction reduces<br />
land elevation with respect to the rising sea level (Pilkey et al., 1989). Even though the<br />
rate of subsidence and compaction are not yet well documented, based upon knowledge<br />
about processes active in other deltas, it can be assumed that Bangladesh's delta is also<br />
undergoing subsidence and compaction.<br />
Riverbed aggradations<br />
Due to relatively higher settling velocity, large-grained sediments are deposited<br />
near the source area on the riverbeds, forming sand bars. The river gradient decreases<br />
rapidly if sedimentation continues on riverbeds. Because of low gradients and high<br />
sediment loads, riverbeds of most rivers in Bangladesh aggraded very quickly. Riverbed<br />
aggradations are most pronounced for the Ganges and its tributaries. From the border<br />
with India to the point where the Ganges meets the Brahmaputra, the riverbed has<br />
aggraded as much as 5-7 meters in recent years (Alexander, 1989b). Riverbed<br />
aggradation is so pronounced in Bangladesh that changes in riverbed level can be<br />
observed during one's lifetime. For example, the Old Brahmaputra was navigable for<br />
steamers until 30 years ago, but is presently an abandoned channel. This situation is true<br />
for many other distributaries of the Ganges and Meghna such as the Madhumati, the<br />
Bhairab, the Chitra, the Ghorautra, etc. Riverbed aggradations reduce the water carrying<br />
capacity of rivers, causing them to overflow their banks. This recent increase in riverbed<br />
levels has contributed to the increased flooding propensity in Bangladesh.<br />
Deforestation in the upstream region<br />
A rapid increase in population on the Indian sub-continent this century has<br />
resulted in an acceleration of deforestation in the hills of Nepal to meet the increasing<br />
demand for food and fuel wood (Ives, 1989; Sharma, 1991). Deforestation of steep<br />
slopes is assumed to lead to accelerated soil erosion and landslides during monsoon<br />
precipitations. This in turn is believed to contribute to devastating floods in the<br />
downstream regions such as in Bangladesh (Hamilton, 1987; The New York Times,<br />
1988; Alexander, 1989a). However, Hofer 1998, after 12 years of research in Himalayas,<br />
concluded that it has not been possible to find significant correlation between human<br />
activities in the mountains (e.g. forest removals) and catastrophes in the plains (e.g.<br />
floods).<br />
Damming of rivers<br />
Damming a river reduces the velocity of water flow downstream from the dam.<br />
As a result of reduced velocity, the sediments carried by the river start to settle down<br />
faster on the riverbed, causing riverbed aggradations and in turn reducing the water<br />
carrying capacity of the river (Shalash, 1982). The Farakka Barrage on the Ganges has<br />
already caused tremendous damage to the agriculture, navigation, environment, and<br />
26
Technical report of project (GT/1010-00-04)<br />
hydrodynamic equilibrium in Bangladesh (Shahjahan, 1983; Siddiqui, 1983; Broadus et<br />
al., 1986; Khalequzzaman, 1989).<br />
Soil Erosion due to tilling<br />
Plowing makes the land surface more susceptible to soil erosion. Surface run-off<br />
can easily wash away the topsoil from cultivated land. This surface erosion reduces land<br />
elevation, which in turn increases flood intensity in an area. The land elevations in<br />
Bangladesh must have been reduced over time due to cultivation. Aside from this, the<br />
tilling on the mountain slopes of the Himalayas is thought to be responsible for massive<br />
soil erosion in Nepal (Dregne, 1987; Thapa and Weber, 1991; Sharma, 1991) that<br />
eventually caused rapid riverbed aggradations in Bangladesh (Alexander, 1989a).<br />
Excessive development<br />
Rapid population growth creates extra pressure on the land in already<br />
overcrowded areas. Agricultural lands give way to housing developments and roads.<br />
This rapid development and urbanization has aggravated the flooding problem in many<br />
countries.<br />
Prior to urbanization there is a greater lag time between intense rainfall and peak<br />
stream flow. After urbanization the lag time is shortened, peak flow is greatly increased,<br />
and total runoff is compressed into a shorter time interval – favorable conditions for<br />
intense flooding. For example, in a city that is totally served by storm drains and where<br />
60% of the land surface is covered by roads and buildings, floods are almost six times as<br />
likely to occur than before urbanization (Pipkin and Cunnings, 1983).<br />
Seismic (Earthquake) and neotectonic activities<br />
Earthquakes cause movement of the land, and this can change the topography of<br />
the region and alter river courses. A sudden change in a river course can cause substantial<br />
flooding. For example, the Old Brahmaputra changed its course to its present location<br />
following an earthquake in the mid eighteenth century (Er-Rashid, 1978). The northern<br />
regions of Bangladesh are earthquake-prone (Morgan and McIntyre, 1958). Neotectonic<br />
activities (recent movements in the Earth's crust) are affecting river courses in the area.<br />
The Madhupur tract and the Barind tract are undergoing such neotectonic activities<br />
(Morgan and McIntyre, 1958). Most recent floods have occurred approximately<br />
simultaneously with earthquake activities. For example, the 1950 earthquake in Assam<br />
caused "swallowing" of the Brahmaputra, by causing it to breach its banks and flood the<br />
region (The Times of India, 1988). The floods of 1988 and 1991 coincide with<br />
earthquake activities in northern parts of Bangladesh (The Times of India, 1988; The<br />
New York Times, 1991). A powerful earthquake occurred on October 20, 1991 in<br />
northern India, which was preceded by a flood in Bangladesh and was followed by<br />
another flood in the Ganges valley in India (The Philadelphia Inquirer, 1991).<br />
Floods can be both a cause and an effect of an earthquake. Floodwater places an<br />
extra hydrostatic pressure on unstable and mobile crustal blocks. If this extra pressure<br />
reaches the threshold strain limit along a fault zone or plate boundary within the Earth's<br />
crust, it can cause an earthquake to occur due to a sudden release of the strain energy<br />
accumulated over time. Similarly, an earthquake can change the surface drainage pattern<br />
27
Technical report of project (GT/1010-00-04)<br />
and consequently the course of a river, causing sudden flooding in an area. Even though<br />
the cause and effect relationship between floods and earthquakes is not very clear,<br />
historic records suggest a relationship between these two phenomena. The recent<br />
earthquake of September 17, 2000 in Hyderabad, India is very likely due to the intense<br />
flooding in the region, although the Hyderabad is located in a very stable Indian shield<br />
(http://www.rediff.com/news/2000/sep/17quake.htm).<br />
Greenhouse effect<br />
The world is about to enter a period of rapid warming. Should the greenhouse<br />
effect become a reality, the low-lying coastal areas will be affected by a rising of sea<br />
level of even greater magnitude (Milliman et al. 1989; Gable and Aubery, 1990).<br />
Bangladesh will be severely impacted by such an increase in sea level (Broadus et al.,<br />
1986; Khalequzzaman, 1989; Ali and Huq, 1989; Brammer 1989; Hossain 1989).<br />
Besides many other adverse environmental, economic, and climatic consequences (Huq<br />
and Ali, in press), the base level of all rivers will change following any change in the sea<br />
level. The effect on flooding of a higher base level resulting from a rising sea level has<br />
already been discussed earlier in this section. The greenhouse effect will also increase<br />
the amount of rainfall and storminess, which will further aggravate the flood problem.<br />
Fig. 2.4-2 The house is seen during the Bangladesh flood of 1988 (Source: FHI, 1998)<br />
2.4.4 Meteorological Causes of Floods in Asian countries<br />
Heavy rainfall is the main cause of floods in India for any river basin. In India,<br />
heavy rainfall is normally associated with the summer and winter monsoons. During<br />
28
Technical report of project (GT/1010-00-04)<br />
these monsoon periods, certain meteorological systems interact with the monsoon<br />
circulations, causing heavy to very heavy rainfall. Meteorological situations responsible<br />
for causing floods in the Indian rivers have been studied by Parthasarthy (1955), Bose<br />
(1958), Dhar (1959), Dhar and Changrani (1966), Jegannathan (1970), Dhar et al. (1975,<br />
1980, 1981, 1986, 1989, 1990, 1991, 1992, 1993, 1994). Ramaswamy (1987) pointed out<br />
following synoptic systems for the cause of severe floods:<br />
• Tropical disturbances such as monsoon depressions and cyclonic storms moving<br />
through the country from the neighboring seas of the Bay of Bengal and the<br />
Arabian ocean.<br />
• Passage of low-pressure system or monsoon lows.<br />
• Break monsoon situations generally prevailing during July and August.<br />
• Active monsoon conditions prevailing over a region for a number of days and<br />
offshore vortices along the west coast.<br />
• Mid-latitude westerly systems moving from west to east.<br />
• Mid-tropospheric cyclonic circulations over western region of the country.<br />
Apart from the above meteorological situations there are man-made factors, which are<br />
responsible for causing serious floods in different parts of the country.<br />
Monsoon depressions and cyclonic depressions<br />
From June to September, river flooding is caused by the movement of monsoon<br />
depressions and cyclonic storms throughout India. These disturbances mostly originate<br />
from the Bay of Bengal and very rarely from the Arabian Ocean. As they move, these<br />
disturbances cause heavy to very heavy rainfalls along and near their tracks. Predicting<br />
the movement of these disturbances, therefore, is essential in the flood forecasting and<br />
warning system. These cyclonic disturbances during the monsoon months mostly form at<br />
the head of the Bay of Bengal and travel in a northwest to west direction through the<br />
Indo-Gangetic plains and its neighborhood after crossing the coast. Sometime after<br />
moving far into the interior of the country, these disturbances recurve and move towards<br />
the north or northeast and break over the foothills of the Himalayas under the influence of<br />
westerly troughs or western disturbances moving from west to east at higher latitudes.<br />
Associated with these disturbances, both the Arabian Ocean and the Bay of Bengal<br />
branches of the summer monsoon currents strengthen considerably and cause heavy to<br />
very heavy rainfall over the region. However, it has been observed that in the summer<br />
monsoon, heavy rainfall generally occurs in the southwestern sector of these<br />
disturbances. According to Rao (1976), heavy rainfall (7.5 cm and above) occurs over a<br />
belt of 400 km wide to the left of the track for a length of 500 km from the center of the<br />
disturbances. As a result of heavy rainfall, severe floods occur in the rivers of the region.<br />
These are generally known as single event floods. The floods on northern and central<br />
Indian rivers occur mostly due to heavy rainfall caused by the slow movement of these<br />
disturbances. The deltaic areas of Orrisa, Andhra Pradesh and also Tamilnadu (during<br />
winter monsoons) suffer frequently from the floods caused by these bay cyclonic<br />
disturbances at the time of their landfall.<br />
Passage of low-pressure areas and upper air cyclonic circulations<br />
Passage of low pressure areas both of ocean or land origin or movement of upper<br />
circulations during summer monsoon months often cause heavy rains and consequent<br />
29
Technical report of project (GT/1010-00-04)<br />
floods. Low pressure areas are less intense than monsoon depressions but they form<br />
frequently during the monsoon months and their contribution to the rainfall in India is<br />
quite substantial. Unlike cyclonic storms/depressions, there is no regular account of the<br />
number of ‘lows,’ which occurred during summer monsoon months. However, Srnivasan<br />
et al. (1972) found that 87 lows, both of ocean and land origin, occurred during the 20year<br />
period from 1950-1969. Recently, Nandargi (1995) found that 93 lows occurred over<br />
India during the summer monsoon period during the 10 years from 1984 to 1993, causing<br />
557 low days. In general, lows have an average life span of about 4 to 6 days. In any<br />
certain year, the lows travel one after another in quick succession through north India,<br />
causing continuous heavy rainfall for a number of days. Such multiple events are<br />
responsible for causing serious floods in the rivers of north and central India such as the<br />
Narmada, the Tapati and the northern tributaries of the Godavari.<br />
Fig. 2.4-3 A family tries to make its way to a safer place along a submerged express way in<br />
Kendrapara district. Makeshift ‘boats’ are used to ferry people and materials through the<br />
affected areas.<br />
Break situations during monsoon periods<br />
A ‘break’ monsoon situation occurs when the axis of the seasonal monsoon<br />
trough, which normally passes through Delhi, Kanpur, Patna and then to Kolkatta shifts<br />
northwards from its normal position and lies close to the foothills of the Himalayas both<br />
on surface and 850 mb synoptic weather charts. This particular situation results in heavy<br />
rainfall over the northeastern and central Himalayas and their adjoining plain areas (Dhar<br />
et al., 1984), while the rest of the country is under drought conditions with little rain.<br />
During break situations, due to heavy rainfall over Himalayan arid sub-Himalayan<br />
regions, floods occur in the rivers of northeast and central Himalayas i.e. Brahamaputra<br />
and its tributaries, Testa, Kosi, Gandak, Ghagra, Kamla Balan, Bagmati, and Rapti.<br />
During break monsoon days, areas under the Sikkim and eastern Nepal Himalayas and<br />
30
Technical report of project (GT/1010-00-04)<br />
their neighborhood receive heavy rainfall, which is 50 to 300 percent or more of the daily<br />
rainfall over these areas, while the areas south as well as to the north receives less<br />
rainfall. A southward shift of the axis of the seasonal monsoon trough from its normal<br />
position results in a well-distributed rainfall over the central parts of the India and<br />
adjoining northern parts of the Indian peninsula. During a break situation, a paradox often<br />
arises in which flooded rivers from the Himalayas inundate areas in the Ganga plains,<br />
which are under drought conditions. Break situations very rarely last for more than a<br />
week at a time and generally occur in July and August of the summer monsoon season.<br />
During the break in July and August 1954, there were widespread floods in the<br />
Himalayan rivers from Gandak on the western side to the Brahamaputra on the eastern<br />
side. According to Partasarthy (1955), the plains of Bihar, Bengal, Orissa and southern<br />
districts of Uttar Pradesh suffered from partial droughts while north Bihar, Bengal and<br />
Assam experienced the fury of floods.<br />
The floods and heat condition of underlying surface in the Tibetan Plateau<br />
The East Asia monsoon is greatly affected by the Tibetan Plateau. In addition,<br />
snowmelt in the Plateau has a direct effect on Yangtze River floods. Heat conditions on<br />
the underlying surface on the Tibetan Plateau are one of the most important<br />
meteorological predictive factors. Mean temperatures of the Tibetan climate stations have<br />
been selected to represent the plateau’s surface temperature. A correlation index between<br />
the mean monthly temperature in Tibet and the total amount of precipitation during<br />
flooding season in the Yangtze River basin was calculated. The temperature in March,<br />
August, and December in any given year has a significant correlation with the<br />
precipitation during the flooding season of the following year. The closest correlation is<br />
between August temperatures in the Tibetan Plateau with Yangtze River precipitation<br />
during the flood season the following year with the degrees confidence that reaches 0.99<br />
(Lu and Ding, 1997).<br />
Floods due to glacial lake outburst<br />
Glaciers result from an accumulation of ice, air, water and rock debris or<br />
sediment. A glacier is a large enough quantity of ice to flow with gravity due to its own<br />
mass. Glaciers flow very slowly, from tens of meters to thousands of meters per year. The<br />
ice can be as large as a continent, such as the ice sheet covering Antarctica; or it can fill a<br />
small valley between two mountains. Accumulation of snowflakes stimulates glacier<br />
formation. Snowflakes fall to the ground and over time, lose their edges and slowly<br />
become tiny grains separated by air. Additional snowfall compresses underlying layers of<br />
snow grains that become loosely compacted with randomly oriented ice crystals and<br />
connected air spaces. Ice in this form that has survived a season is termed firn.<br />
Continuous compression removes air bubbles from firn and forms true glacial ice with a<br />
blue tone; it takes about 1,000 years for snow to form glacial ice.<br />
Himalayan glaciers<br />
River Major River Mountain<br />
System Area (km 2 Glacier Area<br />
) (km 2 %<br />
) Glaciations<br />
Indus 268,842 7,890 3.3<br />
31
Technical report of project (GT/1010-00-04)<br />
Jhelum 33,670 170 5.0<br />
Chenab Indus system 27,195 2,944 10.0<br />
Ravi 8,092 206 2.5<br />
Sutlaj 47,915 1,295 2.7<br />
Beas 12,504 638 4.4<br />
Jamuna 11,655 125 1.1<br />
Ganga 23,051 2,312 10.0<br />
Ramganga Ganga system 6,734 3 0.04<br />
Kali 16,317 997 6.01<br />
Karnali 53,354 1,543 2.9<br />
Gandak 37,814 1,845 4.9<br />
Kosi 61,901 1,281 2.1<br />
Tista 12,432 495 4.0<br />
Raikad 26,418 195 0.7<br />
Manas 31,080 528 1.7<br />
Subansiri Brahamputra<br />
81,130 725 4.0<br />
system<br />
Brahamputra 256,928 108 0.4<br />
Dibang 12,950 90 0.7<br />
Luhit 20,720 425 2.0<br />
Table 2.4-1 Principal Glacier-fed river systems of the Himalayas (after Hasnain, 1999)<br />
The Himalayan glaciers receive annual accumulation mainly in the summer. The<br />
monsoon precipitation from June to September contributes about 80% of annual<br />
precipitation. Ageta and Higuchi (1984) called these glaciers summer accumulation<br />
types. These glaciers are different from the winter accumulation type, which are common<br />
in Europe and America. In summer accumulation type glaciers, which are common in<br />
Himalayan region, accumulation and ablation occur simultaneously. Under such<br />
conditions, summer snowfall sometimes changes to rain under warm air temperature<br />
conditions. New snow cover melts away quickly. Summer air temperature in the<br />
Himalayan region is an important factor, which controls ablation through albedo variation<br />
at the glacier surface. Ageta (1983) has estimated relations between summer mean air and<br />
accumulation, ablation and balancing during summer. Table 2.4-1 identifies some of the<br />
important glacier-fed river systems of the Himalayas.<br />
Cloudburst floods<br />
Cloudburst is very common in the Himalayan region. In 1963, a cloudburst struck<br />
the meadow of a tourist resort near Srinagar (J & K), which killed several people and<br />
caused a flash flood in the Lidar River. In September 1995, heavy incessant rain in the<br />
upper reaches of the Bias River and a cloudburst on the southern slope of Rohtang in the<br />
higher Himalayas formed a small dam debris flow north of Manali. The bursting of the<br />
dam generated a flash flood.<br />
32
Technical report of project (GT/1010-00-04)<br />
Fig. 2.4-4 Flood in India. Many neighborhoods in north and northeast India remain under<br />
water. -- Photos courtesy of the BBC (Source: Disaters Relief, 2000)<br />
2.4.5 Flood with special events<br />
Floods and sunspots<br />
Recent research shows that solar activity has some effect on regional long-term<br />
global precipitation. (Wu and Gough, 2001). It is indicated that extreme flood years are<br />
usually when the 11-year periodical variation of sunspot relative number is either at its<br />
peak or its lowest values, especially at the lowest values.<br />
Floods and El Niño<br />
As the most remarkable connective signal between the global climate and sea, El<br />
Niño profoundly affects the world climate. There have been many studies on El Niño and<br />
its relationship to regional climates. Statistical analysis proves that most of Yangtze River<br />
floods occur in the years following El Niño. Taking the 1998 flood as an example, the<br />
1997 El Niño was the most active in the last 100 years, which greatly affected the<br />
precipitation in the basins of Yangtze River. The precipitation during the winter of 1997<br />
and spring of 1998 was 2 to 5 times greater than that during the same period in the past,<br />
with the main rain belt in the southern areas of Yangtze River. The rain belt then began to<br />
move to the upper and middle reaches with the central rain belt located at the middle<br />
reaches in June. The precipitation in this month reached 800 mm, twice the historical<br />
norm. In July, the central rain belt was in the Wuhan region where the mean monthly<br />
precipitation was 4 times normal. The precipitation on July 21-22, 1997 in Wuhan<br />
reached 221.5 mm and 175.2 mm respectively, both of which broke the historical record.<br />
In August, the rain belt arrived in the upper basins. Daily rainfalls of over 100 mm<br />
33
Technical report of project (GT/1010-00-04)<br />
occurred in Three Gorges Reservoir, which caused several flooding peaks in the upper<br />
reaches. The above time and space distribution of precipitation raised the flood's level in<br />
the middle and lower reaches at the beginning, which when combined with the following<br />
heavy rains in the middle and upper reaches, resulted in extreme floods in entire reaches<br />
of the Yangtze River (Wu and Gough, 2001).<br />
2.5 Flood-intensifying factors and conditions<br />
As the lower part of Fig 2.2-1 shows, floods may be intensified by a number of<br />
factors. In the case of estuarine and coastal floods, intensification results largely from the<br />
funneling effects of estuary shape and coastline configuration, e.g. the Bengal, which<br />
causes an overall increase in sea level as water is driven into the narrower section. The<br />
overflow of sea defenses is less common than overtopping on the open coast, but is an<br />
important aspect of flooding in estuarine areas. The height of tsunami waves at their point<br />
of impact upon the coastline is dependent upon the offshore slope of the seabed, or upon<br />
the rate of decrease in water depth encountered as the tsunami moves towards the shore.<br />
River floods may be intensified by factors associated either with catchments<br />
themselves or with the drainage network and stream channels. Few of these factors,<br />
however, operate either unidirectionally or independently. For example, area is clearly<br />
important in the sense that the larger the catchments, the larger the flood produced from a<br />
wide rainfall event. However, when the rainfall event covers only parts of catchments, the<br />
attenuation of the resulting flood hydrograph, as it moves through the channel network to<br />
the outlet, is likely to be greater in large catchments than in small ones. Some of the most<br />
complex relationships, those between the variable basin factors, have a significant<br />
influence on three important hydrological variables: water shortage, infiltration and<br />
transmissibility.<br />
Water storage in the soil and deeper subsurface layers may affect both the timing<br />
and magnitude of flood response to precipitation, with low storage often resulting in rapid<br />
and intensified flooding. High infiltration values allow much of the precipitation to be<br />
absorbed by the soil surface, thereby reducing catchments flood response, and low<br />
infiltration values encourage the normally swifter over-the-surface movement of water<br />
leading to rapid increases in channel flow. In basins where most precipitation infiltrates<br />
the soil surface, flood response may be greatly modified by subsurface transmissibility,<br />
i.e. the ease with which water flows through the subsurface materials.<br />
Apart from drainage patterns, channel and network factors within a drainage basin<br />
are essentially dynamic and their effects on flooding may change noticeably within a few<br />
hours. Of major importance is the proportion of the catchments area having<br />
interconnected water and waterlogged surfaces where the effective infiltration capacity is<br />
zero, so that all rain falling on such surfaces contributes directly and rapidly to stream<br />
flow. At the onset of rainfall, these source areas for quick flow may be restricted to the<br />
water surfaces in the channel network; but as rainfall continues, the source areas expand,<br />
causing a major increase in the volume of rapid runoff reaching stream channels.<br />
Human activities frequently act as flood-intensifying factor by modifying key<br />
hydrological variables such as water storage, infiltration and transmissibility. The effects<br />
on flooding of anthropogenic influences associated with urbanization, agriculture,<br />
forestry and dam construction are obvious.<br />
34
Technical report of project (GT/1010-00-04)<br />
In summary, flood intensification depends on the following characteristics:<br />
1) Basin characteristics<br />
• Stable - area, shape, slope, aspect and altitude<br />
• Variable - interactions between climate, geology, soil type, vegetation cover, wild<br />
life, human activities causing important differences in storage capacity of soil and<br />
bedrock, infiltration and transmissibility of soil and bedrock<br />
2) Network characteristics<br />
• Stable - pattern of network<br />
• Variable - surface storage, channel length<br />
3) Channel characteristics<br />
• Stable - slope, flood control and river regulation works<br />
• Variable - roughness, load, shape and storage<br />
One of the most important of all flood-producing conditions is the total area of<br />
interconnected water and water-logged surfaces within the catchments where the<br />
effective infiltration capacity is zero and on which all falling precipitation contributes<br />
directly to stream flow.<br />
2.6 Flood alleviation<br />
Efforts have been made to control rivers over hundreds of years. Water<br />
management measures were undertaken for Ganges waters in India as early as the<br />
thirteenth century, although these were modest in the delta region. Very little was done to<br />
control Ganges River flows during the British period in India, probably because of the<br />
particular severity of flood flows compared with those which were successfully harnessed<br />
on the Punjab rivers.<br />
Following several disastrous floods in Bangladesh, numerous international<br />
agencies were involved in developing many bilateral aid agencies to control floods<br />
(World Bank, 1990; UNDP, 1989; Hunting Technical Services, 1992). In 1995, water and<br />
flood management strategies were developed, taking into greater account multisectoral<br />
issues (BWDB, 1995). After 1998’s disastrous flood, efforts were made to focus flood<br />
alleviation strategies, e.g. integrated water management, floodplain morphology and<br />
flood forecasting and warning. With the help of international agencies, efforts have been<br />
made to carry out physical civil engineering works such as upstream storage in dams,<br />
channel improvements, underground storage, shallow storage reservoirs and construction<br />
of embankments. Of these, only embankment construction was considered as a possible<br />
permanent solution to the problem of flooding. Non-structural activities could assist in<br />
protection of the population, particularly flood forecasting and warning and community<br />
based flood preparedness.<br />
China has a long history of river and flood control on the Yangtze River,<br />
including building embankments downstream, constructing dams and reservoirs<br />
upstream, and returning cultivated land back to lakes.<br />
35
Technical report of project (GT/1010-00-04)<br />
Fig. 2.7-1 Flood in Bangladesh. A family carrying all of their belongings and looking for a<br />
dry place as their house has gone under water. Satkhira, Bangladesh. October 6, 2000<br />
(Source: ' 2000 Abir Abdullah / DRIK)<br />
2.7 Human causes of flood hazard<br />
As discussed in section 2.4, many causes of floods are attributed to human<br />
activities, such as deforestation in the upstream region, damming of rivers, and soil<br />
erosion due to tilling. Flood hazards are created by countless individual decisions that<br />
encourage the settlement and economic development of floodplains and flood-prone<br />
coastal areas. Historically, the process is well established. For example, in India floods<br />
are the most common feature since the dawn of civilization. At Mohen jo Daro, flood<br />
control structures existed as early as 2700 to 300 BC (Mackey, 1934). These structures,<br />
as well as storm water drainage works, show that heavy rains and consequent floods have<br />
been occurring regularly each and every year in different parts of India, even in those<br />
prehistoric times. The intrinsic land-use attractions of major floodplains and coasts have<br />
made these zones some of the most densely populated and hazardous settings in the<br />
world. Because flood hazards are essentially created by human decisions and actions, it<br />
follows that the social and political context for such actions is an important element in the<br />
selection of any subsequent flood mitigation schemes (Smith and Ward, 1999).<br />
36
Technical report of project (GT/1010-00-04)<br />
3 Damage due to floods in Bangladesh, China and<br />
India<br />
3.1 Damage due to floods<br />
In many countries of the world, floods are the most costly hazards in terms of<br />
both loss of human lives and material damage. The spatial scale at which this kind of<br />
phenomenon arises can be highly variable. Flooding can affect large continental area, but<br />
it can also occur as a very localized event. On the global scale, storms and floods are<br />
most destructive of natural disasters and cause the greatest number of deaths (Casale and<br />
Margottini, 1999).<br />
Oceania<br />
US &<br />
Canada<br />
Rest of<br />
Americas<br />
Europe<br />
Africa<br />
Asia<br />
Total<br />
Total<br />
Asia<br />
Africa<br />
Europe<br />
Rest of Americas<br />
US & Canada<br />
Oceania<br />
Slides<br />
Droughts<br />
Type of disaster<br />
Earthquakes<br />
Epidemics<br />
Floods<br />
Wild Fires<br />
Extremes temperatures<br />
Wind Storms<br />
TOTAL<br />
Non-Natural Disasters<br />
Other Natural Disasters<br />
Volcanoes<br />
Fig. 3.1-1 Total number of people reported killed, by continent and by type of phenomenon<br />
(1990 to 1999, source: IFRC World Disaster Report 2000)<br />
Every year thousands of people die by different disasters but the fate of many of<br />
them is never reported. Fig.3.1-1 shows the comparison of fatalities between the<br />
different continents. The United States and Canada are shown here as one continent as<br />
they are the two richest countries in the world in terms of land and resources. The graph<br />
shows that Asia and Africa are the most vulnerable continents where fatalities are much<br />
450000<br />
400000<br />
350000<br />
300000<br />
250000<br />
200000<br />
150000<br />
100000<br />
50000<br />
0<br />
37<br />
Number of<br />
people killied
Technical report of project (GT/1010-00-04)<br />
bigger than on other continents. In last 10 years, windstorms and floods killed thousands<br />
of people in Asia, which is more than 10 times higher than rest of the world.<br />
The WWW system of WMO addresses the need for special severe weather<br />
warnings and meteorological advisories that are crucial for minimizing the losses from<br />
natural disasters. It is estimated that natural disasters annually claim nearly 250,000 lives<br />
and cost US $ 50 billion to 100 billion in property damage. Fig. 3.1-2 shows that over 84<br />
percent of all significant damage in property is caused by disasters which are<br />
meteorological and hydrological in origin. For the forecasts or early warning of various<br />
types of natural hazards, reliable and accurate forecasts of meteorological and<br />
hydrological parameters are crucial.<br />
Fig. 3.1-2 Major disasters of the world<br />
3.1.1 Floods in Bangladesh<br />
Bangladesh is one of the countries with the highest frequency and most loss of life<br />
from floods hazards in the world. The problems stem from high population density and<br />
poor economic situations. The following table shows the relationship between the number<br />
of natural disaster events (floods, cyclones, landslides etc.) and the comparison in<br />
Bangladesh and United States. These numbers show that reported natural disaster events<br />
in the United States were over 3 times higher than in Bangladesh. However, the number<br />
of deaths in Bangladesh was 34 times higher.<br />
Bangladesh is geographically located in the deltaic region of three enormous<br />
rivers, only 8% of whose catchments areas lie within its political boundaries (Fig. 3.1-1).<br />
It has experienced several calamities of different proportions. In recent years, the climatic<br />
events are worsening in intensity, duration and frequency.<br />
Roughly two-thirds of Bangladesh is fertile arable land and a little over 10%<br />
remains forested. The country is home to the Royal Bengal tiger, leopards, Asiatic<br />
38
Technical report of project (GT/1010-00-04)<br />
elephants (mostly migratory herds from Bihar), and a few remaining black bears. There<br />
are also abundant monkeys, langurs, gibbons (the only ape on the subcontinent), otters<br />
and mongooses. Reptiles include the sea tortoise, mud turtle, river tortoise, pythons,<br />
crocodiles and a variety of poisonous snakes. There are more than 600 species of birds.<br />
The best known is the mynah, with the most spectacular being kingfishers and fishing<br />
eagles.<br />
Fig. 3.1-3 Flood Status and river system of Bangladesh (Source: FFWC, BWDB, Dhaka,<br />
1998)<br />
The climate of Bangladesh is subtropical and tropical with temperatures ranging<br />
from an average daytime low of 21 degrees Celsius in the cold season to a high of 35<br />
degrees in the hot season. Bangladesh has three main seasons: the monsoon or `wet'<br />
season from late May to early October; the `cold' season from mid-October to the end of<br />
39
Technical report of project (GT/1010-00-04)<br />
February; and the `hot' season (known in Bangladesh as the `little rainy season') from<br />
mid-March to mid-May. There is also a 'cyclone season' - May to June and October to<br />
November.<br />
Fig 3.1-4 A son carries his mother on his back as he wades through flood waters to reach<br />
higher land in Satkhira on Sunday (Source: AP photo, 2000)<br />
Bangladesh is nestled in the crook of the Bay of Bengal, surrounded by India (Fig.<br />
3.1-3). It shares a border in the southeast with Myanmar and fronts onto the Bay of<br />
Bengal. The country is flat, and dominated by the braided strands of the Ganges-<br />
Brahmaputra-Jamuna delta, where Bangladesh ends and the sea begins is a murky zone of<br />
shifting sediments, watercourses, floodwaters and silt. Over 90% of the country is<br />
composed of alluvial plains less than 10 m above sea level, making it an inviting<br />
proposition to flood-prone rivers and tidal waves. The only relief from these low-lying<br />
plains occurs in the northeast and southeast corners where modest hills rise to an average<br />
height of around 240 m and 600 m, respectively.<br />
Country Number of reported events Number of deaths<br />
Bangladesh 86 150,242<br />
USA 242 3,418<br />
Table 3.1-1 A comparison of number of reported natural disaster events and fatalities in<br />
Bangladesh and USA (1990-1999, Source: CERD 2000)<br />
In recent years the frequency of abnormal floods in Bangladesh has increased<br />
substantially, causing serious damage to lives and property. While the heavy monsoon<br />
downpour may be an apparent reason for the recent floods in Bangladesh, there are many<br />
underlying geologic causes that contribute to the flood problem over a long period of<br />
40
Technical report of project (GT/1010-00-04)<br />
time. Fig.3.4 shows the number of people killed by floods in Bangladesh during 1900-<br />
1999.<br />
Some statistics of damages caused by 1998 flood in Bangladesh:<br />
1) LOSSES AND DAMAGES AS OF OCTOBER 4, 1998:<br />
• Total area affected by flood – about 100,000 sq. km. (Area of Bangladesh is<br />
148,393 sq. km.)<br />
• Total shortfall of production: about 2.2 million MT<br />
• Number of Districts – 52<br />
• Number of Police Stations –366<br />
• Number of Affected Union Parishad – 3, 323<br />
• Number of Affected People – 309,160,351<br />
• Affected Standing Crops in Acres – 1,423,320<br />
• Number of Affected Homesteads – 980,571<br />
• Number of Deaths – 918<br />
• Cattle killed – 26,564<br />
• Roads Damaged (km)– 15,927<br />
• Embankments Damaged (km)– 4,528<br />
• Number of Damaged Bridges / Culverts– 6,890<br />
• Number of Educational Institutions damaged – 1,718<br />
• Number of Flood Shelters – 2,716<br />
• Number of people taking refuge – 1,049,525<br />
2) NB: 52 Districts of the country affected more or less till today from October 4, 1998.<br />
The latest update of the flood-hit districts is as follows:<br />
• The flood situation has turned normal in all affected 52 districts due to receding of<br />
water.<br />
• Total death toll in flood affected districts: 918.<br />
• The total sanction in flood affected areas since October 4, 1998 stands at 5 crore<br />
and 17 lakh 75 thousand taka and 91,062 MT of rice and 750 MT Wheat worth of<br />
taka 128 crore 53 lakh and 68 thousand. In addition to that 1 crore and 40 lakh<br />
taka in cash has been sanctioned from Prime Minister's Relief and Welfare Fund<br />
for the flood victims<br />
3) Floods kill over 700, millions homeless in India, Bangladesh (CNN September 26,<br />
2000)<br />
• Rescue crews used boats and military helicopters to help some of the millions of<br />
people washed out of their homes by floods believed to have killed more than 700<br />
in India and Bangladesh.<br />
• Authorities tried to ferry victims to higher ground, but most remained marooned<br />
atop buildings. Air force helicopters dropped food and water purification packets.<br />
• The vast majority of the deaths were in India, but the toll in both countries was<br />
expected to rise, and waterborne diseases were expected. Many villages were cut<br />
off as floods inundated roads.<br />
• Almost all districts on either side of the southern India-Bangladesh border were<br />
affected since September 18, 2002 when late monsoon rains sent sudden water<br />
over riverbanks and dams. The floods submerged highways, villages and the<br />
41
Technical report of project (GT/1010-00-04)<br />
homes of more than 10 million people in eastern India and 200,000 in<br />
Bangladesh.<br />
• In the Indian state of West Bengal, reports indicated “652 people were feared<br />
dead, more than half of them in Murshidabad district.”<br />
3.1.2 Floods in China<br />
The Yangtze River in China is the third largest river in the world, and is important<br />
to human society in China. Since ancient times, people have suffered from floods and<br />
flood disasters. Floods are related to the rising mechanisms at the level of the river and<br />
also broader ecological characteristics of drainage basins. Causative factors of Yangtze<br />
River floods are related to physical geography and related to human activities. The<br />
physical geographical factors relating to Yangtze River floods are varied.<br />
Fig. 3.1-5 A Chinese man struggles to carry his bicycle through fast-flowing waters in a<br />
flooded stret in the Daijiashan district of Wuhan, near the Yangtze River yesterday. (Photo<br />
by The Associated Press, 1998)<br />
Precipitation anomalies are key flooding mechanisms. It is commonly known that<br />
the East Asia Monsoon generally controls China’s climate, which means that most of<br />
China’s annual total rainfall occurs during the summer season. Because of the variations<br />
in monsoons, yearly rainfall totals fluctuate greatly, especially during the flooding<br />
season. The duration and intensity of rainfall during the flooding season is affected<br />
mainly by West Pacific Subtropical High Pressure (WPSHP) systems. The WPSHP<br />
lingers over this area for a long time, causing excessive rainfall in Yangtze River basins.<br />
Apart from WPSHP, some other important meteorological factors include westerly belts,<br />
42
Technical report of project (GT/1010-00-04)<br />
low-level jets, and short waves. These meteorological factors act to bring southern<br />
moisture to Yangtze River drainage basins, forcing northern cool air masses to clash with<br />
southern warm air masses, thereby producing rain in this area. Nearly all past floods have<br />
resulted from this type of weather system.<br />
The main problem in the hydrograph is the limited capacity of flood discharge in<br />
the middle reaches of the Yangtze River, especially in the reach of Jing-Jiang. Since most<br />
runoff in Yangtze River floods are generated in the upper basins, this limitation has a<br />
bottleneck effect on floods in the middle reaches. According to the observed data, the<br />
capacity of flood discharge in Jing-Jiang is about 60,000 M 3 /s. Since 1892, there have<br />
been more than 24 years in which flood discharges have exceeded this capacity, each<br />
time causing great damage.<br />
The impacts of human activities on the Yangtze River's ecological environment<br />
have been discussed in detail (Yijin et al., 1996). Human activities in Yangtze River<br />
drainage basins can be traced back to ancient times. However, only in modern times have<br />
these activities caused much disturbance and damage to the ecological environment. Over<br />
the last 530 years, flooding frequency has increased obviously in the last 200 years. There<br />
is a tight connection between such change and a degraded ecological environment. The<br />
main effects of human activities on the basins are:<br />
• Deforestation along the upper basins has resulted in much soil loss. Mud and sand<br />
carried with the floods has been deposited on the riverbed, especially in the<br />
middle reaches of the river. The riverbed in Jing-Jiang now is 8-15m higher than<br />
the flood plain.<br />
• With increasing population, many lakes have been enclosed for cultivation. For<br />
example, the number of lakes is down from 856 (1930s) to 577 (1990s) in the<br />
Jiang-Han plain. The diminishing number and size of lakes along the river<br />
weakens the attenuation of flood peaks. Further, many lakes are separated from<br />
the river, causing a rapid decrease in the Yangtze River flood storage capacity.<br />
The Yangtze River is historically a flooding river. There were 214 floods from<br />
the Han Dynasty (185 B.C.) to the Qing Dynasty (1911A.C). There were 14 big<br />
floods from 1921-2000. Fig. 3.1-5 shows the number of people killed by floods in<br />
China from 1900 to 1999 and Table 3.1-2 shows mainly floods from 1931-1954.<br />
Major flood year 1931 1935 1949 1954<br />
Number of people affected (thousands) 2,900 2,264 2,721 1,888<br />
Number of people killed (thousands) 145.4 142 5.7 30<br />
Table 3.1-2 Number of people killed by major floods in Yangtze River from 1931-1954<br />
(Source: Tang, Q. “Chinese river and hydrology”)<br />
3.1.3 Floods in India<br />
In India, floods have occurred since the dawn of civilization. At Mohen jo Daro<br />
flood control structures existed as early as 2700 to 300 BC (Mackey, 1934). These<br />
structures as well as storm water drainage works there show that heavy rains and<br />
consequent floods have occurred regularly each year in different parts of in India even in<br />
prehistoric times. On an average, until about the mid seventies, about 78 lakh hectares of<br />
land was affected by floods and the average flood damage per flood season was estimated<br />
to be 240 crores of rupees (Verma, 1978). It is estimated the average annual damage due<br />
43
Technical report of project (GT/1010-00-04)<br />
to floods is 7,681 million rupees. On an annual average, as many as 1,495 human lives<br />
are lost; in the year 1977 alone 11,316 lives were lost. Flood losses are increasing yearly<br />
due to increasing population and consequent encroachment of low lying flood prone areas<br />
of the country (INAE, 1990). In India, floods over most parts of the country generally<br />
occur during the southwest monsoon season from June to September. In the southern half<br />
of the Indian peninsula, floods also occur during the northeast monsoon season from<br />
October to December. During the four monsoon months from June to September, the<br />
country receives about 76% of its annual rainfall, about 117 cm on an average (Dhar et<br />
al., 1981).<br />
The major river basins in India can be classified into two groups:<br />
• Rivers of the Himalayan region<br />
• Rivers of Peninsular India<br />
The melting of snows and glaciers from the great Himalayan range during spring<br />
and summer, and rain during the monsoon season, feed the Himalayan River. The<br />
behavior of the Himalayan region is very uncertain and depends on rainfall and<br />
snowmelt. These rivers carry significant flows during dry weather due to snowmelt, and<br />
minimum flows during winter. The peninsular rivers originate at much lower altitudes,<br />
flow into more stable areas and are more predictable in their behavior. The flow of these<br />
rivers is only controlled by the heavy discharges during the monsoon season.<br />
From the standpoint of flood problems, the rivers have been grouped into<br />
following four regions (NIH, 1993):<br />
• Brahmaputra region<br />
• Ganga region<br />
• Northwest region<br />
• Central Indian and Deccan trap region<br />
The problem of floods varies from basin to basin. The magnitude and intensity of<br />
floods also varies and is dependent upon streams and drainage networks in the region.<br />
The maximum streams originating from the Himalayan region meet in the Ganges and<br />
Brahmaputra Rivers, creating great risk of flood occurrence. The most flood-prone areas<br />
lie in the Brahmaputra basin and the northern sub-basins in the Ganga basin. Annual<br />
flood damages in the Ganga basin are about 60% of the country’s total. The total area<br />
liable to floods is about 40 million ha. The Rashtriya Barh Ayog (RBA), a national<br />
agency which is responsible for flood-related problems in India, estimates during the<br />
period 1953-1978, about 8.2 million hectares of area was affected by floods every year.<br />
Approximately 3.5 million hectares, or 42.7%, was cropped area. Annual average floodaffected<br />
area for the period 1970-1978 is about 11.9 million hectares, of which 5.4<br />
million hectares were cropped area, showing an increasing trend in the flood-affected<br />
area (NIH, 1993). In India, the need for flood control and management is increasingly<br />
important, and the following measures have been implemented:<br />
• Sound watershed management through extensive soil conservation<br />
• Catchments area treatment<br />
• Preservation of forests and increasing forest area<br />
• Construction of check dams<br />
44
Technical report of project (GT/1010-00-04)<br />
• Adequate flood cushion for water storage<br />
• Establishment of forecasting networks along with regulation of settlements<br />
and economic activity in flood plain zones<br />
• Use of structural measures (embankments and dykes) as well as nonstructural<br />
measures like flood forecasting and warning<br />
• Flood plain zoning<br />
Items<br />
Land area affected 7.56 million hectares<br />
Population affected 32.03 million<br />
Human lives lost 1,504<br />
Livestock lost 96,713<br />
Houses damaged 11,683<br />
Houses damaged (cost) Rs. 136.615 crore<br />
Crop damaged Rs. 460.07 crore<br />
Public utilities damaged Rs. 377.248 crore<br />
Total losses Rs. 982.126 crore<br />
Table 3.1-3 The average loss over the past four decades<br />
The hydrologic regime of the Brahmaputra responds to the seasonal rhythm of the<br />
monsoon and freeze-thaw cycle of Himalayan snow in the backdrop of a unique geoenvironmental<br />
framework. The river carries a mean annual flood discharge of 48,160<br />
m 3 /sec at Pandu (India) where the highest recorded flood was 72,748 m 3 /sec (1963) with<br />
a recurrence interval of 100 years. The flow hydrograph of the river is marked by<br />
exceedingly high variability of discharge during the monsoon high flow season – June<br />
through September. The average annual rainfall in the basin is 230 cm, with a marked<br />
variability in distribution over the catchments. Rainfall in the lower Himalayan region<br />
amounts to more than 500 cm per year, with higher elevations getting progressively lesser<br />
amounts. Occasionally, the rainfall intensity is exceedingly high, causing flash floods,<br />
landslides, debris flow and erosion. Few extreme climatic events recorded so far in the<br />
Eastern Himalaya have been analyzed. Their hydrological consequences are discussed<br />
mainly in regard to water-induced mountain disasters such as floods and landslides. The<br />
changing land use (mainly deforestation) and development, as well as population<br />
pressures in the region and their hydrological implications, are also highlighted with the<br />
help of selected illustrations. The impact of Himalayan neotectonics on the hydrologic<br />
regime of the Brahmaputra especially in regard to the 1897 and 1950 earthquakes (both<br />
of Richter magnitude 8.7) is discussed based on the analysis of observed hydrological<br />
data. The pattern of accumulation and depletion of snow and glacial cover in the Tista<br />
and Kameng sub-basins of the Brahmaputra is delineated using satellite remote sensing<br />
technique and melt water runoff is estimated. Strengthening of the hydro-meteorological<br />
monitoring network in the Eastern Himalayas especially with respect to the upper<br />
45
Technical report of project (GT/1010-00-04)<br />
catchments of the Brahmaputra River should be considered of primary importance for<br />
sustainable development of the immense water resources potential, preservation of its<br />
unique ecological wealth and for management of natural hazards.<br />
The average loss due to floods over the past four decades is shown in Table3.1-3.<br />
Fig. 3.1-6 Nearly 40 million hectares of land is vulnerable to floods, with about eight million<br />
hectares flooded annually<br />
India receives an annual rainfall of 400 million-hectare meters, of which 75% is<br />
received in four months. Floods generally follow with devastation. In the last four<br />
decades, the country has lost about Rs. 9,720 million in damages to crops, public utilities<br />
and houses. Nearly 40 million hectares of land is vulnerable to floods, with about eight<br />
million hectares flooded annually (Fig. 3.1-6). Ecological degradation caused by humans<br />
adds to the problem resulting from erosion, poor natural drainage and related problems.<br />
Although still a point of controversy, one of the causes of increased flooding in<br />
Bangladesh can be traced to Nepal and India (Assam), where the majority of the rivers<br />
originate. Massive deforestation of the mountainsides has significantly reduced the<br />
Himalaya's capacity to absorb the monsoon rains, and it has greatly increased the amount<br />
of eroded soil that is carried by the floodwaters.<br />
Flooding is the main hazard in the Ganges River basin. Although occurrence of<br />
floods has been an age-old phenomenon in the basin areas of this region, the extent of<br />
damage caused by the hazards has increased significantly in recent years. The Ganges has<br />
experienced major floods in 1954, 1962, 1966, 1972, 1974, 1978, 1983, 1986, 1988,<br />
1996, 1998, and 2000.<br />
46
Technical report of project (GT/1010-00-04)<br />
Fig. 3.1-7 An aerial view shows rising floodwaters at Karnool town in the Cuddapah<br />
district, some 420 km south of Hyderabad October 20, 2001. Andhra Pradesh on Saturday<br />
began counting losses and providing relief to victims of floods in which at least 73 people<br />
were killed earlier this week (Source: Reuters Limited, 2001)<br />
3.2 Historic analysis of floods<br />
3.2.1 Location of large flood events in Bangladesh, China and India<br />
Many floods have now been imaged by satellite or airborne sensors and translated<br />
into maps of inundation extents by Dartmouth Flood Observatory staff. Dartmouth Flood<br />
Observatory has built an archive. The information presented in this archive is derived<br />
from a wide variety of news, governmental, instrumental, and remote sensing sources. It<br />
is presented in order to facilitate research into the causes of extreme flood events, provide<br />
international warning of such floods, and improve widespread access to satellite-based<br />
measurements and mapping. The archive is "active" because current year events are<br />
added immediately. Analysis using remote sensing data also continues on past events and<br />
such additional information is added to this archive as it becomes available (Dartmouth<br />
Flood Observatory, 2002). Fig. 3.2-1 shows the location of large flood events in<br />
Bangladesh, China and India from 1985 to 2001.<br />
47
Technical report of project (GT/1010-00-04)<br />
Fig. 3.2-1 The location map of large flood events in Bangladesh, China and India from 1985<br />
to 2001 (Source: Dartmouth Flood Observatory, 2001,<br />
http://www.dartmouth.edu/artsci/geog/floods/), to be continuned on the next page<br />
48
Technical report of project (GT/1010-00-04)<br />
Fig. 3.2-1 The location map of large flood events in Bangladesh, China and India from 1985<br />
to 2001 (Source: Dartmouth Flood Observatory, 2001,<br />
http://www.dartmouth.edu/artsci/geog/floods/)<br />
3.2.2 Ganges/Brahmaputra and Yangtze River basins<br />
Table 3.2-1 shows a history (1985-2001) of the register of large flood events in<br />
the Ganges/Brahmaputra and Yangtze River basins.<br />
49
Technical report of project (GT/1010-00-04)<br />
Table 3.2-1 A history (1985-2001) of Register of Large Flood Events in Ganges/Brahmaputra and Yangtze river<br />
basins of Bangladesh, China and India (Source: Dartmouth Flood Observatory, 2001)<br />
Location Began<br />
- end<br />
1985<br />
N. India 08/01/<br />
-10/31/<br />
E. India 10/18/-<br />
10/20/<br />
1986<br />
India and<br />
Bang<br />
1987<br />
Bang and<br />
NE. India<br />
09/22/<br />
-10/10/<br />
07/23/<br />
-<br />
09/24/<br />
C. China 07/02/<br />
-<br />
07/23/<br />
C. China 06/24/<br />
-<br />
07/02/<br />
1988<br />
China 09/05/<br />
-<br />
09/14/<br />
NE. India<br />
and Nepal<br />
08/23/<br />
-<br />
09/15/<br />
Bang. 08/20/<br />
-10/03/<br />
Bang 06/27/<br />
-<br />
08/15/<br />
China 06/24/<br />
-<br />
06/28/<br />
NE. India 06/21/<br />
-<br />
07/14/<br />
Known<br />
dead<br />
Number<br />
displaced<br />
Damage<br />
estimate<br />
Flood<br />
type<br />
90 Monsoon<br />
rains<br />
38 30,000 Tropical<br />
storm<br />
India:<br />
19.<br />
Bang:<br />
30<br />
Bang:<br />
200,000<br />
-- India:<br />
300,000<br />
India:<br />
500,000.<br />
Bang:<br />
200,000<br />
Bang:<br />
1,000,000,0<br />
00<br />
Hectares or<br />
Acres<br />
flooded<br />
Monsoon Bang:<br />
2,890 sq miles;<br />
1.3 million<br />
acres crops<br />
Sustained<br />
heavy rains<br />
– Monsoon<br />
season<br />
Bang: 9,000<br />
square miles<br />
Geograp<br />
hic flood<br />
extents<br />
(km 2 )<br />
Notes and comments<br />
Three months of unusually intense<br />
Torrential monsoon rains<br />
200 missing; 500 villages had access cut off; deaths occurred by house collapse,<br />
drowning; storm came from Bay of Bengal, storm surge also likely involved. Orissa<br />
was washed away.<br />
"Meteorologists said more than 16 inches of rain fell on Calcutta and surrounding<br />
districts between Tuesday evening and Friday night, causing the Ganges River to<br />
breach its banks in many places."<br />
240,100 Bangladesh "According to rough official estimates, crops on 2.5 million acres of land<br />
have been affected, most of them beyond recovery. About 650,000 houses, mostly of<br />
mud and straw, have been partially or completely washed away and more than 5,300<br />
miles of roads have been damaged." -- August 13 "All of the country's major rivers<br />
have burst their banks for the second time since late July, with the waters destroying<br />
everything in their path on the way to the Bay of Bengal" -- August 26 "Officials<br />
estimate more than one fourth of the 55,126-square-mile country is under water and<br />
that 2.3 million acres of cultivated land have been destroyed by the floods.<br />
56 25,600 386,000 ha 268,100 Reports from the provincial water resources and electric power department warn, the<br />
water level of the chuhe river, a major tributary of the Yangtze river, reached a record<br />
high on July 7, while the flood level of<br />
The huaihe river surpassed the danger level at the border of anhui and henan<br />
provinces on the morning of July 8.<br />
100,000 Continuous<br />
heavy rains<br />
534 square<br />
miles<br />
42,901 Hectares of<br />
crop area in<br />
Assam --<br />
1,700,000<br />
hectares in<br />
Uttar Pradesh<br />
1378 28,000,000 2,000,000,00<br />
0<br />
Unusually<br />
strong<br />
monsoons<br />
254 5,250,000 450,000,000 Monsoon<br />
flooding<br />
65 500,000 76,000,000 Flooding<br />
and storms<br />
34 2,000,000 Incessant<br />
heavy rains<br />
139,900 The official newspaper said violent storms battered central Sichuan Province<br />
beginning June 24, with more than 19 inches of rain falling over two days Before the<br />
storms struck, the farming area had been in the grip of its longest drought in 40 years.<br />
Official’s say China may face unusually bad flooding this summer because of a long<br />
period of abnormal weather.<br />
200,000 47,800 Continuous heavy rains have severely waterlogged the donating lake area, one of the<br />
country's prime agricultural and commercial bases. Twenty-three counties and cities<br />
in hunan and hubei provinces have been affected. The inland lakes have overflowed<br />
flooding nearly 200,000 hectares of farmland. More than 100,000 people have been<br />
evacuated<br />
4,700,000<br />
hectares -- two<br />
thirds of<br />
Bangladesh<br />
inundated -- 2.5<br />
million acres of<br />
crops<br />
626,900 8/24 "the flood situation in india's northeastern state of assam further deteriorated<br />
today following alarming rise of the mighty brahmaputra river and its tributaries in the<br />
entire 800-kilometer-long brahmaputra valley from dibrugarh to dhubri" -- 8/29 " the<br />
brahmaputra river, in spate, wrecked havoc in santipur, bhutnath, fatasil and ambari<br />
areas. The entire brahmaputra valley was virtually in the grip of unprecedented<br />
floods." -- 9/5 "one hundred and eight people have been killed by floods and<br />
landslides caused by torrential rains at different districts in Nepal, according to the<br />
home ministry. This year's floods also damaged roads, bridges, canals, drinking water<br />
projects, culverts and public and private houses, causing a heavy loss of property to<br />
Nepal," -- 9/5 "the flood situation in India’s northeastern state of assam deteriorated<br />
again on Sunday with the brahmaputra river maintaining a rising trend, it was reported<br />
here today. Official reports from guwahati, capital of assam, said the brahmaputra was<br />
rising rapidly in dibrugarh following heavy rain in its catchment in the lower region<br />
on Sunday. While vast areas of dubri and goalpara remained submerged in lower<br />
assam the situation in other districts of upper assam continued to improve."<br />
138,900 "The floods destroyed an estimated 3.5 million tons of standing crops and stored<br />
grain. It washed away 2,200 miles of roads and razed eight million houses." --<br />
"SINCE 1 SEPTEMBER MORE THAN HALF OF BANGLADESH REMAINED<br />
FLOODED. 20 MILLION PEOPLE NOW AFFECTED IN 39 DISTRICTS." -- Sep<br />
7 "NEARLY 600,000 COMPETELY DESTROYED HOMES: 1.5 MILLION<br />
DAMAGED. TOTAL OF 30,000 KM ROADS PARTIALLY DAMAGED OR<br />
DESTROYED. RICE<br />
CROP ON 1.5 MILLION HECTARES DESTROYED AND SERIOUSLY<br />
DAMAGED ON 2 MILLION HECTARES. OFFICIAL ESTIMATESOF CROP<br />
LOSSES BETWEEN 1.5 – 3 MILLION TONS."<br />
3,000,000 acres 98,280 Roads throughout Sylhet and the surrounding districts of Sunamganj and Moulvibazar<br />
in the far northeastern corner of Bangladesh were also washed out or still under water.<br />
" -- July 16 "Officials at the Flood Control Ministry in Dhaka said today that water<br />
levels were receding in most flooded areas except Brahmanbaria and Manikganj" --<br />
July 26 "swollen rivers are overflowing their banks all across northeastern<br />
Bangladesh<br />
145,300 acres 33,860 Flooding and storms killed 65 people and injured 1,420 others in 36 counties of<br />
Sichuan province in late June, provincial officials said here today. In addition, 1,341<br />
head of livestock, 145,300 hectares of crops, 100 small hydroelectric stations and<br />
thousands of houses were destroyed<br />
108,375<br />
hectares in<br />
Assam<br />
70,500 Meanwhile the mighty brahmaputra and its major tributaries have flooded the lowlying<br />
areas of dibrugarh, tezpur and neamatighat. In the low-lying areas of guwahati,<br />
capital of the state, people had to wade through waist-deep water in some places " --<br />
July 7 "the flood situation in assam state worsened further on Wednesday with the<br />
brahmaputra and its several tributaries having past their danger mark and submerged<br />
vast areas in the upper region. Official reports received here said the rain-fed<br />
50
NE. India<br />
and E.<br />
Bang<br />
Technical report of project (GT/1010-00-04)<br />
05/23/<br />
-<br />
06/11/<br />
1993<br />
China 07/27/<br />
-<br />
08/01/<br />
China 07/03/<br />
-<br />
07/31/<br />
N. India,<br />
Nepal,<br />
Bang and<br />
Pakistan<br />
07/08/<br />
-08/13/<br />
E. China 06/15/<br />
-07/08/<br />
NE. India<br />
and Bang<br />
06/04/-<br />
06/22/<br />
1997<br />
S. Bang 03/19/<br />
97<br />
03/24/<br />
97<br />
1998<br />
Bang and<br />
NE. India<br />
07/05/<br />
-09/22/<br />
C. China 06/12/<br />
-06/27/<br />
E China 06/12/-<br />
06/28<br />
SW. 06/18/<br />
China -<br />
06/19/<br />
C. China 06/18/<br />
-<br />
07/13/<br />
SW. 06/27/<br />
China -07/13/<br />
SE. China 07/17/<br />
-08/05/<br />
C. China 08/05/<br />
-09/07<br />
India:<br />
26 --<br />
Bang:<br />
50<br />
India: 3000<br />
-- Bang:<br />
40,000<br />
Melting<br />
snow from t<br />
Himalayas<br />
and premonsoon<br />
rains in<br />
Bang<br />
41 7000 27,000,000 Three days<br />
heavy rain<br />
Jiangxi:<br />
42 --<br />
Hunan:<br />
129 --<br />
Guangxi<br />
: 196<br />
India:<br />
1050 --<br />
Nepal:<br />
1800 --<br />
Bang:<br />
218 --<br />
Pakistan<br />
: 15<br />
Zhejia<br />
ng: 38<br />
--<br />
Jiangxi<br />
: 61 --<br />
Hunan:<br />
33<br />
India:<br />
18 --<br />
Bang:<br />
220<br />
Jiangxi:<br />
210,000 --<br />
Hunan:<br />
500,000 --<br />
Guangxi:<br />
293,000<br />
India:<br />
3,000,000 --<br />
Nepal:<br />
200,000 --<br />
Bang:<br />
6,000,000 --<br />
Pakistan:<br />
170,926<br />
Zhejiang:<br />
355,000 --<br />
Jiangxi:<br />
20,000<br />
Zhejiang:<br />
526,000,0<br />
00 --<br />
Jiangxi:<br />
260,000,0<br />
00 --<br />
India:<br />
700,000 --<br />
Bang:<br />
250,000<br />
Jiangxi:<br />
205,000,000 -<br />
- Hunan:<br />
175,000,000 -<br />
- Guangxi:<br />
190,000,000<br />
India: nd --<br />
Nepal:<br />
100,000,000 -<br />
- Bang: nd<br />
India:<br />
28,600,000 --<br />
Bang: nd<br />
Rains,<br />
which fell<br />
from July 1-<br />
5. More<br />
rains in<br />
Hunan<br />
starting Jul<br />
17<br />
Unusually<br />
heavy<br />
monsoon<br />
rain<br />
Heavy<br />
rains<br />
across<br />
eastern<br />
china<br />
between<br />
June 11<br />
and 20<br />
and<br />
continuin<br />
g in early<br />
July<br />
25 5000 ITCZ<br />
convective<br />
rain or<br />
easterly<br />
wave<br />
2632 25000000 3400000000 Torrential<br />
monsoon<br />
rains<br />
40 400000 481000000 Torrential<br />
rain worst<br />
in 50 years<br />
in<br />
Changsha<br />
Xiangjiang<br />
exceeding<br />
record high<br />
level<br />
51<br />
27<br />
434500 240000000 Torrential<br />
rains<br />
164 370000 Worst since<br />
1991<br />
India:<br />
"Thousands of<br />
acres" -- Bang:<br />
200,000 acres<br />
in Sy lhet<br />
district<br />
brahmaputra, which had already crossed its danger mark at neamatighat, inundated<br />
about 25 villages in jorhat sub-division<br />
42,290 A total of 1,418 villages with a population of 835,005 have been affected by flood in<br />
India’s northeastern state of assam ... about 6,000 head of cattle and a vast area of<br />
paddy cultivation have been washed away in the flood-hit state" -- May 31 "A flash<br />
flood on the Kushiara River washed away an entire village of more than 200 people<br />
3,000 ha 9500 The record rainfall cut off all access roads to Emei City, a popular tourist destination,<br />
when it dropped 21 inches (52 mm) of rain in as many hours and inundated the city's<br />
railway station with 5 feet (1.5 m) of floodwater.<br />
Hunan:<br />
646,000 ha --<br />
Guangxi:<br />
65,000 ha<br />
India: 800,000<br />
hectares --<br />
Nepal: 24,000<br />
acres -- Bang:<br />
28,742 square<br />
km. 520,000<br />
ha -- Pakistan:<br />
798,315 Acres<br />
828,000 ha --<br />
Jiangxi:<br />
353,700 ha --<br />
Hunan:<br />
160,000ha --<br />
Fujian: 4,700<br />
ha<br />
Bang:<br />
150,000acres<br />
7,000,000 Ha<br />
( 3/4 of<br />
Bangladesh is<br />
submerged)<br />
130,000 Ha<br />
500,000 Ha<br />
170 240000 312500000 Yangtze’s<br />
highest in 6<br />
years<br />
85,000 Ha<br />
345 3120000 1310000000 Torrential<br />
rains<br />
continuing<br />
Yangtze<br />
flooding<br />
and major<br />
dyke break<br />
1,320,000 Ha<br />
575 1115000 3710000000 Continued 1,320,000 Ha<br />
119,000 Jiangxi - "... several rivers in northeast Jiangxi to break their banks ... Nine towns with<br />
210,000 residents were marooned by flood waters" – Hunan -"floods in central Hunan<br />
province had killed 78 people in 10 days" ... "some 72 counties, 1,555 towns and<br />
townships and 17,270 villages in the province were affected by floods" -- Guangxi -<br />
"the region experienced record torrential rains for five days in succession ... the hilly<br />
city of wuzhou at the confluence of xijiang, a tributary of the pearl river, xunjiang<br />
and guijiang rivers has suffered the most. Streets, markets, storage facilities and the<br />
port in the eastern part of the city are flooded<br />
531,500 India - "in the northern state of Punjab, where the heaviest rain in two decades left 16<br />
people dead over the weekend, and flooded two-thirds of Patiala city and some 1,100<br />
villages." -- July 24 "Nearly half of Bangladesh was under water Saturday after six<br />
days of relentless rain, and the death toll in four weeks of flooding throughout South<br />
Asia jumped to 2,100 people" -- Aug 13 "While floodwaters have receded from the<br />
plains of the north, India’s heartland, parts of the northeastern state of Assam still<br />
remain inundated." -- Aug 29 - "Monsoon floods have begun subsiding throughout<br />
Bangladesh<br />
432,800 Zhejiang - "In some parts of Zhejiang province, a foot of rain has fallen<br />
since June 14" -- Jiangxi - "During that period, 187 millimeters (7.4<br />
inches) of rain fell, quickly swelling rivers which flooded 353,700<br />
hectares (873,600 acres) of farm land and destroyed 43,600 homes." --<br />
Hunan - "most of central china's hunan province has been hit by heavy<br />
rainstorms since June 30" ... "in changsha, capital of the province, more<br />
than 3,000 houses in the western and southern parts of the city have been<br />
inundated." -- Fujian -"floods in the northern section of fujian province<br />
destroyed hundreds of houses, roads, bridges and irrigation works"<br />
259,000 India: "vast stretches of paddy fields have been inundated in the district as all the<br />
rivers are flowing at the extreme danger level. Road communication, train services<br />
and water and power supply were disrupted by the flash flood caused by incessant<br />
rains during the last few days"<br />
51
SW.<br />
China<br />
Technical report of project (GT/1010-00-04)<br />
08/03/<br />
-<br />
08/07/<br />
90 Torrential<br />
rains and<br />
Yangtze<br />
headwaters<br />
19 Torrential<br />
rains<br />
77 2000<br />
SW. 08/19/<br />
China -08/29/<br />
Bang. 06/09/<br />
NE. India -06/12/<br />
China 05/20/ 58 106000 247000000 Heavy rain 280,600 Ha<br />
-<br />
water level<br />
05/25/<br />
higher in<br />
some areas<br />
than<br />
1954<br />
in<br />
China 05/20/ 10 20000 10800000 Torrential<br />
rain such<br />
strong<br />
storms are<br />
rare hitting<br />
every 100<br />
years<br />
3,000 Ha<br />
China 05/20/<br />
-<br />
05/25/<br />
8 15000 206000ha<br />
farmland<br />
Bang. 05/20/<br />
Tropical<br />
98 -<br />
cyclone<br />
C. China 05/01/ 2000 Torrential 8,000 Ha<br />
rain<br />
damaged<br />
SW.<br />
China<br />
C.E.<br />
China<br />
05/07/<br />
03/06/<br />
-03/13/<br />
1999<br />
E. India 10/29/<br />
11/12/<br />
India and<br />
NW.<br />
Bang.<br />
S E.<br />
Bang and<br />
E. India<br />
09/24/-<br />
09/29/<br />
08/11/<br />
08/15/<br />
C. China 08/12/<br />
08/16/<br />
Bang and<br />
E. India<br />
07/11/<br />
08/03/<br />
Bang 06/21/<br />
07/06/<br />
SE.<br />
China<br />
C. and<br />
SE.<br />
05/26/<br />
06/23/<br />
05/18/<br />
05/21/<br />
2 130000<br />
Torrential<br />
rain<br />
Frontal<br />
storms<br />
record stage<br />
of 37.64 m<br />
in<br />
Changsha<br />
9,803 10,000,000 $2,300,000,0<br />
00<br />
India:<br />
41<br />
Bang: 4<br />
A cyclone<br />
struck with<br />
tidal waves<br />
and heavy<br />
rains<br />
causing<br />
flooding<br />
worst<br />
flooding in<br />
100 years<br />
$235,000,000 Torrential<br />
rains and<br />
heavy<br />
storms...hea<br />
vy monsoon<br />
floods<br />
18 50,000 Heavy<br />
rains,<br />
flooding<br />
and<br />
mudslides.<br />
77 120,000 $181,000,000 3 days of<br />
flash<br />
flooding<br />
after<br />
precipitatio<br />
n reaching<br />
295 mm in<br />
24 hours<br />
Bang:<br />
31 --<br />
India:<br />
325<br />
Bang:<br />
310,000 --<br />
India:<br />
3,000,000<br />
Monsoon<br />
Season<br />
during June<br />
and July --<br />
Heavy rain<br />
19 100,000 Torrential<br />
rain<br />
Rainy<br />
season<br />
69,200 200<br />
millimeters<br />
90,000 Ha<br />
'Large tracts of<br />
farmland<br />
20000ha<br />
1.711 million<br />
hectares crops<br />
have been<br />
affected<br />
Bang: 17,000<br />
hectares<br />
Experts attributed the flooding in the middle and lower reach of the Yangtze to El<br />
Nino<br />
Suitable AVHRR data located<br />
No suitable AVHRR data located<br />
300 ha No suitable AVHRR data located<br />
Homes and<br />
crop s of<br />
450,000 in<br />
Comilla<br />
District<br />
submerged. --<br />
48,000<br />
Hectares crops<br />
submerged in<br />
Comilla<br />
60,000 hectares<br />
crop s. –<br />
Jumuna River:<br />
1,600 hectares<br />
farmland lost<br />
along and 5,000<br />
hectares<br />
inundated<br />
300,000<br />
hectares crops<br />
52
Technical report of project (GT/1010-00-04)<br />
China of rain since damaged<br />
2000<br />
E. India<br />
and Bang<br />
NE. India<br />
N. Bang<br />
Bhutan<br />
Nepal<br />
China<br />
09/18/<br />
10/21/<br />
08/02/<br />
08/29/<br />
06/30/0<br />
7/27/<br />
Bang 06/19/<br />
06/25/<br />
E. India 06/10/<br />
7/10/<br />
2001<br />
C. China 06/19/<br />
06/23/<br />
C. China 06/19/<br />
06/23/<br />
NE India<br />
and Bang<br />
06/05/<br />
06/22/<br />
2002<br />
NE India 06/21/<br />
and Bang 07/15/<br />
C. China 06/23/<br />
07/12/<br />
C. China 06/15/<br />
06/23/<br />
NE India 06/12/<br />
and Bang 06/21/<br />
C. China 05/22/<br />
05/28/<br />
E. Bang. 04/18/<br />
04/28/<br />
India:<br />
1,358 --<br />
Bang:<br />
110<br />
India:<br />
300 --<br />
Banglad<br />
esh: 31 -<br />
-<br />
Bhutan:<br />
200 --<br />
Nepal:<br />
106<br />
Norther<br />
n: 14<br />
India:<br />
20,000,000<br />
-- Bang:<br />
4,000,000<br />
India:<br />
4,000,000<br />
in Assam<br />
5,500,000<br />
in all India.<br />
--<br />
Bangladesh:<br />
1,000,000 --<br />
Nepal:<br />
4,000<br />
Hubei: 12 -<br />
- Sichuan:<br />
18 --<br />
Shaanxi: 35<br />
Hubei:<br />
60,000 --<br />
Sichuan:<br />
3000 --<br />
Henan:<br />
25,000<br />
Northern:<br />
20,000<br />
India:<br />
700,000,000 -<br />
- Bang :<br />
"several<br />
million<br />
dollars worth<br />
of property<br />
and crops<br />
have been<br />
destroyed"<br />
India (Assam<br />
province):<br />
$50,000,000 -<br />
- Nep al:<br />
millions of<br />
rupees<br />
Flooding<br />
triggered by<br />
monsoon<br />
rains<br />
Hubei:<br />
$55,000,000<br />
-- Sichuan:<br />
$16,000,000 -<br />
- Shaanxi:<br />
$12,000,000<br />
(Ziyang only)<br />
Late<br />
monsoon<br />
rains that<br />
triggered<br />
flash floods<br />
Western<br />
Bangladesh:<br />
Torrential<br />
rains<br />
causing<br />
flooding<br />
and<br />
mudslides<br />
Monsoon<br />
rains<br />
30 50,000 Intial<br />
flooding on<br />
June 11<br />
caused by<br />
breach of<br />
landslideblocked<br />
river near<br />
Yigong,<br />
66 10,000 120,000,000 Seasonal<br />
rains<br />
66 10,000 120,000,000 Seasonal<br />
rains<br />
India: 5<br />
Bang:<br />
13<br />
India:<br />
700,000<br />
Bang:<br />
100,000<br />
Heavy<br />
monsoon<br />
rains.<br />
West Bengal:<br />
1,500,000<br />
hectares<br />
Assam:<br />
300,000Ha<br />
Hubei: 38,145<br />
hectares. --<br />
Sichuan:<br />
35,000<br />
hectares. --<br />
Shaanxi:<br />
119,000<br />
hectares. --<br />
Henan: 86,000<br />
ha.of farmland<br />
88 2,300,000 Monsoon<br />
rain<br />
170,000 276,600<br />
120,000,000 Rain 600,000<br />
53 32,000 50,740,000 Rain 476,000 130,300<br />
25,000 Rain 15,670<br />
943,000,000 Rain 590,000 156,100<br />
155,000 Flooding is common in the eastern India and Bangladesh at this time of year, but it is<br />
usually not as extensive or sudden." ... "Besides the flash floods triggered by incessant<br />
torrential storms, the disaster is also man made. Sluice gates of at least three dams<br />
were opened to stop the water barriers from bursting. This not only worsened the<br />
situation in West Bengal but the overspill of water entered the neighboring<br />
Bangladesh rendering nearly 100,000 people homeless" ... "The floodwaters have<br />
drowned much of the<br />
Indian-Bangladesh borders under 10 feet (3 meters) of water." -- Bangladesh: "The<br />
week-long floods have inundated the country's 10 western border districts, spared<br />
from devastating floods in 1998 when more than 1,200 people died.<br />
324,400 In all countries involved, landslides accompany the flooding. -- India: "The Assam<br />
government has sounded a maximum alert with the Brahmpautra flowing at least five<br />
meters (16 feet) above the danger mark." -- "In all, 3,568 villages in 16 districts have<br />
been inundated and crops in more than 197,031 hectares damaged. More than three<br />
million people have been affected by the floods." -- Bhutan: "the landslides blocked<br />
nearly the country's entire road network" – August begins to recede in Assam. -- Sep 5<br />
Eastern India - "The floods are receding in places and people have gone back to their<br />
homes. But there are large pools of stagnant water surrounding people's homes where<br />
water-borne diseases could proliferate"<br />
108,000 Yangtze River first flood crest of the season passed Yichang City site of Three Gorges<br />
Dam (news report dated July 6) -- ~200 people in Shaanxi province were killed 07/10<br />
- 07/11/00 in rain-triggered landslides.<br />
17,000 150 mud-thatch huts swept away by the Darala River, "At least 30 villages have been<br />
submerged in the Kurigram district, 240 kilometers north of the capital, Dhaka,<br />
according to the Flood Warning Center in Dhaka", 237 millimeters of rain recorded in<br />
4 days -- No suitable AVHRR or Landsat7 data located<br />
11,000 Ha 55,000 "worst flood to hit Arunachal Pradesh since 1959" -- June 26"The United News of<br />
India reported that the floods have inundated 250 communities in six districts and<br />
affected almost a quarter of a million people. " -- "Preliminary findings suggest the<br />
floods in Arunachal Pradesh were due to the breach of a dam on the Tsangpo, as the<br />
river makes a turn to enter India" – On April 9 a large landslide occurred that blocked<br />
the Yigong Zangbo River (a Bramaputra tributary) in eastern Tibet. A lake formed<br />
behind the earth dam which was breached on June 11, causing the flash floods<br />
downriver in Arunachal Pradesh, India<br />
19,275 4,850<br />
3600 "About 281 mm of rain fell in 10 hours over Suining causing mudslides in the<br />
mountainous area. More than 2,400 houses were destroyed while 250,000 livestock<br />
perished"<br />
3600 "About 281 mm of rain fell in 10 hours over Suining causing mudslides in the<br />
mountainous area. More than 2,400 houses were destroyed while 250,000 livestock<br />
perished"<br />
17,560 "The authorities have sounded the red alert in the states of Assam and Tripura<br />
where all major rivers have been swollen by incessant rains" "India's northeast state of<br />
Tripura, which was hit by heavy flood, remained cut off from the rest of the country<br />
for the third day Friday ... In the neighboring state of Assam, the situation was even<br />
worse with more than 200,000 people of nearly 100 villages in the southern part of the<br />
state affected" "Nearly 400 millimeters (16 inches) of monsoon rains not unusual for<br />
this part of the year have lashed Bangladesh's northeast since early this week. "<br />
53
Technical report of project (GT/1010-00-04)<br />
4 Parameters for risk monitoring, early warning and<br />
forecasting of floods<br />
4.1 Parameters for risk monitoring, early warning and forecasting of<br />
floods<br />
Flood-forecasting techniques include four main components:<br />
• Forecasts of meteorological parameters: Rainfall, Intensity, Timing, Duration<br />
• Hydrological process models: Meteorological and hydrological inputs, Depth and<br />
Discharge, Downstream flow as output<br />
• Mathematical hydraulic models: Description of river channel, characteristics of<br />
the flood<br />
• Combination models<br />
Meteorology is the study of the atmosphere and its phenomena. Weather and<br />
climate deal with the spectrum of these phenomena on different space and time scales.<br />
Weather systems are related from one region to another, and similar climate zones extend<br />
beyond national boundaries. In order to understand the climate and to predict the day-today<br />
weather, meteorological data from neighboring countries and all regions of the world<br />
are needed. In order to have country-to-country cooperation, the International<br />
Meteorological Organization (IMO) and the World Meteorological Organization (WMO)<br />
were established to cater to the need for exchange of meteorological data between<br />
countries. Standardization of instruments, observational procedures and archival of data<br />
were the cornerstones in the development of meteorology. Members of WMO developed<br />
plans and programmers to facilitate worldwide cooperation in the establishment of<br />
networks of observing stations for making meteorological, hydrological and related<br />
observations, and ensuring their rapid exchange. WMO launched the World Weather<br />
Watch (WWW) system in 1963. It operates on a 24-hour basis through the integrated<br />
efforts of the network of National Meteorological Service (NMSs) of all WMO Member<br />
countries. WMO coordinates data collection and exchanges from 10,000 land based<br />
stations, 1,000 upper air stations, 3,700 ships, 300 moored buoys, 600 drifting buoys as<br />
well as 3,000 aircrafts which provide over 7,000 additional observations on daily basis<br />
(Figure 4.1-1).<br />
54
Technical report of project (GT/1010-00-04)<br />
Fig. 4.1-1 Global Observing System (Source: WMO, 2001)<br />
4.2 Data requirements<br />
Data requirements for flood forecasting models include:<br />
• Hydrological data: Stream-flow measurements and peak flow measurements<br />
• Meteorological data: Rainfall intensity and duration, precipitation forecasts,<br />
and past data for rainfall-runoff models<br />
55
Technical report of project (GT/1010-00-04)<br />
• Topographic data: possible extent of inundation and watershed size<br />
• Geological / soil data<br />
• Demographic data<br />
• Land cover / land use data<br />
• Reservoir management principles<br />
• Post-flood damage assessments<br />
Fig. 4.2-1 Flood in Yangtze River of China. The image covers the flooded area around<br />
Poyang Lake and the Yangtze River. Ascending and descending ERS-2 SAR passes<br />
acquired on 7 July and 13 August 1998 are shown. (Source:ESA 2002).<br />
56
Technical report of project (GT/1010-00-04)<br />
5 Review of methodologies in developed countries<br />
Considering the loss of lives and property from any natural disaster, people<br />
benefit from prior information about the natural disaster. Some natural disasters are<br />
complex and their causes are not exactly known, so prior information is limited. The<br />
probable causes of floods are known but the parameters that control floods are dependent<br />
on numerous factors. These parameters are complex and their behavior is also complex.<br />
Accurate, timely prediction of the possible occurrence, location and magnitude of a<br />
specific flood can reduce loss of life and property. The forecast requires understanding<br />
of meteorology, hydrology and hydraulics. Flood experts have made efforts to integrate<br />
knowledge in these three fields to predict or forecast floods (Changnon, 2000).<br />
With the help of numerous satellites in space and remote sensing techniques,<br />
various countries and international agencies are developing early warning systems.<br />
Contrasts between flood forecasts and early warning efforts in developed and developing<br />
countries are identified below.<br />
5.1 History of Flood Warnings<br />
The Romans used dams and diversions in attempting to reduce potential floods<br />
and to manage water resources. Concerns about floods have existed in United States since<br />
the first settlers came to New World. Early efforts to reduce flood related deaths and<br />
damages, however, were primarily devoted to flood control measures such as levees,<br />
dams, and storage reservoirs. Flood warning systems were not feasible until suitable<br />
communication systems were developed.<br />
Early flood warning systems for people living along streams undoubtedly<br />
involved personal travel and verbal exchange of information. Communication systems<br />
such as the telephone greatly improved the timeliness of flood warnings. Federal, state<br />
and local water management agencies began to remotely access data from USGS gauging<br />
stations in the 1930s using an instrument called Telemark. When accessed by telephone,<br />
Telemark transmitted a river stage by a series of beeps or rings. Very high frequency<br />
radio also began to be used in the 1930s to obtain river stage data. By the 1950s river<br />
stages could be accessed at hundreds of USGS gauges throughout the U.S. to forecast<br />
floods, provide flood warnings, and for water management purposes.<br />
The continued evolution of communication and stage sensing equipment has<br />
further improved data access for flood warning and flood forecasting purposes. The<br />
principal device currently in use is a gauge for obtaining near real time for flood warning<br />
or other water management purposes. Another device transmits data via satellite to a<br />
receiving station, where the data are then relayed to equipment with conventional radio<br />
and telephone systems. This contributes to the timeliness of data critical for warning or<br />
water management purposes.<br />
The initial use of remotely accessed data to forecast floods was often limited to<br />
the interpretation of correlative relations that existed between different streams or streams<br />
locations, which required a great deal of intuitive expertise and knowledge on the part of<br />
the river or weather forecaster. The rapid development of more sophisticated computer<br />
systems since the 1970s, however, has permitted large amounts of data to be incorporated<br />
into computer simulations models for more accurate and timely forecasting.<br />
57
Technical report of project (GT/1010-00-04)<br />
5.1.1 From 1970s to 1990s<br />
Numerous researchers have laid down the foundations of a scientific approach to<br />
flood warning systems during the 1970s and early 1980s. They have culminated in a<br />
decision-theoretic methodology for modeling and evaluating forecast-response systems<br />
for floods on main-stem rivers (Krzysztofowicz and Davis, 1983), a comprehensive set of<br />
design requirements for flash flood warning systems (Georgakakos, 1986), and<br />
development plans for improving hydrologic services to the Nation (NWS, 1982;<br />
Hudlow, 1988).<br />
The revived interest in warning systems as a means of reducing negative<br />
consequences of floods and a viable alternative or an addition to traditional structural<br />
flood controls such as dams, levees and diversion channels, stimulated new research<br />
activities in the last four decades. This research has three prongs: (1) a multi-objective<br />
decision technique which offers a tool for planning and operating flood warning systems,<br />
(2) a Bayesian theory has been formulated for comprehensive studies of local flood<br />
warning systems, and (3) several applications of the Bayesian theory.<br />
A Multi-objective Technique<br />
The classical method of computing the expected annual flood damage, based on a<br />
stage-damage function and a probability distribution of the annual flood peak, has been<br />
extended by Haimes et al. (1994). The extension includes a calculation of the expected<br />
annual damage along with solutions that combine structural flood controls and a warning<br />
system. In a case study, four alternative plans have been compared: do nothing, construct<br />
levees, install a warning system, construct levees and install a warning system. The<br />
comparison was based on three criteria: average annual cost, expected annual flood<br />
damage, and restricted expectation of the annual flood damage caused by peaks higher<br />
than the T-year event (T = 10 and T = 100). This methodology is important in that it<br />
places the flood warning system on a par with structural measures and demonstrates how<br />
methods used by the U.S. Army Corps of Engineers in project feasibility studies can be<br />
supplemented with a formal multi-objective analysis.<br />
Under the assumption the decision rule for issuing a flood warning is of the<br />
threshold type (i.e. a warning is issued whenever the forecasted flood crest exceeds a<br />
threshold), Haimes et al. (1990) proposed a model for selecting the threshold. Imbedded<br />
in the model are four postulates: (1) the threshold currently in effect should be a function<br />
of the fraction of people in the community who responded to the previous warning, (2)<br />
this fraction decreases after a false warning and increases after a detection, (3) A fixed<br />
number of future events (marked by floods and false warnings) should be considered<br />
when selecting the threshold, (4) the selection should be Pareto-optimal with respect to<br />
the maximization of three objectives: the expected property damage reduction in the<br />
course of all events, the expected life loss reduction in the course of all events, and the<br />
expected fraction of people who will respond to the warning after the last event. A<br />
weighting method in conjunction with dynamic programming has been used to find<br />
solutions in a case study (Li et al., 1992).<br />
The approach leaves unanswered several methodological questions. Two of them<br />
point out the possible research directions. (1) Why is it desirable, from either the<br />
normative or the behavioral point of view, to change the warning threshold after each<br />
58
Technical report of project (GT/1010-00-04)<br />
event? Since such a change alters the probabilities of detection and false warning, the<br />
reliability of warnings becomes non-stationary and the public can no longer rely on<br />
experience to learn appropriate responses. (2) How should one choose the number of<br />
events (stages) for the dynamic programming? Since the probabilities of detections and<br />
false warnings remain unknown until a realization of thresholds is observed, a fixed<br />
number of events does not determine the length of time over which these events occur,<br />
and thus one cannot apply the usual notion of a planning horizon.<br />
A Bayesian Theory<br />
The theory, which derives from Bayesian principles of rationality, offers a<br />
methodological framework and mathematical concepts for modeling warning systems in<br />
communities exposed to flash floods or rapid river floods. Models may be used (1) to<br />
develop optimal decision rules for issuing warnings, (2) to evaluate system performance<br />
statistically, and (3) to compute the expected economic benefits from a system<br />
(Krzysztofowicz, 1993a).<br />
A flood warning system is decomposed into a monitor, a forecaster, and a decider.<br />
The monitor is characterized by the diagnosticity and reliability parameters. Floods are<br />
characterized by a prior distribution of the crest height and time to crest; the forecaster is<br />
characterized by a family of likelihood functions of the actual crest, conditional on the<br />
forecasted crest. The decider is characterized by a disutility function that quantifies the<br />
relative undesirability of outcomes (such as response cost, property damage, lives lost)<br />
and whose expectation provides a criterion for decision-making. Given these inputs, the<br />
theory provides three principal outputs: (1) an optimal warning rule, which prescribes<br />
whether or not to issue a warning based on an imperfect forecast of the flood crest, (2) a<br />
relative operating characteristic, which shows feasible trade-offs that a given system<br />
offers between the probability of detection and the probability of false warning, and (3)<br />
utilitarian measures of performance: the annual value of a given warning system, and the<br />
potential annual value of a warning system for a given floodplain.<br />
The models of the monitor and the forecaster quantify all uncertainties associated<br />
with operation of the warning system, from the viewpoint of a decision maker. At the<br />
heart of this quantification is the Bayesian processor of forecasts (BPF) that outputs a<br />
posterior description of uncertainty about flood occurrence and crest height, conditional<br />
on a flood crest forecast.<br />
One of the formidable challenges in applying the BPF in this and other contexts<br />
has been modeling of likelihood functions and derivation, or computation, of the<br />
posterior distribution when the prior distribution is not a member of the conjugate family<br />
for a specified likelihood model. Apart from the convenient normal-linear BPF, there are<br />
virtually no suitable analytic models. This has been a major hurdle in applying Bayesian<br />
methods to forecasts of flood peaks whose distributions are anything but gaussian. A<br />
general analytic solution for the BPF has been found: the posterior distribution can be<br />
obtained for any prior distribution, parametric or nonparametric (Kelly and<br />
Krzysztofowicz, 1994a).<br />
Applications of Bayesian Theory<br />
The reliability of a flood warning system can be characterized statistically in<br />
terms of two measures: (1) the relative operating characteristic (ROC), defined earlier,<br />
59
Technical report of project (GT/1010-00-04)<br />
and (2) the performance trade-off characteristic (PTC), which shows feasible trade-offs<br />
that a given system offers between the expected number of detections per year and the<br />
expected number of false warnings per year. When the floodplain extends across a range<br />
of elevations, the ROC and PTC are defined for each zone of the floodplain<br />
(Krzysztofowicz, 1992b).<br />
Numerical procedures for computing the ROC and PTC have been derived and<br />
applied to flood warning systems serving three communities in Pennsylvania. The case of<br />
Milton demonstrates fundamental trade-offs between the reliability and the expected<br />
lead-time of warnings. The case of Connellsville demonstrates synergistic gains in<br />
warning reliability due to a coupled solution: a flood warning system and a flood control<br />
dam upstream (Krzysztofowicz et al., 1994).<br />
In order to synthesize information for strategic planning and policy decisions,<br />
envelopes of ROCs have been constructed; they display graphically the overall reliability<br />
of flood warning systems within a region. A case study presents ROC envelopes of<br />
warning systems for uncontrolled rivers in Pennsylvania from 1960-1980 (Kelly and<br />
Krzysztofowicz, 1994b).<br />
Finally, the BPF has provided a framework for studying the synergistic effect of a<br />
dam and forecasts. In essence, the dam changes not only (1) the natural regime of flood<br />
flows (and hence the prior distribution in the BPF), but also (2) the predictability of flood<br />
flows (and hence the likelihood function in the BPF). These changes affect the posterior<br />
probability of flood occurrence and the posterior distribution of the flood crest. These<br />
effects have been illustrated with a case study (Kelly and Krzysztofowicz, 1994c).<br />
5.1.2 Artificial Neural Network Model<br />
The ANN model has been designed with the capability of real-time updating so<br />
that the estimates can be improved using ground based observations from various<br />
sources. Currently, rainfall estimates computed by the NEXRAD system (composite with<br />
older radars to provide full coverage of the continental U.S.) are being used for testing<br />
and evaluation. NEXRAD reflectivity data and SSM/I microwave data are provided by<br />
the Global Hydrology Resource Center (GHRC) at the Global Hydrology and Climate<br />
Center, Huntsville, Alabama. http://microwave.msfc.nasa.gov/<br />
The CD-ROM contains one full year (August 1, 1998 through July 31, 1999) of<br />
tropical surface rainfall-rate estimates for the oceanic and continental region<br />
encompassed by 80E-10W longitudes and 35S-35N latitudes. The remotely sensed data<br />
from multiple satellite sources-three geosynchronous satellites (GOES-8, GOES-10, and<br />
GMS-5) and the EOS/TRMM satellite-by the PERSIANN system (Precipitation<br />
Estimation from Remotely Sensed Information using Artificial Neural Networks) (Hsu, et<br />
al., 1997; Hsu et al., 1999) were developed at the Department of Hydrology and Water<br />
Resources, The University of Arizona. This data set is designed for use by various<br />
groups, including large-scale climate, weather and hydrology communities. In particular,<br />
the data was processed at spatial and temporal resolutions compatible with atmospheric<br />
modeling, with the intention that both the modeling and analysis communities can use it<br />
in investigations of the evolution of tropical/subtropical rainfall systems, their interannual,<br />
inter-seasonal and diurnal variations, the difference in rainfall over oceans and<br />
over land, and the transition from the 1998 El Niño to the 1999 La Niña. This data set<br />
(Version 1.0) represents a first effort to implement the PERSIANN system into the<br />
60
Technical report of project (GT/1010-00-04)<br />
development of an operational global-scale database. This version omits the use of GOES<br />
daytime visible imagery in conditioning the estimates, and does not give special<br />
consideration to explicitly discriminating between retrievals over land, coast and ocean<br />
(Sorooshian et al., 2000). Further, the regions covering Africa and India (Meteosat) are<br />
not included. Extensions of the data set are ongoing, and Version 2.0 is expected to<br />
incorporate these and other improvements, such as information about the uncertainty of<br />
the estimates. However, the rainfall-rate estimates provided in this data set have been<br />
extensively evaluated by comparison with ground-based observations (gauge, radar) and<br />
with TRMM rainfall products (Sorooshian et al., 2000).<br />
5.2 Flood prediction in the U.S.<br />
Floods in the U.S. caused over $30 billion in damages between 1993 and 1997,<br />
more than any other natural hazard (Changnon, 2000). In the U.S., loss of life from floods<br />
is third after temperature extremes and lightning (Changnon et al., 1996). Floods create<br />
long-lasting effects on the economic productivity of any country as well as on the health<br />
of its people.<br />
The National Weather Service (NWS) of the National Oceanic and Atmospheric<br />
Administration (NOAA) is the federal agency in charge of weather forecasts and<br />
warnings for the nation. NWS is also charged with the responsibility of issuing forecasts<br />
and warnings of floods. Flooding caused by rainfall along major rivers takes many hours<br />
and even weeks to develop. Floods caused by snowmelt runoff may take months to<br />
develop. Flash floods occur when intense precipitation falls during a brief time span on<br />
smaller rivers; the time between the onset of intense precipitation and the cresting of the<br />
river during a flash flood is hours instead of days. More than 10,000 precipitation and<br />
stream flow stations, including more than 3,000 stream flow gauges operated by the<br />
USGS, provide hydrologic data to NWS offices across the country for use in the floodforecasting<br />
program. Hydrologic data collection at stream gauging stations is telemetered<br />
through the Geostationary Operational Environmental Satellite (GOES) to regional data<br />
centers.<br />
The NWS routinely issues flood forecasts for approximately 4,000 locations in the<br />
United States. The NWS has responsibility for issuing storm warnings, display of<br />
weather and flood signals for the benefit of agriculture, commerce, and navigation, and<br />
gauging and reporting of rivers. To develop flood forecasts, the NWS relies on a number<br />
of other federal agencies to achieve its mission, particularly the USGS and the Army<br />
Corps of Engineers (COE; the Corps). Within the NWS, the Office of Hydrology has<br />
responsibility for collection and processing of hydrologic data for river and floor<br />
forecasts (Stallings and Wenzel 1995. The NWS also is home to five regional<br />
hydrologists who have expertise on flood threats in different parts of the nation. Figure 5<br />
shows the organization of the NWS Office of Hydrology as of the mid 1990s.<br />
In order to monitor the river systems, the NWS operates 13 River Forecast<br />
Centers (RFCs) across the nation, each centered on at least one major river basin. The<br />
RFCs provide flood information to NWS Forecast Offices, where the information is<br />
distributed to city, county and state officials as well as to the public. About three<br />
thousand communities are served by the 13 RFCs, each of which has a staff of about 16<br />
(Stallings and Wenzel, 1995). In periods of normal river flows, RFCs produce stream<br />
flow forecasts for large operations as well as water management decisions for<br />
61
Technical report of project (GT/1010-00-04)<br />
applications such as electric power generation. RFCs also work with local communities<br />
to help them better prepare for floods and flash floods.<br />
The process of the development of a flood forecast for public dissemination<br />
typically involves three steps:<br />
• Observations (precipitation, temperature, etc.) to estimate the net amount of<br />
water entering the (river) basin from rainfall and/or snowmelt<br />
• The net input of water (from rainfall or snowmelt) into a volume that enters<br />
the stream (runoff)<br />
• The volume rate of water (discharge) that flows from a point in the stream to<br />
points farther downstream<br />
5.2.1 Hydro-meteorological Data<br />
Stream flow data is an essential component of flood forecasting. The streamgauging<br />
program of the USGS is the largest national program responsible for the<br />
collection and dissemination of stream flow data. This effort is supported by more than<br />
six hundred federal, state, and local agencies and organizations. In 1994, only 549<br />
stations (of more than 7,000 total) were funded solely by the USGS. The Natural<br />
Resources Conservation Service, Salt River Project, Tennessee Valley Authority, and<br />
NOAA are important contributors to the collection of stream flow data. The USGS<br />
opened its first stream-gauging station in 1889 on the Rio Grande River and by 1994<br />
operated a total of 7,292 stations throughout the country. Of these stations, about 3,000<br />
contribute data used by the NWS to forecast floods. In addition to flood forecasting, the<br />
stream-gauging program collects data that are used in water resources planning,<br />
hydrologic research, and the operation of water resources projects (such as dams).<br />
Stream flow data are also collected through the NWS hydrologic network of about<br />
11,000 private citizens. Some of these volunteers report river and rainfall information to<br />
their local Weather Service Office or Weather Service Forecast Office on a daily basis.<br />
This information is tabulated and communicated to the appropriate RFC for use in river<br />
and flood forecasts.<br />
The spatial and temporal records of stream flow in the U.S. expanded throughout<br />
the twentieth century for a number of reasons. Early in this century, irrigation and<br />
hydroelectric power needs created demand for stream flow information. The extensive<br />
drought of the early 1930s, followed by extreme flooding later in that decade in the Ohio<br />
and Potomac river basins, created a demand for better understanding of extreme low- and<br />
high-water flows on major rivers. Also, the continental U.S. contains more than 846,000<br />
drainage basins that are between one and two square miles in size and in the 1950s, the<br />
establishment of the Federal Interstate Highway system created a need to estimate<br />
potential flood flows at the many locations where interstate highways pass over small<br />
streams and drainages. Finally, the establishment of the National Flood Insurance<br />
Program in 1968 created a demand for data on floodplain mapping and flood frequency.<br />
The stream-gauging program developed incrementally over the past one hundred years.<br />
Today, it provides valuable data for flood forecasts and other water resources-related<br />
uses. Data collected through the stream-gauging program includes the stage of a river to<br />
find out the height of the water surface above a reference elevation, which is important<br />
for mapping of flood plains. For flood forecasts, discharge of rivers is important. The<br />
discharge is defined as the volume of flow passing a specified point in a given interval of<br />
62
Technical report of project (GT/1010-00-04)<br />
time and includes the volume of water and any sediment or other solids that may be<br />
dissolved or mixed with the water. Discharge is typically expressed in cubic feet (or<br />
cubic meters) per second and is often determined through direct measurement or through<br />
a statistical relation with the stage level. Discharge is a fundamental input to hydraulic<br />
models. The relationship between river stage and discharge for a specific location,<br />
determined empirically, is known as the rating curve. Using a rating curve, one can<br />
easily convert between stage and discharge.<br />
National<br />
Headquarters<br />
Water Management<br />
Information<br />
Division<br />
Thirteen<br />
River Forecast<br />
Centers<br />
NOAA Assistant<br />
Admin. For NWS<br />
Director’s Office<br />
For Hydrology<br />
Hydrologic<br />
Operation<br />
Division<br />
Field Offices<br />
WSFOs/WSOs<br />
Service<br />
Hydrology Program<br />
Hydrologic<br />
Research<br />
Laboratory<br />
Regional Director<br />
Regional Hydrologist<br />
Fig. 5.2-1 Flow chart of National Weather Service’s office of Hydrology<br />
5.2.2 National Weather Service River Forecast System<br />
Interagency<br />
Intra-agency<br />
& University<br />
Interface<br />
The river Forecast Centers use a set of hydrologic models called the National<br />
Weather Service River Forecast System (NWSRFS) to turn raw data into flood forecasts.<br />
The NWSRFS provides a number of different procedures and models to characterize<br />
snowmelt, rainfall and runoff, runoff distribution, and channel routing to the hydrologists<br />
to develop a flood forecast (Larson et al., 1995). Hydro-meteorological data are used into<br />
hydrological models in order to produce flood forecasts. In areas where snow has<br />
accumulated, the forecast must combine outputs of a snow model, a soil moisture model,<br />
and a flow model. A snow model takes precipitation and temperature data as input and<br />
sends its output (melt + rain) to a soil moisture model. In addition to the snow model<br />
output, the soil moisture model also uses as input data on soil type, slope, land use,<br />
season, vegetation, and other parameters. The output of a soil moisture model is a<br />
calculation of runoff from a particular drainage basin. Runoff is described using the<br />
observed relationship between precipitation (or melt) and discharge over time for a<br />
particular drainage basin. Finally, a flow model is used to combine runoff from different<br />
headwater basins where they flow together.<br />
63
Technical report of project (GT/1010-00-04)<br />
The flood forecasts would benefit from improvements in quantitative precipitation<br />
forecasting (QPF), a technique that predicts the amount of precipitation that will fall over<br />
a particular area over a given period. The goal of using QPF in the flood forecasting<br />
process is to provide a longer lead-time for flash flood (i.e., floods that occur within a<br />
twelve-hour period or less on the upstream branches of a river basin) and river stage<br />
forecasts. Of course, the potential success of this tool depends in large part on the ability<br />
to forecast reliably the amount of precipitation that will fall over a particular watershed.<br />
The effective use of QPF has not been fully achieved. Studies of the use of QPF show<br />
benefits to decisions associated with flood warning, reservoir control, and commercial<br />
navigation (Krzystofowicz 1995). In recent years, flood forecasts have improved with<br />
the use of advanced radar technologies to identify in real time (as well as to forecast)<br />
areas of heavy rainfall, development of more accurate rainfall-runoff models, and<br />
improved collection of field data (Krzysztofowicz 1995).<br />
5.2.3 Recent advances associated with flood forecast and warning systems<br />
(University of Virginia, Charlottesville)<br />
Flash Flood Forecast<br />
a. Rainfall-Runoff Models<br />
Various problems associated with forecasting flash floods caused by convective<br />
storms over semi-arid basins have been studied by Michaud and Sorooshian (1994).<br />
Using data from 24 storms which occurred over a 150 km basin instrumented with 8 rain<br />
gauges and 10 stream gauges, a comparison of the performance of three rainfall-runoff<br />
models has been made: (1) a simple lumped model, (2) a simple distributed model (both<br />
using unit hydrographs), and (3) a complex distributed model (using kinematics<br />
equations). Based on mean square error of simulated peak flow, time to peak, and runoff<br />
volume, the lumped model was outperformed by both distributed models, which<br />
performed equally well. These results corroborate the known precepts (1) that the spatial<br />
distribution of rainfall is an important predictor of flash floods, and (2) that the law of<br />
diminishing gains does apply to complexity of hydrologic models. The complex<br />
distributed model was used next in a simulation exercise, where the runoff hydrograph<br />
was computed based solely on rainfall observed up to the forecast time, and a flood<br />
warning was declared whenever the computed flood crest exceeded a threshold.<br />
Computations were repeated at 15-minute intervals. After 24 flood events, the estimates<br />
of the warnings (probability of flood, given warning) and the reliability of warnings<br />
(probability of warning, given flood) were found equal to 0.71, and the average lead<br />
times of warnings ranged from 30 to 75 minutes. Michaud and Sorooshian (1994b) have<br />
confirmed the obstacles in flash flood forecasting: (1) even a relatively dense rain gauge<br />
network (one gauge per 20 km) may be insufficient to detect convective rainfall and<br />
estimate its spatial coverage and depth, and (2) without rainfall predictions, the reliability<br />
and lead time of warnings are severely constrained. The effect of the rain gauge density<br />
and rainfall sampling frequency on the accuracy of the computed hydrograph dimensions<br />
(crest height, time to crest, and total runoff volume) has been investigated by Krajewski<br />
et al. (1991) via a Monte Carlo simulation. A stochastic model of convective storms<br />
generated rain, while a distributed rainfall-runoff model with high spatial resolution (one<br />
rain gauge per homogeneous area of 0.1 km) and high rain sampling frequency (every 5<br />
64
Technical report of project (GT/1010-00-04)<br />
minutes) was assumed to generate the true runoff hydrograph from 7.5 km rural<br />
catchments. Against true hydrographs, hydrographs from four less refined models were<br />
compared, having one gauge per 1.5 km and 7.5 km, and sampling rainfall once per hour.<br />
Based on errors of the hydrograph dimensions, the authors concluded that the model<br />
performance was sensitive more to the frequency of rainfall sampling (5 min versus 1<br />
hour) than to the density of rain gauges (one per 0.1 km versus one per 7.5 km). Only<br />
four cases of density-frequency parameters were investigated, precluding the generality<br />
of the conclusion. But if this is a general law, then it holds a message for forecasters:<br />
concentrate limited resources not on forecasting point precipitation, but on forecasting<br />
spatial averages and timing of the precipitation.<br />
b. Rainfall Estimates from Radar<br />
Some major advances in both theory and operations have been made by new<br />
technology: Weather Surveillance Radar 1988 Doppler (WSR-88D). Known as the Next<br />
Generation Weather Radar (NEXRAD) system, a network of about 160 of these radars<br />
were deployed by the NWS during the 1990s to cover all contiguous states. With a<br />
rainfall detection range of about 230 km and an array of products generated from the<br />
return signal, these radars are changing the view of operational forecasters on detection of<br />
local storms, estimation of rainfall coverage and intensity, and ultimately forecasting<br />
headwater floods and flash floods.<br />
Potential gains from using weather radar in flood forecasting have been studied by<br />
James et al. (1993). A distributed rainfall-runoff model was applied to a 785 km basin<br />
equipped with two rain gauges and covered by radar. Data recorded during a past storm<br />
have provided inputs for computing three flood hydrographs from (1) rainfall recorded by<br />
rain gauges, (2) radar estimates of rainfall, and (3) combined rain gauge measurements<br />
and radar estimates. The hydrograph computed from the combined input was closest to<br />
the observed hydrograph.<br />
c. Rainfall Prediction from Radar<br />
The second benefit of weather radar derives from an observation that the<br />
trajectory of storm dynamics (velocity, azimuth, and intensity) estimated from subsequent<br />
radar scans may contain predictive information. Thus, even a short-term (0 - 3 hours)<br />
prediction of the precipitation field may be informative. Such a prediction offers the<br />
potential for better flash flood warnings.<br />
In the 1980s, research concentrated mostly on estimation of rainfall rates from<br />
radar reflectivity and on prediction of rainfall rates through projection of trends detected<br />
in a time series of reflectivity fields. Some of these efforts were reviewed by Chen and<br />
Kavas (1992), who introduced a radically new technique. Harnessing concepts from<br />
pattern recognition theory, the technique decomposes the radar image of the rain field<br />
into constituent polygonal contours, whose evolution in time and space is tracked through<br />
subsequent radar images and then projected into the future via an adaptive exponential<br />
smoothing scheme. By recomposing the projected contours at a desired lead-time, a<br />
prediction of the rain field is obtained. The technique was validated for lead times up to<br />
30 minutes on historical radar data from one storm with encouraging results.<br />
65
Technical report of project (GT/1010-00-04)<br />
d. Rainfall Prediction from Multiple Sensors<br />
The bulk of research in the last four decades centers on integrating radar data with<br />
data from other remote sensors, such as satellites, radiosondes, and ground stations, into<br />
predictive models of rainfall. The framework for integration has been a mathematical<br />
model describing the physics of the convective precipitation process.<br />
The potential utility of radar reflectivity as an additional input to a physically<br />
based spatially lumped rainfall model was explored by Georgakakos and Krajewski<br />
(1991). Their model was intended for making predictions of mean aerial rainfall over<br />
river basins of the order of 100-1000 km, with the lead-time of one hour. A comparison<br />
of forecast error variances obtained with and without radar data indicated that a reduction<br />
of 5-15% in variance could be attained.<br />
Seo and Smith (1992) have formulated a two-component model for prediction of<br />
convective rainfall under the radar umbrella. The principal assumption is that the<br />
vertically integrated liquid water, as a function of time and space, is equal to the sum of a<br />
time-varying mean and a residual that varies in time and space. A physically based model<br />
predicts the mean using radar data, surface measurements of temperature, dew point<br />
temperature and pressure, and radiosonde profiles of environmental temperature and<br />
water vapor density. A statistical autoregressive model predicts the residual. Validation<br />
was limited to seven historical storms that also provided data for parameter estimation.<br />
Rainfall fields estimated from radar reflectivity have been assumed to be the ground<br />
truth. Predictions have been made every 10-12 minutes, for one hour ahead and an area of<br />
80,000 km. Based on the mean square error criterion, the model forecasts outperformed,<br />
though not substantially, the advection forecasts (obtained via a translation of the current<br />
rainfall field, estimated from radar data at the forecast time, by the mean velocity vector<br />
one hour into the future).<br />
Another predictive model was developed by French and Krajewski (1994). The<br />
model rests on the conservation of mass and momentum laws in which states and<br />
boundary conditions are parameterized directly in terms of radar reflectivity (a predictor<br />
of liquid water content) satellite infrared brightness (a predictor of cloud top<br />
temperature), and surface air temperature, dew point temperature and pressure. For<br />
applications, state dynamics are linearized and states are updated based on sensor<br />
measurements via a Kalman filter. In a verification study, reported by French et al.<br />
(1994) using historical data from three storms, predictions of the rainfall rate were<br />
computed every 10-15 minutes for the lead-time of one hour and an area of 170,000 km.<br />
According to the mean error, mean square error, and the correlation between forecasted<br />
and measured (via the same radar) rainfall rates, the model forecasts out-performed the<br />
persistence forecasts (obtained under the assumption that the currently observed rainfall<br />
will continue for one hour) and performed somewhat better than the advection forecasts.<br />
Main-Stream Flood Forecast<br />
a. Stream Flow Models<br />
To forecast stream flow in headwater basins, the NWSRFS. The system consists<br />
of three conceptual models: (1) spatially lumped rainfall-runoff model, (2) spatially<br />
66
Technical report of project (GT/1010-00-04)<br />
lumped soil moisture accounting model, which is a modified version of the Sacramento<br />
model, and (3) channel routing model in the form of a cascade of nonlinear reservoirs.<br />
In routine operations, stream flow forecast is computed once a day for up to 10<br />
days into the future. For instance, the Ohio River Forecast Center disseminates forecasts<br />
for about 110 river gauges. The forecast for a gauge specifies estimates of stages at 7 AM<br />
in 24, 48, and 72 hours, and estimates of flood crest and time to crest, if a flood event is<br />
probable. During floods, updated forecasts are produced more frequently.<br />
The NWSRFS has received two enhancements. Georgakakos and Smith (1990)<br />
implemented an extended Kalman filter that updates the system based upon discharges at<br />
the basin outlet observed up to the forecast time. The implementation assumes that the<br />
dominant sources of forecast uncertainty are errors in estimates of model parameters and<br />
errors in observations of model inputs. Under these constructive assumptions, the<br />
deficiency of earlier hydrologic Kalman filters which lacked a procedure for estimating<br />
the time-varying covariance matrix of errors have been overcome. The second advance<br />
was reported by Sorooshian et al. (1993), who developed a global optimization procedure<br />
well suited to estimate parameters of conceptual hydrologic models, known to have<br />
response surfaces (relations between output errors and parameter values) dotted with<br />
numerous local optima. This strategy, dubbed the shuffled complex evolution method,<br />
was subjected to a test in which values of 13 parameters of the Sacramento soil moisture<br />
accounting model were optimized. Although the tests were limited, the new method<br />
consistently outperformed the well-known multistart simplex method, raising hopes that<br />
the day may be approaching when a hydrologist will be able to entrust the tedious task of<br />
parameter estimation to an automatic algorithm.<br />
Rango and Martinec (1994) reported on a comparative test of seven hydrologic<br />
models conducted by the World Meteorological Organization. The test, which included<br />
flood events, provided an assessment of potential accuracy of daily snowmelt runoff<br />
forecasts for lead times of up to 20 days. Barrett (1993) described an application of<br />
NOAA's knowledge and technology to the development of a hydro-meteorological<br />
forecast system for the Nile River in Egypt. The system will provide daily forecasts of<br />
inflow to the High Aswan Dam and hydrographs at selected gauges upstream.<br />
Quantitative Precipitation Forecasts<br />
Flood forecast based solely on rainfall observed up to the forecast time carries<br />
with it an implicit prediction of no more rain, and such a prediction is the worst possible<br />
in the course of a severe storm. Yet a wider acceptance of the Quantitative Precipitation<br />
Forecast (QPF) as an input into a hydrologic model has been slow. Vis-a-vis the history<br />
of developments, recounted by Zevin (1994), the progress in the last four decades appears<br />
phenomenal. A number of NWS offices now routinely prepare QPFs for the purpose of<br />
river forecasting. New methodologies for producing QPFs are being developed.<br />
Techniques for preparing QPFs are being taught to hydro-meteorological forecasters as<br />
part of the NWS modernization program (Stewart et al., 1993). Case studies of recent<br />
flooding have documented the enormous utility of QPF-based river forecasts for flood<br />
warning decisions (Hughes, 1993), reservoir control (Eiben and Philips, 1993), and<br />
commercial navigation (Eiben and Yess, 1993). This review concentrates on<br />
methodological aspects of producing QPFs operationally for the purpose of forecasting<br />
floods on mainstream rivers.<br />
67
Technical report of project (GT/1010-00-04)<br />
a. QPF for river basins<br />
For hydrologic purposes, QPFs are prepared by local NWS offices based on<br />
guidance products from NMC and TDL and other information. Forecasts are made<br />
routinely once a day and more frequently during flood situations. In general, there are<br />
two approaches.<br />
In the service area of the Northwest River Forecast Center in Portland, Oregon,<br />
which has been using QPFs since the 1970s, the forecast is for a station and three days. It<br />
specifies estimates of precipitation amounts for eight 6-hourly sub-periods, during days<br />
one and two, and one 24-hourly sub-period, day three. Forecasts for 10 stations are then<br />
processed in the same manner as actual rain gauge observations to obtain forecasts of<br />
basin average precipitation amounts that are input to a stream flow model. Because of the<br />
strong orographic effects of the Cascade Mountains, temperatures are forecast as well to<br />
predict freezing levels that separate rainfall from snowfall and to estimate snowmelt<br />
runoff (Hughes, 1993).<br />
In the service area of the Ohio River Forecast Center in Wilmington, Ohio, which<br />
has been using QPFs since the late 1980s, the forecast is for an area and one day. It<br />
provides graphical estimates of isohyets of the precipitation fields for four 6-hourly subperiods.<br />
By integrating the fields over basins, estimates of basin average precipitation<br />
amounts are obtained. Temperature forecasts are used to classify the precipitation as rain<br />
or snow (Eiben and Yess, 1993).<br />
b. Probabilistic QPF for river basins<br />
The probabilistic approach (Murphy, 1991) is developed to forecast precipitation,<br />
which is the major source of uncertainty in flood forecasts. And because precipitation<br />
amount is one of the most difficult meteorological predictands, the uncertainty associated<br />
with any single estimate is high and varies from occasion to occasion. To allow the<br />
forecaster to convey the degree of uncertainty, to aid the predictor in coupling principles<br />
of weather forecasting with principles of probabilistic reasoning which leads to the<br />
quantification of uncertainty, to formulate a scheme for judgmental processing of<br />
information from multiple sources, and to automate all algorithmic processing tasks are<br />
the objectives of a new methodology (Krzysztofowicz et al., 1993).<br />
5.2.4 Flood Warning Systems<br />
Areas affected by flooding are typically large. Many different types of flooding<br />
occur, each with different requirements for satellite imagery. Two general categories are:<br />
river floods, which can be seasonal and are related to big rivers, or flash floods in smaller<br />
catchments; and second, coastal floods, frequently related to tropical cyclones or to high<br />
tides. Many factors play a role in the occurrence of flooding, such as the intensity and<br />
duration of rainfall, snow melt, deforestation, poor farming techniques, sedimentation in<br />
riverbeds, and natural or man-made obstructions. In the evaluation of flood hazards, the<br />
following parameters should be taken into account: depth of water during a flood,<br />
duration of the flood, the flow velocity, the rate of rise and decline, and the frequency of<br />
occurrence. In prevention exercises, SPOT stereo-pair images and ERS radar images can<br />
be used to generate digital terrain models for the simulation of potentially disastrous<br />
68
Technical report of project (GT/1010-00-04)<br />
conditions and the identification of vulnerable areas. During and after the event, mapping<br />
of sequential inundation phases is possible, including the duration, depth of inundation,<br />
affected areas and direction of current. This can be done with automated classification<br />
from optical and radar satellite imagery. However, the most crucial data are derived from<br />
the calculation of the peak discharges and return periods, using supplemental data from<br />
gauging stations. It has been demonstrated that using satellite data for flood mapping<br />
becomes economically advantageous with respect to ground survey for areas larger than a<br />
couple of sq. km. However, a disadvantage in this domain is the long revisiting time of<br />
current high resolution satellites, which sometimes cannot allow the spacecraft to observe<br />
an event occurring between two successive passes.<br />
For the prediction of floods, promising results have recently been reported on the<br />
use of NOAA images combined with meteorological satellites and radar data in the<br />
calculation of rainfall over large areas. For the monitoring of floods in large catchments,<br />
such as in Bangladesh, NOAA images have been successfully applied.<br />
Fig. 5.2-2 (a) National Weather Service Offices and Forecast Centers (Source: NOAA, 2001)<br />
5.2.5 NOAA<br />
NWS offices and Forecast Centers in the U.S. are located at numerous places<br />
shown in Fig. 5.2-2 (a and b). NOAA and NWS provide the following information:<br />
• Information on flooding (when necessary) and routine hydrologic conditions<br />
issued by NWS Forecast Offices<br />
• Information about river stages and forecasts at locations along rivers<br />
• Information on drought conditions throughout the country<br />
• Information on soil moisture: indexes, observations and model estimates and<br />
forecasts<br />
• In situ and remotely sensed observations of snow<br />
69
Technical report of project (GT/1010-00-04)<br />
• Information on water supply conditions, focusing on inflow forecasts for<br />
reservoirs<br />
• Outlooks that provide insight into future hydrologic conditions, in particular<br />
precipitation<br />
Fig. 5.2-2(b) National Weather Service Offices and Forecast Centers (Source: NOAA, 2001)<br />
In the U.S., Doppler Radar Systems are located at numerous places, providing<br />
information about thunderstorms and rainfall. Such data are used to predict flash floods.<br />
Using Doppler radar data, radar mosaic is created twice per hour, from observations<br />
taken at WSR-88D sites around 00:15 and 00:45. The mosaic is composed of the highest<br />
observed reflectivity category within map grid boxes approximately 10 km (~5 nautical<br />
miles) on a side. It is designed to give an overall picture of the position, movement, and<br />
evolution of precipitation on a synoptic scale. The National Weather Service also<br />
distributes this mosaic in digital GRIdded Binary (GRIB) format under WMO message<br />
header HAXA00 KWBC. The reflectivity categories indicate the density of precipitation<br />
backscatterers (raindrops, snowflakes, hailstones, or ice pellets) within the lowest 10,000<br />
feet of the atmosphere. Reflectivity and approximate surface rainfall rates for each<br />
category are shown in Fig. 5.2-3.<br />
70
Technical report of project (GT/1010-00-04)<br />
Level dBZ Rain Rate (in/hr)<br />
0 >4<br />
Fig. 5.2-3 Reflectivity and approximate surface rainfall rates for each category (Source:<br />
NOAA, 2001)<br />
The rain rates are approximations that hold only as long-term averages. Also,<br />
there is presently no reliable way to interpret reflectivity in terms of snowfall rate in coldweather<br />
conditions. However, in any region in any given situation, higher reflectivity<br />
generally indicates a higher rate of precipitation at the surface. Gray areas on the graphic<br />
are those that are more than 230 km (approximately 120 nautical miles) from the nearest<br />
reporting radar, or which are shadowed by terrain features from any reporting radar.<br />
Though the WSR-88D detects reflectivity at much higher spatial and temporal resolution<br />
and with greater precision than that appearing in the Radar Coded Message, the reduced<br />
data format was chosen due to communications limitations present during the early part<br />
of the radar network's life cycle, in the late 1980s and early 1990s.<br />
Creation of the mosaic<br />
Individual radars transmit Radar Coded Messages (RCMs) twice per hour. The<br />
RCMs contain a coded text summary of reflectivity features in the local area, along with<br />
information on convective storms and the vertical wind profile near the radar. The<br />
reflectivity data have already been navigated to a fixed national map grid. The individual<br />
RCMs are integrated into one map grid at NWS headquarters. For grid boxes in which<br />
reflectivity is detected by more than one radar, the highest reported value is put into the<br />
final product and it is used for the forecast of weather condition and prediction of rainfall<br />
(Fig. 5.2-4).<br />
71
Technical report of project (GT/1010-00-04)<br />
Fig. 5.2-4 Radar reflectivity from radar coded messages meteorological development<br />
laboratory national weather service (Source: NOAA)<br />
5.3 Flood Warning Services of Bureau of Meteorology (Australia)<br />
The flooding of rivers following heavy rainfall is the most common form of<br />
flooding in Australia. Very high tides are another cause of flooding in coastal areas.<br />
Flooding of rivers in inland areas of central and western New South Wales and<br />
Queensland, as well as parts of Western Australia, can spread for thousands of square<br />
kilometers and may last for weeks or even months. In hilly or mountainous areas of these<br />
inland rivers, as well as in rivers draining to the coast, flooding can occur more quickly.<br />
These rivers are steeper, and flooding often lasts for only one to two days. Flash flooding<br />
usually results from relatively short intense bursts of rainfall, commonly from<br />
thunderstorms. This flooding can occur in most parts of Australia, but is a particularly<br />
serious problem in urban areas where drainage systems may not be able to cope, and in<br />
very small creeks and streams. Flash floods tend to be quite local and it is difficult to<br />
provide effective warning because of their rapid onset.<br />
The primary function of the Flood Warning Service Program is the provision of<br />
an effective flood forecasting and warning service in each Australian State/Territory. This<br />
service is provided in cooperation with other government agencies such as State/Territory<br />
emergency management agencies, water authorities and local councils, coordinated<br />
through Flood Warning Consultative Committees and established cooperative working<br />
arrangements in each State/Territory. Efforts are made in Australia for national flood<br />
warnings and to provide river information on the basis of rainfall (Fig. 5.3-1). The<br />
Bureau of Meteorology provides a flood warning service for most major rivers in<br />
Australia. This service is provided with the cooperation of other government authorities,<br />
72
Technical report of project (GT/1010-00-04)<br />
such as the State Emergency Service (S/TES) in each State/Territory, water agencies and<br />
local councils. The Bureau delivers this service through Flood Warning Centers and<br />
Regional Forecasting Centers in Bureau Regional Offices in each State and the Northern<br />
Territory.<br />
Fig. 5.3-1 Twenty-four hour rainfalls in Australia (Source: FWSBM, 2001)<br />
The Flood Warning Service provides different types of information that depends<br />
on the type of flooding and the flood risk. The range of information, which may vary<br />
between states and areas within a state, includes:<br />
An Alert, Watch or Advice of possible flooding, if flood-producing rain is<br />
expected to happen in the near future. The general weather forecasts can also refer to<br />
flood producing rain.<br />
A Generalized Flood Warning that flooding is occurring or is expected to occur<br />
in a particular region. No information on the severity of flooding or the particular<br />
location of the flooding is provided. These types of warnings are issued for areas where<br />
no specialized warnings systems have been installed. As part of its Severe Weather<br />
Warning Service, the Bureau also provides warnings for severe storm situations that may<br />
cause flash flooding. In some areas, the Bureau is working with local councils to install<br />
systems to provide improved warnings for flash flood situations.<br />
Warnings of 'Minor', 'Moderate' or ‘major’ flood in areas where the Bureau<br />
has installed specialized warning systems. In these areas, the flood-warning message will<br />
identify the river valley, the locations expected to be flooded, the likely severity of the<br />
flooding and when it is likely to occur.<br />
73
Technical report of project (GT/1010-00-04)<br />
Predictions of the expected height of a river at a town or other important<br />
locations along a river, and the time this height is expected to be reached. This type of<br />
warning is normally the most useful in that it allows local emergency authorities and<br />
people in the flood threatened area to more precisely determine the area and likely depth<br />
of the flooding. This type of warning can only be provided where there are specialized<br />
flood warning systems and where flood-forecasting models have been developed.<br />
In order to get the most benefit from flood warnings, people in flood prone areas<br />
will need to know what, if any, effect the flood will have on their property and some<br />
knowledge of how best to deal with a flood situation. Sources of such information could<br />
include:<br />
• Flood Bulletins/Warnings issued by the Bureau and/or the local council or<br />
emergency services which often contain details of areas affected by flooding, road<br />
closures and other advice on what the community should do if they are likely to<br />
be flooded<br />
• Long term residents who may have experienced a similar flood in the past and<br />
remember how it affected them<br />
• Local councils which have conducted flood studies and have maps of areas that<br />
are likely to be flooded by a range of floods<br />
• Information pamphlets - see Further Information section below.<br />
Flood warnings typically include a statement about both current and expected<br />
levels of flooding at key locations in the area covered by the warning, along with a<br />
weather forecast and the latest available observations of river height and rainfalls in the<br />
area. In the interpretation of warning messages, it is important to note that the predicted<br />
height is a river level above a certain datum, and not a depth of floodwater. The Bureau<br />
role is to provide flood warnings, some of which contain forecasts of expected river<br />
heights. Other agencies (local councils, S/TES, etc.) are responsible for interpreting river<br />
levels into depths and areas of inundation. People living in flood prone areas should<br />
consult with these agencies to find out what level of warning service is operated for their<br />
area. In each state, flood warnings and river height bulletins are available via some or all<br />
of the following:<br />
Local Response Organizations: These include the council, police, and State<br />
Emergency Service in the local area.<br />
Bureau of Meteorology: Flood warnings and general information are available<br />
directly from the Bureau in each state.<br />
Radio: Radio stations, particularly local ABC and local commercial stations<br />
broadcast warnings (and bulletins) soon after issue.<br />
Telephone Recorded Information Services: Flood warnings are available in<br />
some states on a Bureau of Meteorology recorded message service. Charges apply.<br />
Internet/World Wide Web Access: The Bureau home page is<br />
http://www.bom.gov.au/<br />
Weather by Fax: Flood warnings and river height bulletins are available through<br />
INFORMATEL, a facsimile information retrieval system, along with a wide range of<br />
other weather and climate information. Charges apply.<br />
74
Technical report of project (GT/1010-00-04)<br />
Probable Maximum Precipitation (PMP) Estimates can be produced for any<br />
catchments in Australia. There are 3 Generalized Methods used to estimate PMP,<br />
appropriate for different locations and durations:<br />
• Generalized Short-Duration Method (GSDM);<br />
• Generalized Tropical Storm Method (GTSM); and<br />
• Generalized Southeast Australia Method (GSAM).<br />
Probable Maximum Precipitation (PMP) is defined by the Manual for<br />
Estimation of Probable Maximum Precipitation (WMO, 1986) as the greatest depth of<br />
precipitation for a given duration meteorologically possible for a given size storm area at<br />
a particular location at a particular time of the year, with no allowance made for longterm<br />
climatic trends. A PMP report provides the PMP depth, averaged over the<br />
catchments, as a function of duration, from 1 hour to a maximum of 4 days depending on<br />
the location; the spatial distribution of the rainfall over the catchments; and the temporal<br />
distribution of the rainfall during the period of the PMP storm. Hydrologists use a PMP<br />
magnitude, plus its spatial and temporal distributions, to calculate the Probable Maximum<br />
Flood (PMF) for the catchments of a dam. The PMF is used to design the dam.<br />
Generalized Methods of estimating PMP use data from all available storms over<br />
a large region and include adjustments for moisture availability and differing topographic<br />
effects on rainfall depth. Smoothing over a range of areas and durations envelops the<br />
adjusted storm data. Generalized methods also provide design spatial and temporal<br />
patterns of PMP for the catchments.<br />
Fig. 5.3-2 Generalized Short-Duration Method of estimating PMP (Source: FWSBM, 2001)<br />
a. The Generalized Short-Duration Method is appropriate for durations up to 6<br />
hours, suitable for small catchments such as those of reservoirs and tailings dams<br />
75
Technical report of project (GT/1010-00-04)<br />
anywhere in Australia. GSDM PMP estimates may be obtained by following the<br />
procedures in Bulletin (Fig. 5.3-2,3).<br />
Fig. 5.3-3 Generalized Tropical Storm Method for estimating PMP (Source: FWSBM, 2001)<br />
b. The Generalized Tropical Storm Method (GTSM) is applicable to those parts of<br />
Australia affected by tropical storms. The method was developed during the mid-1970s<br />
and finalized in 1985. The final boundary for application of the method was determined<br />
in 1987. The area to which the method can be applied is divided into two regions: the<br />
East Coast Tropical Zone (ECTZ), where a persistent low pressure trough can enhance<br />
and prolong rainfall from tropical cyclones and other tropical low pressure systems, and<br />
the Remaining Tropical Zone (RTZ). The GSTM is appropriate for durations of 6 to 72<br />
hours (96 hours in the ECTZ).<br />
The Generalized Southeast Australia Method (GSAM) was developed for<br />
estimating PMP in those regions of Australia where tropical storms are not the source of<br />
the greatest depths of rainfall, and where topographic influences vary markedly.<br />
Development commenced in 1985 and was completed in 1992. Daily rainfall analysis is<br />
made for each station.<br />
5.4 Atmospheric and Hydrological Model for Flood Forecasting<br />
(Canadian model)<br />
Combining weather forecasts with information on watershed conditions and a<br />
hydrological stream flow forecasting model can give advanced warning of potential<br />
flooding. Coupling to a well-calibrated high-resolution model not only offers a valid<br />
substitute for precipitation data, but more importantly it provides a means to compute<br />
forecast river flows. The optimal coupling of a high-resolution regional atmospheric<br />
model with a hydrological model (WATFLOOD) for flood forecasting has been<br />
76
Technical report of project (GT/1010-00-04)<br />
developed by the Canadian scientists. A conceptual framework for model development<br />
was initiated using different degrees of model coupling to obtain a complete two-way<br />
coupled model. The first level of coupling is referred to as model linking and requires<br />
calibration and validation of the high-resolution regional atmospheric model and the<br />
distributed hydrological model separately. This form of coupling was used to simulate<br />
precipitation from the atmospheric model to drive the hydrological model to study flash<br />
flood events. Under this modeling scenario, the two models use their own inherent land<br />
surface scheme and parameterizations. The hydrologic model forcing is derived directly<br />
from the atmospheric forecasts with the dominant input being precipitation. This is of<br />
great interest as precipitation is the single most uncertain variable for such hydrological<br />
studies.<br />
For the next two coupling levels, implementing a common land surface scheme in<br />
each model and re-calibrating the models separately first establish the link between the<br />
models. This phase of the model development includes level-I coupling (atmospheric and<br />
land surface) and level-II coupling (land surface and hydrologic). The final stage of<br />
coupling is the complete two-way coupled system using the common land-surface<br />
scheme and the parameter identification established during the level-I and II coupling.<br />
The detail of the forecast model (WATFLOOD) developed by the Canadian scientists is<br />
discussed in the forthcoming section.<br />
5.4.1 WATFLOOD<br />
WATFLOOD is a physically based simulation model of the hydrologic budget of<br />
a watershed that represents only a small part of the overall physical processes occurring<br />
in nature. The model is aimed at flood forecasting and long-term hydrologic simulation<br />
using distributed precipitation data from radar or numerical weather models. The<br />
processes modeled include interception, infiltration, evaporation, snow accumulation and<br />
ablation, interflow, recharge, base flow, and overland and channel routing (Kouwen et al.,<br />
1993).<br />
The model is programmed in FORTRAN 95 with dynamic memory allocation to<br />
make it suitable for use on any modern computing platform. Typically, the program takes<br />
approximately 1 minute to run for a 50,000 km 2 watershed with a 10 km grid, 1-year<br />
simulation, and hourly time steps on a 800 Mhz Pentium III.<br />
The following sections describe the model and the input requirements. In addition<br />
to SPL9, there are a number of support programs to provide for data preparation and<br />
output presentation. The programs RADMET and RAGMET may be used to convert<br />
radar and rain gauge data to the square grid SPL9 input format; BSN may be used to<br />
assemble and create a 'basin file' for SPL9; and PLOTHYD is a program to plot<br />
hydrographs on a color monitor. The WATFLOOD menu program can be used to manage<br />
the data and organize the use of the model.<br />
The model features the Hooke and Jeeves (1961) automatic pattern search<br />
optimization algorithm taken from Monro (1971). The program can be run to<br />
automatically determine which combination of parameters best fit measured conditions.<br />
The parameters for optimization are soil permeability, overland flow roughness, channel<br />
roughness, depression storage, and an upper zone depletion factor.<br />
Approach<br />
77
Technical report of project (GT/1010-00-04)<br />
A simple example is shown to demonstrate why weighted averages for the<br />
parameters that define the runoff characteristics of a watershed should not be considered.<br />
Visualize a one-hectare city block and divide it into two parts, with two-thirds of the area<br />
grassed and the remaining one-third impervious. If the U.S. Soil Conservation Service<br />
method is used to determine runoff, and the soil curve number for the grass is taken as<br />
50, the weighted SCS number will be 67 and runoff will not commence until<br />
approximately 25 mm of rain have fallen (USDA, 1968). However, the impervious area<br />
will contribute runoff almost as soon as the precipitation starts. Using the same scenario,<br />
if the rational method is applied to the same area, a peak flow calculated using only the<br />
impervious area will be larger than using the whole area.<br />
These inconsistencies have been known for a long time and led to the<br />
development of hydrological models, which did not require the averaging of the<br />
watershed parameters. The first of these, where runoff was computed separately, was<br />
using the Road Research Laboratory Method (Terstriep and Stall, 1996) followed by<br />
many others. The general trend has been to model areas of uniform hydrologic response<br />
such as the method developed by Leavesly and Stannard (1995) based on the Hydrologic<br />
Response Unit (HRU) method. During the last 15 to 20 years, “pixel models” have been<br />
developed where the hydrology is modeled at the scale of the pixel of LANDSAT or<br />
SPOT imagery or the resolution of the digital terrain data as for the TOPMODEL (Beven<br />
et al., 1995) or the MIKE SHE model (Refsgaard and Storm, 1995). However, the<br />
problem is where to make the cutoff for the smallest area that can be modeled. Often the<br />
determining factors are the image resolution and/or the computer resources available.<br />
This appears to be a rather arbitrary criterion, not based on hydrological considerations.<br />
The WATFLOOD method is based first on a definition of the resolution of the<br />
meteorological data available and second, on the level of detail required in the output, for<br />
instance, the size of the smallest watershed for which information is sought. Once these<br />
general parameters are established, a model grid is chosen to reflect these points. On very<br />
large watersheds on the sub-continental scale, where a numerical weather model with a<br />
resolution of 25 km may provide the meteorological data, a 25 km grid size will be<br />
appropriate. On the other hand, for a small 100 km 2 watershed, where the precipitation<br />
may be provided by radar at a 1 km resolution, a 1 km grid would be more appropriate.<br />
Any land cover image will reveal differences between neighboring pixels. Unless<br />
a model grid size is chosen that is equal to the land cover pixel size, either the hydrologic<br />
parameters will have to be averaged or different hydrological units will have to be<br />
grouped. The WATFLOOD system is based on the latter. Using remotely sensed land<br />
cover data, pixels are classified to a number of land cover classes and the ratio of each<br />
land cover in each computation grid is determined. The runoff response from each<br />
hydrologically significant sub-group in each grid is calculated and routed downstream.<br />
With this method, there is no requirement for grids or sub-basins to be hydrologically<br />
homogeneous. So, the grid size can be chosen to conveniently match the resolution of the<br />
meteorological data or reflect the detail required in the model output.<br />
Fig. 5.4-1 shows the above concept. In this example, a land cover image is<br />
classified into 4 hydrologically significant groups A, B, C and D. There are 25 pixels<br />
with 8 in group A, 11 in group B, 2 in group C, and the remaining 4 in group D (i.e., 32%<br />
in group A, 44% in group B, 8% in group C and 16% in group D). WATFLOOD<br />
combines all pixels in one group for computational purposes. The pixels of one group do<br />
78
Technical report of project (GT/1010-00-04)<br />
not have to be contiguous and their location in the grid is not considered significant with<br />
respect to routing. The runoff from a grouped set of pixels is routed by a two steps<br />
procedure, first overland flow to the channel system and second, channel flow to the next<br />
grid.<br />
Fig. 5.4-1 Group response unit and runoff routing concept (Donald, 1992)<br />
B<br />
C<br />
C<br />
B<br />
D<br />
D<br />
A<br />
A<br />
B<br />
B<br />
B<br />
C<br />
C<br />
C<br />
A<br />
D<br />
A<br />
D<br />
D<br />
A<br />
A - Land cover class 1<br />
B - Land cover class 2<br />
C - Land cover class 3<br />
D - Land cover class 4<br />
Fig. 5.4-2 Schematic of the GRU pixel grouping model and channel routing scheme<br />
B<br />
C<br />
A<br />
D<br />
79
Technical report of project (GT/1010-00-04)<br />
For the grid in Fig. 5.4-1, there are four hourly runoff computations and four<br />
overland flow routing segments. The flows are then combined for the grid. If there are<br />
four sub-watersheds in this grid in a pie-shaped configuration, each segment contributes<br />
runoff according to its percent coverage. The four-runoff amounts are added in each grid<br />
and routed downstream from grid to grid.<br />
Fig. 5.4-2 shows an array of grids where each grid may have a different makeup<br />
of land cover fractions. The essential property of this arrangement is that the parameters<br />
are associated with the land cover classes A, B, C and D. All grids in this method have<br />
the same hydrological parameters, even though the land cover makeup of each grid is not<br />
the same. The advantages of this scheme are: 1) the parameters can be used in other<br />
physiographically similar watersheds without recalibration, and 2) the parameters do not<br />
have to be recalibrated if land use in the watershed changes over time. For the latter, only<br />
the land cover map and the fractions in each grid need to be redefined.<br />
5.4.2 Quantitative Precipitation Estimation for Streamflow Modeling in Ontario,<br />
Canada<br />
Recently, efforts have been made to use various hydrological parameters derived<br />
from remote sensing data for hydrological practice. Use of observed precipitation through<br />
Doppler radar and their use in hydrological modeling are presently underway. The use of<br />
such tools may lead to improved accuracy in the estimation and short term forecasting of<br />
stream flow conditions. Such potential improvements could also lead to an expansion of<br />
the capacity of information systems in hydrology and could have implications in the<br />
future design of ground-based hydrological networks. Within this effort, precipitation<br />
fields are estimated using a portion of Environment Canada’s Doppler weather radar<br />
network.<br />
Environment Canada is midway through a project to upgrade its network of Cband<br />
Doppler weather radars. Fifteen radars have been installed or upgraded and by<br />
2004, a complete network of thirty radars will provide coverage for approximately<br />
ninety-five percent of the population of Canada. The main focus of these systems is to<br />
improve the forecasting of severe weather. Suites of radar products are being developed<br />
and various efforts are underway to increase their utility in estimating rainfall intensity<br />
and its areal distribution. Use of C-band radar poses unique problems that require novel<br />
approaches to obtain accurate precipitation fields. Evolving capabilities and approaches<br />
represented within the Unified Radar Processing System are used with a distributed<br />
hydrological model to evaluate performance.<br />
Estimated flow values from a distributed hydrological model, WATFLOOD, set<br />
up over selected pilot basins, are compared to estimated flows from hydrometric gauges<br />
representing drainage areas ranging from 100 to 3500 km 2 . WATFLOOD is a grid-based<br />
model developed by the University of Waterloo, Ontario. The model characterizes<br />
watersheds by using high resolution LANDSAT images to identify various<br />
hydrologically similar land types which are subsequently grouped within each<br />
hydrological model grid cell to create grouped response units (GRUs).<br />
In one watershed equidistant two C-band Doppler radars are kept for measuring<br />
precipitation. In the pilot study, 100-day periods during summer several intense rainfall<br />
events are measured. The measurements provide an opportunity to quantify the effects of<br />
80
Technical report of project (GT/1010-00-04)<br />
radar beam attenuation and other artifacts on estimating precipitation fields through the<br />
use of a distributed hydrological model.<br />
Hydrological model output from both conventional and Doppler radar products<br />
are compared against gauged flows on unregulated headwater basins to provide a means<br />
of examining quantitative precipitation estimates on an areal basis that complements<br />
point observations. Several assumptions and alternatives regarding the generation of<br />
gridded QPE fields using radar and integrated data sets are investigated. A comparison of<br />
hydrological model performance to observed flow is shown for various<br />
radar/precipitation interpolation techniques. These experiments help to explore and<br />
quantify model sensitivity and performance under various hydrological grid cell<br />
resolutions and radar products.<br />
5.5 Wide Area Flood Risk Monitoring Model<br />
Arten et al. (2001) developed a Stream Flow Model for wide area flood risk<br />
monitoring tool. It is used to monitor stream locations with extreme flows caused by<br />
prolonged regional rainfall pattern. The model concept involves parameters such as:<br />
Evaporation, Transpiration, Precipitation, Surface runoff, Interflow, Flow, Percolation<br />
and Loss to ground water. These parameters involve input for flow direction, flow<br />
accumulation, flow length, terrain slope, hill length, soil and land cover characteristics,<br />
and rainfall estimates. All the parameters are important as input for the flood forecast.<br />
Among all the parameters, the rainfall estimation at various locations along the river and<br />
its tributaries is important.<br />
5.6 MIKE-11 Flood Forecast System (Danish)<br />
MIKE-11, developed by the Danish Hydrologic Institute, is a professional<br />
engineering module based on a real-time flood forecasting system for the simulation of<br />
flows, water quality, and sediment transport in rivers, channels, irrigation systems, and<br />
other water bodies. As a dynamic, menu-driven modeling tool for the detailed design,<br />
management, and operations of simple and complex river and channel systems, MIKE-11<br />
output products include:<br />
• Real-time management system with direct access databases and user-designed<br />
data entry menus<br />
• Calculations of mean real rainfall from point rainfall in sub-catchments<br />
• Calculations of discharge from water level data and rating curves<br />
• Hydrodynamic modules for routing river slows and predicting water levels and<br />
inflows to reservoirs<br />
• Automatic updating procedures for minimizing differences between observed and<br />
simulated flow/water levels at time of forecast<br />
• Specification of quantitative precipitation forecasts and predictions of boundary<br />
inflow in the forecast period<br />
5.7 European Flood Forecasting System<br />
The European Flood Forecasting System (EFFS) project contributes to the<br />
Energy, Environment and Sustainable Development Programme for Research,<br />
81
Technical report of project (GT/1010-00-04)<br />
Technology development and Demonstration (RTD) under the fifth Framework<br />
Programme of the European Commission. More precisely, it forms a contribution to<br />
Research and Technology Development Activities of a Generic Nature, Fight against<br />
Major Natural Hazards with RTD priority Floods and Hydrogeological risks.<br />
The EFFS project aims at developing a prototype of a European flood forecasting<br />
system 4-10 days in advance. This system provides daily information on potential floods<br />
for large rivers such as the rivers Rhine and Oder as well as flash floods in small basins.<br />
This flood forecasting system can be used as a pre-warning system to water authorities<br />
that already have a 0-3 day forecasting system. The system can also provide flood<br />
warnings for catchments that at present do not have a forecasting system (Eastern-<br />
European countries). The framework of the system will allow incorporation of both<br />
detailed models for specific basins as well as a broad scale model for entire Europe. Once<br />
designed, the prototype will be tested and evaluated for several months. Together with<br />
end-users, channels to disseminate the forecasts and their uncertainties will be developed.<br />
The main objectives of the project are:<br />
• To take advantage of currently available Medium-Range Weather Forecasts (4 -<br />
10 days) to produce reliable flood warnings beyond the current flood-warning<br />
period of approximately 3 days.<br />
• To design a Medium-Range Flood Forecasting System for Europe that will<br />
produce flood warnings on the basis of the Medium Range Weather Forecasts.<br />
• To produce flood forecasts in regions where at present no flood forecasts are<br />
made on the basis of the newly developed system.<br />
5.7.1 Prediction and Mitigation of Flash Floods<br />
Although structural measures of protection (e.g., flood control reservoirs) can<br />
provide some protection from flooding from larger streams with longer flood lead times,<br />
it is too costly to use flood control structures on the large number of small streams<br />
flowing through populated areas. Moreover, it is difficult and costly to construct and then<br />
continuously monitor the safety of all structures that could mitigate flash flood disasters.<br />
Therefore, it is vitally important to reduce the population living in floodplains by<br />
providing disincentives to encroachment. This is one of the goals of the national flood<br />
insurance program of the Federal Emergency Management Agency (FEMA) of the U.S.<br />
Nevertheless, since too many people still dwell along small streams that can<br />
easily flood, community warning systems and self-help programs provide the only<br />
practical safeguard for many small flood plain communities.<br />
5.7.2 Warning systems and new technologies<br />
Essential components of flash flood warning systems include the following:<br />
• Preparedness programs that include local citizen involvement.<br />
• Rainfall-observing systems.<br />
• Electronic data communication systems.<br />
• Diagnostic/predictive models.<br />
• Model calibration procedures.<br />
• Warning dissemination systems.<br />
82
Technical report of project (GT/1010-00-04)<br />
• Action plans for local civil authorities.<br />
In fact, many of the accomplishments in forecasting and improved warnings for<br />
flash flooding have come from the application and utilization of a number of these<br />
program components. For example, the NWS lead time for flash flood forecasts has<br />
increased to over 50 minutes. Much of this improvement is directly tied to new<br />
technology and also training along with the introduction of hydrometeorologists in the<br />
Weather Forecast Offices. Deployment of new weather surveillance radars nationwide<br />
has significantly improved the capability to continuously monitor intense localized<br />
rainfall.<br />
Furthermore, upgrading the new radar network to include polarimetric capabilities<br />
may offer substantial potential for significant additional improvements in rainfall<br />
measurements. The new radar technology, when combined with satellite and advanced<br />
automated surface rainfall and stream flow technologies, enhances the prospects for<br />
detecting and quantifying intense rainfall and rapid rises in stream flow. Still further, the<br />
databases created by the new observing capabilities facilitate better studies of the<br />
physical character of such rainfall events. This is especially true for understanding flash<br />
flood dynamics and microphysical processes, knowledge that is vital for the development<br />
of improved radar rainfall estimates. For example, improved understanding of radar<br />
underestimation of "warm-process" rain will ultimately lead to further improvements in<br />
diagnostic and forecast models. Because both remotely sensed and on-site recorded data<br />
are necessary for the production of high-resolution (to a few square kilometers) optimal<br />
estimates of rainfall, deployment and maintenance of rain gauge networks will still be<br />
important components of hydrologic research and development. A major challenge for<br />
remote sensing systems is enhancement of rainfall estimation capabilities in complex<br />
terrain.<br />
5.7.3 Integrated hydro-meteorological approaches<br />
The coupled meteorological–hydrological nature of flash floods is becoming more<br />
and more evident. Prediction of flooding events will require interactive meteorological<br />
and hydrological models that introduce new weather radar data and include feedbacks<br />
from the near-surface soil water to the atmosphere. Coupled hydrological–meteorological<br />
models should be constructed in a manner that permits prediction of time and space<br />
distribution of both rainfall and resultant flooding. Efforts to predict the temporal and<br />
spatial distribution of flooding are expected to dominate research and development of<br />
diagnostic/predictive models. Considerable efforts have been expended to develop<br />
probabilistic approaches to heavy rainfall and flood forecasting. Early efforts during the<br />
late 1990s have shown dramatic improvements in warnings when forecasters are trained<br />
and fully engaged in understanding the strengths and drawbacks of utilizing probabilities<br />
to express their confidence in their rainfall forecasts. Additional work also must be done<br />
to improve automated stream gauging systems and to improve integrated rainfall–stream<br />
flow prediction systems that integrate models with observations.<br />
Important research challenges include:<br />
• Understanding the processes that govern the production of extreme rainfall<br />
rates in convective weather systems<br />
83
Technical report of project (GT/1010-00-04)<br />
• Determining why some convective systems become quasi-stationary<br />
• Defining the effects of the initial spatial distribution of soil moisture on the<br />
development of surface runoff<br />
• Developing reliable distributed hydrologic models for simulating the<br />
hydrologic response of urban areas<br />
• Linking local distributed hydrologic models to the larger-scale hydrologic<br />
models used operationally by the river forecast centers of the NWS<br />
• Establishing the fundamentals of small-catchments hydrology/hydraulics<br />
• Quantifying forecast uncertainty by providing probabilistic forecast guidance<br />
The influence of the spatial scales of soil moisture on flash flood modeling is to<br />
support basic research efforts. Data requirements for conducting the research and<br />
developing predictive models necessitates utilization of geographic information systems<br />
for specifying catchments geometrical properties pertinent to surface runoff development.<br />
Because the occurrence of flash floods depends strongly upon the local nature and<br />
dynamics of rainfall and upon the wide spectrum of spatial and temporal scales that such<br />
dynamics span, fundamental uncertainties are inherent in any attempt to forecast these<br />
events. These uncertainties make it necessary to use statistical–dynamical predictive<br />
rainfall models. They also encourage exploration of probabilistic approaches, including<br />
ensemble-forecasting techniques.<br />
Dissemination of flood warnings has improved in recent years, largely in response<br />
to the enhanced coverage and attention of the local commercial media. Public response to<br />
warning would improve if individual streams were identified in the warning messages.<br />
Also, enhanced NOAA Weather Radio coverage of flash flood-prone areas over the<br />
United States would undoubtedly contribute to smaller disaster impact. Dissemination<br />
methods involving the Internet should be explored and tested.<br />
Proactive preparedness programs remain indispensable for loss-of-life and flooddamage<br />
reduction. Continued efforts by the NWS, FEMA, the media, and state and local<br />
emergency management agencies to educate the public regarding the occurrences and<br />
destructive force of flash floods are essential. Improved community monitoring,<br />
detection, and warning programs with emphasis on individual warning responses are a<br />
must. Real-time feedback from local designated persons or authorities to the NWS offices<br />
as to the hydrological and meteorological aspects of flood development will make a more<br />
effective warning system.<br />
Present-day flash floods are severe calamities with the potential for a very high<br />
death toll and huge losses of property. Although forecasting such events remains a<br />
tremendous challenge, the availability of the new weather radar data is expected to<br />
enhance forecast reliability, at least for short forecast lead times. Nevertheless, integrated<br />
hydro-meteorological approaches based on sound science and new technological<br />
advances are necessary if more reliable and timely predictions are to become a reality.<br />
Coordinated dissemination and preparedness programs that involve individual and<br />
government initiatives will remain essential for effective flash-flood hazard mitigation.<br />
5.8 Flood warning from space in Europe<br />
River and civil protection authorities in Europe are using mathematical models of<br />
their river basins to identify the areas at risk and to assess flood defenses. Unfortunately,<br />
84
Technical report of project (GT/1010-00-04)<br />
the models currently in use are not accurate enough. Measurements are difficult to take<br />
during a flood, and model calibration must rely on historical records and aerial<br />
photographs. Two European satellites with Synthetic Aperture Radar (SAR) instruments,<br />
now orbiting the earth, can provide an all-weather capability to monitor floods from<br />
space.<br />
Fig. 5.8-1 Various Steps of LISFLOOD<br />
The Water Management Model (WAMM) project uses a European modeling tool<br />
(MIKE11) of the flood plain to predict flood extent. By including SAR data in the model,<br />
the accuracy of flood prediction and the efficiency of flood prevention are significantly<br />
enhanced. Model calibration is made by comparing its predictions with actual flood maps<br />
obtained through the analysis of SAR satellite images and water levels measured by small<br />
portable sensors installed in the flood plain.<br />
A model called LISFLOOD is under development for simulating floods in large<br />
European drainage basins. Full basin-scale simulations can be carried out, such that the<br />
influences of land use, spatial variations of soil properties and spatial precipitation<br />
differences are taken into account. LISFLOOD is a distributed rainfall-runoff model<br />
taking into account the influences of topography, precipitation amounts and intensities,<br />
85
Technical report of project (GT/1010-00-04)<br />
antecedent soil moisture content, land use type and soil type. The processes simulated are<br />
precipitation, interception, snowmelt, evapotranspiration, infiltration, percolation,<br />
groundwater flow, lateral flow and surface runoff. For surface runoff and channel<br />
routing, a GIS-based kinematic wave routing module has been developed. The user can<br />
choose both spatial and temporal resolution. For flood prevention the important key<br />
approach is sustainable management of land cover and land use in the catchments area.<br />
Geodata on catchments level are also needed for extended and more reliable flood<br />
prediction through precipitation run-off modeling.<br />
Rhine-GIS is useful for flood prediction models and early-warning-systems (Fig.<br />
5.8-1), as it is innovative in many aspects:<br />
• It covers the whole catchments area of the Rhine (about 186.000 km 2 ), with a<br />
resolution of 500 m pixel size.<br />
• The concept is spatially oriented and comprises of 36 data layers, it covers all<br />
important, constant and “near-constant” physiographic features relevant for<br />
hydrological modeling.<br />
• Satellite data and their derivatives are integrated to provide information on<br />
highly variable parameters such as vegetation.<br />
Simulated flood hydrographs at user defined catchments outlets and sub-outlets<br />
produce hydrographs for historic floods and land use scenarios. Maps are produced<br />
showing the source areas of water in the catchments, which are used for spatial planning.<br />
Maps show the maximum flood extent in the floodplain during historic floods and as a<br />
consequence of a land use change (scenario). Maps show changes in space and time of<br />
certain variables, such as water depth. For the Rhine-GIS product, data are supplied on<br />
CD-ROM in formats open to every GIS software. It provides basic data to input into a<br />
range of models. It is important to stress that the use of Earth observation data within<br />
flood models is still at a development stage. Earth observation can produce information<br />
on vegetation, landcover and elevation, but the value of this information within models is<br />
under validation.<br />
5.9 Wave Current Information System (WAVCIS)<br />
Floods are often caused in the coastal areas due to ocean current. The objective of<br />
wave-current information system (WAVCIS) is to provide wave information (sea state)<br />
including wave height, period, direction of propagation, water level, surge, near surface<br />
current speed and direction and meteorological conditions on a real time basis around the<br />
entire Louisiana coast (Fig. 5.9-1).<br />
86
Technical report of project (GT/1010-00-04)<br />
Fig. 5.9-1 A wave – current monitoring system for coastal Louisiana<br />
5.10 DECIDE Belgium Flood project (Earth Observation Technologies for<br />
Decision Support Demonstrations - The Flood Case)<br />
In Walloonia (south of Belgium), SETHY (Service d'Etudes Hydrologiques)<br />
belonging to the MET (Ministère wallon de l'Equipement et des Transports) is<br />
responsible for the maintenance and development of a system allowing the hydrological<br />
monitoring of the Walloon territory (16,844 sq. kilometers; 5 provinces: Hainaut, Brabant<br />
Wallon, Namur, Liège and Luxembourg). SETHY is the end-user of DECIDE project.<br />
For DECIDE demonstrator, the Lesse catchments was chosen. The Lesse River is a<br />
tributary of the Meuse and is located in the Belgian Ardennes. It was selected since it is a<br />
basin that has been studied for years and is therefore well known. Many tools and digital<br />
data already exist such as GIS data, remote sensing data, calibrated and validated models.<br />
The EFFS project aims at developing a prototype of a European flood forecasting<br />
system for 4-10 days in advance. This system provides daily information on potential<br />
floods for large rivers such as the rivers Rhine and Oder as well as flash floods in small<br />
basins. This flood forecasting system can be used as a pre-warning system to water<br />
authorities that already have a 0-3 day forecasting system. The system can also provide<br />
flood warnings for catchments that at present do not have a forecasting system (Eastern-<br />
87
Technical report of project (GT/1010-00-04)<br />
European countries). The framework of the system will allow incorporation of both<br />
detailed models for specific basins as well as a broad scale model for entire Europe. Once<br />
designed, the prototype will be tested and evaluated for several months. Together with<br />
end-users, channels to disseminate the forecasts and their uncertainties will be developed.<br />
Fig. 5.10-1 Walloon territory and Lesse river<br />
The main objectives of the project are:<br />
• To take advantage of currently available Medium-Range Weather Forecasts<br />
(4-10 days) to produce reliable flood warnings beyond the current floodwarning<br />
period of approximately 3 days.<br />
• To design a Medium Range Flood Forecasting System for Europe that will<br />
produce flood warnings on the basis of the Medium Range Weather Forecasts.<br />
• To produce flood forecasts in regions where at present no flood forecasts are<br />
made on the basis of the newly developed system.<br />
5.10.1 Scientific Objectives<br />
The following scientific objectives were planned:<br />
• Development and application of downscaling techniques for weather forecasts<br />
that can be used in real-time operational flood warning systems over large<br />
areas.<br />
• Design of a framework that allows for the use of different rainfall-runoff flood<br />
models linked to the Medium Range Weather Forecasts in order to provide<br />
Medium Range Flood Forecasts.<br />
• Investigate the concept of an overall water balance hydrological model as a<br />
basis for regional rainfall-runoff flood modeling.<br />
• Investigate the accuracy of the flood forecasts in space and time starting off<br />
from uncertainties in Medium Range Weather Forecasts and assess the error<br />
propagation through the system.<br />
• Find methods to incorporate uncertainties both from the weather forecasts as<br />
well as from the hydrologic models to be used in operational forecasts and use<br />
them as a decision factor as part of the actual flood forecast.<br />
88
Technical report of project (GT/1010-00-04)<br />
• Investigation and recommendations concerning methods to disseminate the<br />
forecasts to which they might concern, and to retrieve feedback from the<br />
users.<br />
National water authorities are normally able to provide flood warnings between<br />
one and four days in advance of flood events. These warnings are usually based on<br />
weather forecasts in combination with knowledge of the actual hydrologic conditions in<br />
the river basins concerned. However, the emergency civil and water management<br />
agencies would benefit from an increase in lead-time, to effectively implement their plans<br />
in downstream areas. Therefore, a need exists for improved flood forecasts to extend the<br />
flood-warning period. Improved flood forecasts should enable more effective evacuation<br />
of people from high-risk areas or the controlled release of water from reservoirs in<br />
upstream areas to create temporary retention basins to reduce flood volumes and peaks.<br />
Recent developments in the art of weather forecasts have brought these needs for<br />
improved flood forecasts within reach. Currently, Medium Range Weather Forecasts are<br />
available for periods between 4 and 10 days ahead. These forecasts, which are still hardly<br />
used for practical purposes, should be taken advantage of by investigating the<br />
improvements that can be obtained in the present knowledge that is available to decision<br />
makers in flood-risk areas. In the present project, the reasonable extension of the forecast<br />
period will be examined by an assessment of the accuracy as a function of lead-time,<br />
location and season, and the minimum requirements put forward by the end-users.<br />
5.10.2 Statistical versus deterministic methods<br />
Flood forecasts are made using two methods:<br />
Statistical methods<br />
Statistical methods combine the boundary conditions (hydrologic conditions,<br />
meteorological forecasts and discharges upstream) to forecast water levels in the coming<br />
days. Such statistical methods are excellent tools for short-term forecasts, but they are<br />
less suited for forecasts more than a couple of days ahead.<br />
Deterministic methods<br />
Alternatively, the forecast can be based on a coupled meteorological-hydrologic<br />
model. If the hydrologic model is able to take changes in the hydrologic conditions in the<br />
river basin into account, such models are able to provide discharges over longer periods<br />
ahead.<br />
The statistical method is evidently not applicable in the present project. For the<br />
deterministic method, the two main steps in the derivation of flood risks are weather<br />
forecasts and (subsequently) flood forecasts.<br />
Weather forecasts<br />
The main limitations on the weather forecast are the period for which the weather<br />
is to be forecast with accuracy. The spatial resolution of the forecast weather, mainly<br />
rainfall, is generally too coarse for use in forecast models more than a few days in<br />
advance. However, a few years’ weather models have been developed that provide on a<br />
89
Technical report of project (GT/1010-00-04)<br />
small resolution, a grid weather forecast more than four days in advance. Currently these<br />
forecasts can be provided for all of Europe. It is possible to couple these weather<br />
forecasts to hydrologic/flood routing models to allow for Medium Range Flood<br />
Forecasting.<br />
The Siren project aims at defining, specifying and testing a dedicated service to<br />
manage and supply Earth Observation based information concerning flood risk. This<br />
service is oriented towards users involved in flood management, such as Disaster<br />
Management Services, Civil Protection bodies, Regional Authorities, and Ministries of<br />
the Environment.<br />
5.11 Flood Forecasts Using SSM/I data<br />
SSM/I data is obtained by the Defense Meteorological Satellite Program of the<br />
U.S. The SSM/I is a seven-channel, four frequency, linearly-polarized, passive<br />
microwave radiometric system which measures atmospheric, ocean and terrain<br />
microwave brightness temperatures at 19.35, 22.235, 37.0 and 85.5 GHz. The data are<br />
used to obtain synoptic maps of critical atmospheric, oceanographic and selected land<br />
parameters on a global scale. The SSM/I archive data set consists of antenna temperatures<br />
recorded across a 1,400 km conical scan, satellite ephemeris, earth surface positions for<br />
each pixel and instrument calibration.<br />
Electromagnetic radiation is polarized by the ambient electric field, scattered by<br />
the atmosphere and the Earth's surface and scattered and absorbed by atmospheric water<br />
vapor, oxygen, liquid water and ice.<br />
Instrument description<br />
The SSM/I instrument consists of an offset parabolic reflector that is 24 x 26<br />
inches fed by a seven- port horn antenna. The reflector and feed are mounted on a drum<br />
that contains the radiometers, digital data subsystem, mechanical scanning subsystem and<br />
power subsystem. The drum assembly rotates about the axis of the drum. A small mirror<br />
and a hot reference absorber are mounted on the assembly.<br />
The instrument sweeps a 45 0 cone around the satellite velocity vector so that the<br />
Earth incidence angle is always 54 0 . Data are recorded during the 102.40 of the cone<br />
when the antenna beam intercepts the Earth's surface. The channel footprint varies with<br />
channel energy, position in the scan, along scan or along track direction and altitude of<br />
the satellite. The 85 GHz footprints are the smallest with a 13 x 15 km and the 19 GHz<br />
footprints is the largest at 43 x 69 km. Because the 85 GHz footprints are so small, it is<br />
sampled twice, i.e., 128 times a scan. One data cycle consists of 4 scans of 85 GHz and 2<br />
scans of the 19, 22 and 37 GHz channels. The complete cycle takes 28 seconds and it<br />
must be complete to process the data.<br />
DMSP satellites are in a sun-synchronous, low altitude polar orbit. The orbital<br />
period is 101 minutes and the nominal altitude is 830 km.<br />
Processing<br />
The SSM/I processor is queried once a second by onboard computer and the data<br />
are placed into the "TS SSP" data field. Data is ingested in simple format as sent from<br />
AFWA on a T-1 line. At NGDC, the "TS SSP" data are decommutated, deinterleaved, bit<br />
90
Technical report of project (GT/1010-00-04)<br />
flipped, reordered and restructured into orbits beginning with the equatorial crossing as<br />
the satellite travels from south to north.<br />
Satellite ephemeris is computed using a physically based, orbital mechanics<br />
model. SSM/I pixels are geolocated using the satellite ephemeris and satellite attitude<br />
corrections. Antenna temperatures are computed from instrumental counts by a linear<br />
equation, i.e., the conversion is reversible.<br />
In the decommutation step, bit reversals occurred 1.8 - 3.4% of the time, probably<br />
caused by ionospheric scintillation. These are identified through careful checking of<br />
procedures and corrected if necessary. Archive tapes contain an automated format<br />
statement, an orbital inventory, and metadata by orbit and geolocated antenna<br />
temperatures. A typical tape contains 8 days of data from two satellites.<br />
Applications<br />
SSM/I data are used to derive geophysical parameters; notably, ocean surface<br />
wind speed, area covered by ice, age of ice, ice edge, precipitation over land, cloud liquid<br />
water, integrated water vapor, precipitation over water, soil moisture, land surface<br />
temperature, snow cover and sea surface temperature.<br />
Most current methods use statistical algorithms which mean or difference channel<br />
brightness temperatures (Hollinger et al., 1989). Brightness temperatures are computed<br />
from antenna temperatures using the published antenna pattern correction that includes<br />
dynamic adjustments for antenna side lobe, antenna efficiencies and neighboring pixel<br />
contributions. Future methods will be physically based using data from all atmospheric<br />
sensors on DMSP satellites, i.e., SSM/I, OLS, SSM/T and SSM/T-2.<br />
Using SSM/I data, one can compute SWE and SWI as explained below. SWE<br />
gives information about liquid water content; from the status of snow melting, surface<br />
runoff and river levels can be monitored. Subsequently, a flood warning can be given.<br />
From a soil wetness index, information about the surface runoff and increase of river<br />
level and flooding can be obtained.<br />
Using SSM/I data, the flood forecast can be made successfully after calculating<br />
Snow Water Equivalence (SWE) and Soil Wetness Index (SWI). These parameters are<br />
calculated from the following equations:<br />
Snow Water Equivalence (SWE)<br />
SWE (mm) = Kt * (Tb19.35H - Tb37H)<br />
Kt depends on geographic location. For India, Kt = 1.<br />
Soil Wetness Index (SWI) is an index, which is unitless and can be calculated from<br />
following formula<br />
SWI = Tb85.5H - Tb19.35H<br />
Where Tb19.35H, Tb37H and Tb85.5, are brightness temperature respectively, for<br />
19.35, 37 and 85.5 GHz in horizontal polarization.<br />
91
Technical report of project (GT/1010-00-04)<br />
The Snow Water Equivalence (SWE) and Soil Wetness Index (SWI) maps over<br />
India are shown in Fig. 5-11-1 and Fig, 5-11-2. The SWE maps show the development of<br />
a sudden flood due to snow melting from the third week of September until the second<br />
week of October (blue region in the map). The SWI map shows the SWI for the months<br />
of July and August 1997 showing a likely flooded region. The likely flooded region<br />
shows the SWI in the range 28 – 50.<br />
Week 1 Week 2 Week 3 Week 4 July<br />
Week 1 Week 2 Week 3 Week 4 August<br />
Week 1 Week 2 Week 3 Week 4 September<br />
Week 1 Week 2 October<br />
Fig. 5.11-1 Weekly averaged plots of SWE over the northern part of India for 1995<br />
92
Technical report of project (GT/1010-00-04)<br />
Jul-97<br />
Aug-97<br />
93
Technical report of project (GT/1010-00-04)<br />
Fig. 5.11-2 Soil wetness index (SWI)<br />
6 Flood forecasting and warning in developing<br />
countries<br />
6.1 Flood forecasting and warning in Bangladesh<br />
In developed countries, the average accuracy of forecasts of weather conditions is<br />
80%. In developing countries, the average accuracy is very poor. The forecasts of<br />
weather should be improved in developing countries and as a result, flood forecasts will<br />
also improve. This will save lives and property in developing countries.<br />
The purpose of a forecast center is to provide accurate predictions of water levels<br />
during the monsoon season for the whole country. Data on river flows and levels together<br />
with rainfall are transmitted to a center in Dhaka, which uses a sophisticated computer<br />
model to predict water levels in the rivers, and flooded areas and depths in the<br />
floodplains. The model should be updated on the basis of regular measurements to ensure<br />
its accuracy with respect to both the depth and time of flooding. The model is linked to a<br />
GIS to relate flood information to land use, population densities, infrastructure features,<br />
etc. The system provides different categories of warnings to each administrative region<br />
and to the government so that appropriate action can be taken. The information is also<br />
publicized through media channels, enabling local populations to seek shelter for<br />
themselves and their livestock before inundation occurs. With the advent of new and<br />
modern data processing systems, rural communities will gain access to warning systems<br />
and be able to participate in planning physical and other measures to alleviate flood<br />
events.<br />
After experiencing numerous disastrous floods, the government of Bangladesh<br />
established a permanent Flood Forecasts Center in Dhaka in 1972. This center has<br />
moderate scientific personnel with a Chief Engineer, Hydrology and a Director,<br />
Processing and Flood Forecasting. This office is staffed with 22 persons. The center has<br />
received financial assistance from UNDP/WMO assistance from 1981 to 1986 and 1989<br />
to 1992, along with scientific and technical assistance from Denmark from 1995 to 1997.<br />
The efforts of this center are to issue flood and cyclone forecasts and warnings through<br />
the Internet, E-mail, fax, telephone and wireless equipment, and also through radio and<br />
television. This center has following communication facilities:<br />
• Voice data (HF Wireless network, 67 stations)<br />
• Mobile telephone (3 stations)<br />
• Telemetry System (14 stations)<br />
Satellite data is also used for flood and cyclone forecasts and warnings. This<br />
center has access to GMS, NOAA-12 & NOAA-14 satellite data and imagery and uses<br />
on-line various meteorological data (rainfall, humidity, and water vapor) from<br />
Bangladesh Meteorological Department.<br />
This center is using GIS techniques extensively to display water level and rainfall<br />
status (Flood Watch) that is being used for the forecast model. On a routine basis, this<br />
center generates water level and discharges and issues flood forecast bulletins.<br />
94
Technical report of project (GT/1010-00-04)<br />
This center uses a one-dimensional fully hydrodynamic model (MIKE 11 HD)<br />
incorporating all major rivers and floodplains that are linked to a lumped conceptual<br />
rainfall-runoff model (MIKE 11 RR), which in turn generates inflows from catchments<br />
within the country.<br />
The total catchments area is about 82,000 sq. km; the total length of all rivers is<br />
7,270 km; and the number of catchments is 216, all of which are monitored using 30<br />
forecast stations. The routine flood maps are generated using flood forecast models via<br />
GIS link to MIKE 11 GIS.<br />
The routine forecasts of floods (hydrographs) and meteorological parameters are<br />
available through a web page (http://www.ffwc.net). Fig. 6.1-1 shows the forecast<br />
stations and Fig.6.1-2 shows the hydrograph one can see through web page. The satellite<br />
images are classified in terms of the intensity of rainfall (heavy, moderate, light and no<br />
rain) and displayed through a web page (Fig. 6.1-3)<br />
Fig. 6.1-1 Shows various forecast stations (Source: FFWC. 2001)<br />
95
Technical report of project (GT/1010-00-04)<br />
Fig. 6.1-2 Typical hydrograph see through web page (Source: FFWC, 2001)<br />
Fig. 6.1-3 Shows area with expected rainfall intensity (Source: FFWC, 2001)<br />
96
Technical report of project (GT/1010-00-04)<br />
Efforts are also made by the center to display inundation maps through the<br />
website that is given below (Fig. 6.1-4).<br />
Fig. 6.1-4 Showing inundation map (Source: FFWC, 2001)<br />
The Bangladesh Space Research and Remote Sensing Organization also forecasts<br />
weather conditions and meteorological conditions of Bangladesh using various satellites<br />
data. The information about this organization can be found through the website<br />
(http://www.sparrso.org/weather.html). A close cooperation by this organization and the<br />
Flood Forecast Center is essential in the reliable forecasts of flood in Bangladesh.<br />
6.2 Flood forecasting and warning in China<br />
The South China Sea Monsoon Experiment (SCSMEX)<br />
The South China Sea Monsoon Experiment (SCSMEX) is a large-scale<br />
experiment to study the water and energy cycles of the Asian monsoon regions. The goal<br />
is to provide a better understanding of the key physical processes responsible for the<br />
onset, maintenance and variability of the monsoon over Southeast Asia and southern<br />
China, which in turn will lead to improved flood predictions.<br />
97
Technical report of project (GT/1010-00-04)<br />
The WMO/M1 Committee of Atmospheric Sciences, WCRP CLIVAR Monsoon<br />
Program and the Pacific Science Association jointly sponsor SCSMEX. It involves the<br />
participation of all major countries and regions of East and Southeast Asia, as well as<br />
Australia and the U.S. Visible images are available through Chinese Geostationary<br />
Satellite FY-II, which was launched on June 10, 1997. The strong convective activity<br />
over the South China Sea and the vicinity is noteworthy.<br />
SCSMEX consists of five components:<br />
• A pilot study component (1996-1998) - climatological data analysis, including<br />
satellite OLR, GPCP, re-analysis, pilot stations and mooring sites, planning of<br />
IOP strategies.<br />
• A field experiment phase (May 1 to July 31, 1998) - routine and enhanced four<br />
times daily upper air sounding in stations around the SCS, hourly surface<br />
observations, ATLAS buoys, dual Doppler radar observations on ship and on<br />
islands, Integrated Sounding Systems, aerosondes, PBL measurements, air-sea<br />
fluxes, ocean survey ships.<br />
• A satellite component (1996-2000) - rainfall estimates from TRMM, deep<br />
convective indices and cloud track wind, visible and IR cloud information from<br />
GMS and FY-II, surface wind from ERS-II, moisture data from SSM/I and sea<br />
surface temperature and outgoing long wave radiation AVHRR.<br />
• A data analysis component (1998-2002) - analysis and interpretation of special<br />
and routine observations obtained during the field phase.<br />
• Modeling component (1996-2002) - mesoscale model simulations, GCMs, nested<br />
mesoscale models global and regional 4-D assimilation.<br />
The SCSMEX field phase is being closely coordinated with the GEWEX Asian<br />
Monsoon Experiment (GAME). In this program, dual Doppler radar coverage is<br />
collocated with an ATLAS buoy, which measures rainfall, surface meteorology and<br />
subsurface oceanic temperature and salinity. The TRMM satellite flying over the region<br />
provides spatial rainfall coverage on a broader scale over the SCS and the adjacent areas.<br />
With such a system, the forecasts of monsoons and various meteorological parameters<br />
may improve.<br />
6.3 Flood forecasting and warning in India<br />
Flood forecasting in India was started in 1959 by the Central Water Commission<br />
on the Yamuna River. Later, the flood forecasts program was extended to all major<br />
rivers and tributaries. Now, forecasts for 145 centers in the country are issued covering<br />
various river basins. In 1980 with the assistance of UNDP, an improved River and Flood<br />
Forecasts System in India began as a pilot plan on the Yamuna River. The system was<br />
tested during the1985 monsoon season, when the data was collected automatically at<br />
different sites and transmitted to the Central Station at Delhi through VHF links. These<br />
data are processed at CWC and a forecast was issued. At present, flood forecasts are<br />
formulated with the help of multiple correlation diagrams in which the actual river stages<br />
at the base and forecast stations, the rainfall in the intervening catchments with<br />
98
Technical report of project (GT/1010-00-04)<br />
appropriate antecedent precipitation index, and the stages of the tributaries joining the<br />
river between the base and the forecast stations are the parameters. In the last three<br />
decades, significant progress in flood forecasts in India has been made. A flood forecast<br />
program now covers all major interstate rivers in the country. At present, data from about<br />
350 hydrological sites and the 500 meteorological stations are included in the programme<br />
for collecting data for forecasts. Data are transmitted to analysis centers over<br />
radiotelephones by a network of 450 wireless sets.<br />
Data Collection Network and Communication Systems<br />
An up-to-date and reliable hydro-meteorological and hydrological database is a<br />
basic prerequisite for any effective flood disaster management activity. For the<br />
Brahmaputra basin with its enormous untapped resources potential, inaccessible and<br />
rugged terrain condition and inadequate scientific database, there is an imperative need to<br />
strengthen and update the technological, institutional and infrastructure aspect of data<br />
collection, transmission and processing. Given the international character of the basin,<br />
spread over several large populous countries, there is an overriding necessity for<br />
development of regional as well as international cooperation in various water resources<br />
assessment activities. Standardizing and upgrading data acquisition, transmission and<br />
processing procedures through development of appropriate technological and manpower<br />
base and networking facilities should greatly help in the effective management of flood<br />
hazards and utilization of the water resources in rivers like the Brahmaputra.<br />
Fig. 6.3-1 Shows density of meteorological stations in India<br />
For the purpose of flood forecasting and warning, the Central Water Commission<br />
(CWC) through a network of rain gauge stations routinely collects hydro-meteorological<br />
and hydrological data on the Brahmaputra sub-watersheds and the mainstream. The<br />
Indian Meteorological Department (IMD) and few state government departments<br />
99
Technical report of project (GT/1010-00-04)<br />
including Agriculture, Irrigation and Flood Control also maintain their network of hydrometeorological<br />
stations. Fig. 6.3-1 shows the density of meteorological stations in India.<br />
For the measurement of rainfall, both ordinary and self-recording rain gauges are being<br />
used although the network is rather sparse, especially in regard to self-recording rain<br />
gauges and the upper catchments of the rivers. According to an estimate made in 1993,<br />
there were 336 ordinary rain gauges and 113 self-recording rain gauges in the<br />
Brahmaputra catchments covering India and Bhutan with a total area of 240,000 sq. km.<br />
However, the density of the network, especially in the case of self-recording rain gauges,<br />
was found low as per the WMO suggested norm (WAPCOS, 1993). A current estimate<br />
indicates there are about 300 ordinary rain gauges and 100 self-recording rain gauges in<br />
the Indian part of the Brahmaputra basin. The Indian Meteorological Department (IMD)<br />
maintains 74 ordinary and 61 self-recording stations, while government departments of<br />
different states including Assam maintain 167 ordinary rain gauges. The Brahmaputra<br />
Board maintains 60 ordinary and 30 self-recording gauges, and the NF Railways 5<br />
ordinary rain gauges.<br />
The network of rain gauges remains inadequate in the mountain region. The<br />
monitoring of flow in the Brahmaputra basin is maintained by a network of water<br />
gauging stations is the Central Power Commission in collaboration with the state Flood<br />
Control Department. Currently there are six major gauge stations on the Brahmaputra<br />
where stage, discharge and sediment measurements are carried out on a daily basis. On<br />
most tributaries, there are more than 50 rain gauge stations, the major tributaries having<br />
at least one site on the upstream and one on the downstream section. The density of the<br />
existing network, especially in the upper catchments of the rivers, is rather sparse. The<br />
water levels are measured using conventional methods. Automatic gauging of water<br />
levels is not yet done on a routine basis on the river. The flood water level data are<br />
transmitted mainly through wireless and occasionally through telephone, telegraph or fax.<br />
In India, there are 3,037 reporting rain gauges and 5,801 non-reporting rain gauge<br />
stations used to observe rainfall. Apart from ground stations, a voluntary observing fleet<br />
of 207 Indian ships is used. For transmission of hydro-meteorological and hydrological<br />
data from the rain gauge stations, the CWC depends mainly on a wireless network<br />
dedicated for the purpose. However, land line communications using telephone, telegraph<br />
and fax facilities are also used wherever available. Flood warnings are made mainly on<br />
the basis of travel time between the selected base station and the particular forecast<br />
station and the rain-gauge-to-rain-gauge correlations of water levels. The lead-time for<br />
the forecasts varies depending on the travel time between the concerned rain gauges<br />
being used. For the mainstream of the Brahmaputra the lead-time is up to 112 hours.<br />
During the period of high floods, flood-warning messages are broadcast through local<br />
radio and television centers and also through the printed media. The information is also<br />
supplied to the various user agencies or departments. Although the technology of satellite<br />
telemetry is available in the country, is not yet being used on operational basis for flood<br />
forecasts activities in the Brahmaputra basin.<br />
Methods used in flood forecasting and dissemination of information<br />
The data transmitting capability of modern satellites has immense potential for<br />
hydrological applications, especially in the area of flood forecasts. The geostationary<br />
weather communications satellite of India called INSAT belongs to this category of<br />
100
Technical report of project (GT/1010-00-04)<br />
satellites which has onboard Data Collection System (DCS) that transmits data received<br />
from ground based Data Collection Platforms (DCP) to the computerized data processing<br />
facilities. Commonly used hydrological variables such as water stage, flow, precipitation,<br />
etc. can be interfaced with DCPs and relayed via satellite to the analysis centers for<br />
timely dissemination of early warning and real-time coordination of relief operations.<br />
One hundred meteorological data collection platforms have been installed throughout the<br />
country. The Central Water Commission has also deployed 15 DCPs in the Yamuna<br />
catchments for flood forecasts. The advent of Very Small Aperture Terminals (VSAT)<br />
and Ultra Small Aperture Terminals (USAT) has further increased the capability by<br />
providing low cost, viable technology that can be used for disaster mitigation and<br />
management. A fully automatic operational flood forecasts system is being tested in a<br />
pilot project conducted in the Yamuna basin near Delhi. With the availability of multiple<br />
satellite data from IRS, Landsat, ERS and Radarsat, India has made considerable progress<br />
in recent times in mapping and monitoring flood episodes in near real-time in selected<br />
watersheds including the Brahmaputra in Assam. Both optical as well as microwave data<br />
from different sensors such as WiFS, LISS III and PAN from IRC IC and ID, TM data<br />
from Landsat-5 and microwave data from ERS and Radarsat are being used for the<br />
purpose. The data obtained from the wide field sensor called WiFS onboard IRS-IC and<br />
ID satellites prove to be particularly useful in flood studies due to their large swath and<br />
higher receptivity. The Disaster Management Group of the Department of Space,<br />
Government of India is currently leading the country in near real-time mapping of floods<br />
and assessment of damage in selected watersheds, in collaboration with relevant state<br />
government departments/agencies such as the Remote Sensing Application Centers, the<br />
Department of Agriculture, and the Department of Revenue. The data and information on<br />
inundation and damage due to floods are made available to the concerned state<br />
departments for making reliable estimates of damage and organizing necessary relief<br />
measures.<br />
Recent exercises carried out in the country indicate that the introduction of remote<br />
sensing inputs such as satellite-based rainfall estimates, landuse/land cover, soil status,<br />
etc. in the rainfall-runoff models and integration of these databases under GIS<br />
environment considerably improves flood forecasting capabilities. Similarly, use of<br />
satellite-based data during pre-flood, flood and post-flood periods along with<br />
conventional ground information provides more reliable and timely assessment of<br />
damages.<br />
Initially, flood forecasts in the country were based on a simple graphical<br />
correlation between upstream and downstream gauge stations. Later, rainfall and rain<br />
gauge/discharge data of tributaries, etc. were also incorporated. In certain cases,<br />
application of unit hydrograph and flood routing models were also used. Efforts to<br />
develop suitable mathematical models were started during the 1980s. The modified<br />
version of the SSARR model was developed for the Yamuna River and the NAM model<br />
was developed for the Damodar River. Several other models such as TANK, NWSH,<br />
HBV, etc. are also currently being used. These exemplify the countrywide endeavor<br />
being made in government agencies and educational institutions to develop suitable flood<br />
forecast models. However, in the case of the Brahmaputra, no major effort on<br />
mathematical modeling for the purpose of flood forecasts and disaster mitigation has<br />
been undertaken so far.<br />
101
Technical report of project (GT/1010-00-04)<br />
Institutional arrangements for flood forecasts adopted so far in the country,<br />
especially with regard to the Brahmaputra basin, needs to be revamped and reorganized<br />
so that flood forecasts and warning activities are done more efficiently using state-of-theart<br />
technology. The research and development components in existing organizations<br />
involved in flood forecasts need to be upgraded with respect to technology and<br />
manpower base. Educational institutions presently offering or planning to offer scientific<br />
courses or training in the area of flood forecasts should be strengthened. Introduction of<br />
private entrepreneurship and involvement of NGOs may also contribute to more effective<br />
management of flood disasters including flood forecasts and warning activities. There is a<br />
pressing need for institutional changes to develop a network of hydrological and hydrometeorological<br />
stations through cooperation and coordination on national and regional<br />
scales, including standardization of instrumentation and methodology. There is also a<br />
pressing need to ensure better accessibility to existing hydrological and hydrometeorological<br />
databases, especially in regard to a large, underdeveloped watershed like<br />
the Brahmaputra River. More efficient and wider dissemination of information in regard<br />
to flood disaster management is a matter of great urgency where the attention of<br />
concerned national governments and international agencies should be further focused.<br />
Little written information and data are available on the accuracy level of flood<br />
forecasts. Available records indicate that in the early 1990s, a forecast was considered to<br />
be reasonably accurate if the observed water level fell within 15 cm of the forecasts level<br />
(Rao, 1989). Flood forecasts currently issued by CWC using conventional rainfall-runoff<br />
models have an accuracy of 65-70% with a warning time of six to twelve hours (Rao,<br />
2000). Inadequacy in the rainfall gauge network and lack of sufficient data on basin<br />
parameters are the major causes behind lower accuracy level of the forecasts.<br />
Encouraging results have been obtained in a pilot study carried out in the lower Godavari<br />
basin where satellite remote sensing, GIS and GPS technologies were used in conjunction<br />
with ground observations. In this case, the deviation of the flood forecasts from observed<br />
floods was estimated to be within 15 percent.<br />
Existing cooperation agreements<br />
In the area of flood forecasting and warning there is extensive cooperation<br />
between various concerned departments of the Central Government and affected state<br />
governments. Although CWC is primarily responsible for flood forecasts and warning<br />
activities in the country, several other central government departments and agencies<br />
including the IMD, DOS, Ministry of Agriculture, and Ministry of Irrigation together<br />
with state government departments such as Agriculture, Revenue, Flood Control, and<br />
Irrigation are involved. In the case of the Brahmaputra River, the Brahmaputra Board is<br />
expected to play a significant role in the management of flood hazards and utilization of<br />
river water resources within the basin. The Brahmaputra is a major international river<br />
with very significant upstream-downstream linkages, and there is an imperative need for<br />
cooperation and coordination among the different countries sharing the river, especially<br />
in regard to flood management. However, there is no such existing cooperation<br />
agreement between the riparian nations sharing the watershed.<br />
Lesson Learned in Flood Forecasting<br />
102
Technical report of project (GT/1010-00-04)<br />
Although there have been frequent floods of great magnitude affecting millions of<br />
people and causing immense damage to public property and infrastructure, in the absence<br />
of any existing agreement among the concerned countries regarding sharing of data and<br />
information on water resources, the efforts made so far in individual countries in the area<br />
of flood forecasting and warning have been only partially successful and less than<br />
effective. Inadequacies in the monitoring network and lack of desired level of<br />
sophistication and standardization in data acquiring, transmission and processing<br />
techniques have widely been realized now by scientists, technologists, planners and<br />
decision makers. Lack of accessibility and transparency with regard to hydrological data,<br />
especially on international rivers like the Brahmaputra, proves detrimental to the<br />
development and expansion of research and development activities on water-related<br />
issues including flood forecasts and warnings. Considerable growth of bureaucratization<br />
as well as centralization of power and resources in the management of water resources<br />
have hampered flood forecasting efforts. There is a definite need for change in policy,<br />
reorientation of strategy and revamping or establishment of institutions for development<br />
of efficient flood forecasts and warning systems. Figs. 6.3-2 and 6.3-3 show storm<br />
detection radar and cyclone warning radar networks in India. This radar is very useful in<br />
forecasting storms and cyclones and helps the country decide whether to evacuate coastal<br />
areas.<br />
Fig. 6.3-2 Shows storm detection radar and cyclone warning radar networks in India<br />
103
Technical report of project (GT/1010-00-04)<br />
Fig. 6.3-3 Shows storm detection radar and cyclone warning radar networks in India<br />
Seasonal Prediction of Indian summer Monsoon<br />
The Indian summer monsoon controls the rainfall over India and Bangladesh. The<br />
prediction of the onset and magnitude of Indian summer monsoon is of paramount<br />
importance in flood forecasts and climatic conditions. To achieve a reliable and accurate<br />
prediction of the Indian summer monsoon, understanding the influence of various other<br />
parameters and their interdependence are required. In 1875, the National Meteorological<br />
Services of India was established to undertake a systematic study of weather and climate<br />
in the subcontinent. The information was used to issue forecasts and warnings during the<br />
summer monsoon. Indian summer monsoon has shown a considerable inter-annual and<br />
inter-seasonal variability and years of droughts and floods have occurred occasionally in<br />
successive years (1917 and 1918, 1987 and 1988). Monsoons are a quasi-global<br />
perturbation in the general circulation of the atmosphere. Understanding its regional<br />
characteristics over Africa, China, and India and in other parts of the world affected by<br />
the monsoon regime needs constant effort. Forecasting monsoon rains on different space<br />
and time scales is a challenging task. In recent years, considerable knowledge has been<br />
acquired and is being used with respect to ENSO and their global influence in modulating<br />
the rainfall and circulation in the tropics. In 1990, the World Hydrological Cycle<br />
Observing System (WHYCOS) was set up to collect data. From this, WMO supports the<br />
collection and dissemination of water related data and information from an integrated<br />
104
Technical report of project (GT/1010-00-04)<br />
system of regional and global networks of observing stations using modern technology<br />
(Fig.6.3-4).<br />
Fig. 6.3-4 WHYCOS general scheme of data collection and dissemination network (Source:<br />
WHYCOS, 2001)<br />
6.4 Other countries and regions<br />
6.4.1 Floods in Pakistan<br />
The total geographical area of Pakistan is 796,000 sq. km. and can be broadly<br />
divided into three hydrologic units: the Indus basin, which covers nearly 70% of the<br />
country’s area; the Kharan desert; and the Makaran arid and coastal area, which almost<br />
evenly constitute the rest. The main water resource in Pakistan is therefore the Indus<br />
basin with a total drainage area of 965,300 sq. km, of which 58% lies in Pakistan and the<br />
rest in India, China and Afghanistan.<br />
6.4.2 Flash floods in the Indus river basin<br />
Heavy concentrated rainfall in the catchment during the monsoon season, which is<br />
sometimes augmented by snowmelt flow and rainfall primarily outside the Indus plain,<br />
generally causes floods. Monsoon currents originating in the Bay of Bengal and<br />
subsequent depressions often result in heavy downpours in the Himalayan foothills and<br />
Koh Hindukush, occasionally producing destructive flash floods along one or more of the<br />
main rivers of the Indus system. In some cases, exceptionally high floods have been<br />
caused by the formation and subsequent collapse of temporary natural dams from<br />
landslides or glacier movements. The Federal Flood Commission has been functioning as<br />
a Federal Agency on a national basis since 1977 to design, execute and monitor a<br />
National Flood Protection Plan to mitigate flood damage and safeguard human life and<br />
property.<br />
6.5 Stream Flow Model for Africa<br />
105
Technical report of project (GT/1010-00-04)<br />
The Famine Early Warning System Network (FEWS NET) in cooperation with<br />
the USGS/EROS Data Center has undertaken efforts to enhance flood preparedness.<br />
Through the use of hydrologic modeling techniques, it is possible to better predict and<br />
react to such events. The FEWS NET Stream Flow Model (SFM) (Fig. 6.5-1) is a<br />
geospatial model based on the use of satellite remote sensing, numerical weather forecast<br />
fields, and geographic data sets describing the land surface. The model is currently<br />
operational in Southern Africa, and implementation will soon cover all basins of concern<br />
to the 17 FEWS NET countries.<br />
Fig. 6.5-1 Conception of the Stream Flow Model (SFM) (Source, USGS, 2001)<br />
The FEWS NET hydrological model was developed by the USGS/EROS Data<br />
Center to provide a continuous simulation of stream flow, on a daily time step, for<br />
approximately 5,600 basins on the African continent. Mean basin area in the Southern<br />
Africa region is approximately 3,500 km 2 . The model is a physically-based catchments<br />
scale hydrologic model (semi-distributed hydrologic model). It consists of a GIS-based<br />
module, used for model input and data preparation, and the rainfall-runoff simulation<br />
model. The rainfall-runoff model is comprised of a soil and water accounting module that<br />
produces surface and sub-surface runoff for each sub-basin, an upland headwater basins<br />
routing module, and a major river routing module.<br />
zones:<br />
The runoff prediction module conceptualizes the soil as composed of two main<br />
• An active soil layer where most of the soil-vegetation-atmosphere interactions<br />
take place.<br />
• A groundwater zone.<br />
The active soil layer is divided into an upper thin soil layer where evaporation,<br />
transpiration, and percolation take place, and a lower soil layer where only transpiration<br />
and percolation occur.<br />
106
Technical report of project (GT/1010-00-04)<br />
Fig. 6.5-2 Stream Flow Model Inputs (Source, USGS, 2001)<br />
6.5.1 Topography<br />
GTOPO30 global topographic data set (Gesch et al., 1999) describes the<br />
continents with elevation values at a regular spacing of 30 arc seconds of latitude and<br />
longitude. Preparation of hydrologic derivatives from GTOPO30 by USGS (1999)<br />
yielded the HYDRO1K data set consisting of basin delineations and stream networks<br />
bearing topological identification numbers, as well as grids of flow direction, flow<br />
accumulation, slope, and other variables. HYDRO1K basins and streams provide the<br />
spatial framework for the FEWS NET SFM.<br />
Flow direction Flow Accumulation Flow Length<br />
Terrain slope Hill Length Sub-basin Linkage<br />
107
Technical report of project (GT/1010-00-04)<br />
Fig. 6.5-3 Other Derivatives of USGS 1 km DEM (Source: USGS, 2001)<br />
The runoff-producing mechanisms considered in the model are surface runoff due<br />
to precipitation excess (including direct runoff from impermeable areas of the basin),<br />
rapid subsurface flow (interflow), and base flow. The model has an upland headwater<br />
basin routing module and a major river routing module. The surface upland routing<br />
routine is a physically based unit hydrograph method that relies on cell-based landscape<br />
attributes such as drainage area, slope, flow direction, and flow length derived from a<br />
digital elevation model. The interflow and base flow components of the runoff are routed<br />
with a set of theoretical linear reservoirs. In the main river reaches, water is routed using<br />
a nonlinear formulation of the Muskingum-Cunge routing scheme. Most of the model<br />
parameters have a physical meaning and are determined by the spatial distribution of<br />
basin characteristics. Parameterization of the basin’s hydrologic properties is<br />
accomplished through the use of three data sets describing the Earth's surface:<br />
topography, land cover, and soils. Currently, a fifth level Pfafstetter subdivision (Verdin<br />
and Verdin, 1999) derived from the GTOPO30 global topographic data set is used to<br />
define sub-basins and model the African continent.<br />
6.5.2 Land Cover<br />
Using land cover for Africa derived from 1-km satellite data (Loveland and<br />
Belward, 1997), in conjunction with soils information, rainfall incidence on a basin is<br />
partitioned to separate surface runoff from water infiltrating into the soil. A twelve-month<br />
time series of 1-km vegetation index imagery was the primary basis for classification of<br />
land cover types (Fig. 6.5-3).<br />
Fig. 6.5-4 Land cover in Africa (Source: USGS, 1995)<br />
108
Technical report of project (GT/1010-00-04)<br />
6.5.3 Soil<br />
The Digital Soil Map of the World (FAO, 1997) was derived from an original<br />
compilation at a 1:5,000,000 scale. Attributes for soil associations are used by the SFM to<br />
set hydraulic parameters that govern interflow, soil moisture content, and deep<br />
percolation to the ground water table. Rates at which subsurface layers release water to<br />
the stream network also depend on these physical soil attributes.<br />
Value Count Soil_name Unclassified Very_poor Poor<br />
1 4831 Af14-3c 0.000 15.000 30.000<br />
2 32134 Af17-1/2ab 0.000 6.250 11.250<br />
3 23247 Af32-2ab 0.000 5.000 10.000<br />
4 484 Ao39-2b 0.000 17.500 25.000<br />
5 3708 Ao41-2bc 0.000 17.500 25.000<br />
6 3582 Ao63-3b 0.000 20.000 22.500<br />
7 1902 Bc8-2b 0.000 0.000 30.000<br />
8 1497 Bc9-2b 0.000 0.000 17.500<br />
9 4793 Bd30-2/3c 0.000 7.500 37.500<br />
11 22816 Bd31-2c 0.000 0.000 47.500<br />
16 1235 Be45-2a 0.000 0.000<br />
17 3180 Be47-2a 0.000 0.000<br />
Fig. 6.5-5 FAO Digital soil map of Africa (Source: FAO, 1999)<br />
6.5.4 Model Forcing<br />
Daily variations in weather drive the calculation of stream flow estimates. Fluxes<br />
of water between the atmosphere and Earth's surface are described using geospatial<br />
estimates of precipitation and evaporation.<br />
6.5.5 Satellite Rainfall Estimates (RFE)<br />
(a) (b)<br />
109
Technical report of project (GT/1010-00-04)<br />
Fig. 6.5-6 (a) Current Rainfall Estimate, NOAA. (b) Quantitative Precipitation Forecast,<br />
AFWA.<br />
Satellite rainfall estimates are of fundamental importance for geospatial stream<br />
flow modeling. They describe the spatial distribution of precipitation, which the SFM<br />
uses to determine the gross input of water to each basin for each day. NOAA/CPC<br />
(Climate Prediction Center) has provided dekadal RFE for Africa since 1995 (Herman et<br />
al., 1997). Since 1998, daily RFE have been provided, and in 2000, a new method based<br />
on Xie et al. (1997) was introduced.<br />
6.5.6 Integrating Satellite Rainfall Estimates with Digital River Basin Maps<br />
Excess precipitation and flooding can adversely affect food security through<br />
reduced crop production and disrupted transportation and market systems. Efforts have<br />
focused on new methods of analyzing the spatial and temporal patterns of precipitation to<br />
identify these situations. NOAA's Climate Prediction Center produces gridded rainfall<br />
estimates (RFE) for FEWS through processing Meteosat imagery, rain gauge data, and<br />
model estimates of wind and relative humidity. USGS scientists have developed methods<br />
for spatial integration of the RFE over topologically linked river basins derived from a 1km<br />
digital elevation model. These accumulations are compared with long term average<br />
values to derive a flood risk score. Cartographic products with color-coded basins and<br />
drainage networks are made to highlight areas with high scores. Comparison of these<br />
products with reports from disaster relief agencies and the press show the correlation of<br />
prolonged heavy rainfall associated with flooding and the disruption of human activities.<br />
Fig. 6.5-7 Integrating Satellite Rainfall Estimates with Digital river basin Map (source:<br />
USGS, 2001)<br />
The disastrous floods in Mozambique during February and March of 2000 are<br />
illustrated, including the importance of heavy rains that fell in upstream areas outside the<br />
country. A companion product was a map of estimated runoff travel times, using digital<br />
110
Technical report of project (GT/1010-00-04)<br />
elevation data and an approximation of the Manning equation for flow in an open<br />
channel.<br />
In Basin Excess Rainfall Maps, the catchment map highlights sub-basins (out of<br />
approximately 3,000 across the continent) receiving above-average precipitation for the<br />
dekad by color coding the relevant polygons. The scale is a scoring system that uses both<br />
total rainfall and total cumulative rainfall over a sub-basin for the dekad, divided by the<br />
same variable for long term average conditions. The greater the ratios, the higher the<br />
score.<br />
The river (or stream) map highlights the reaches of the river receiving aboveaverage<br />
amounts of dekadal precipitation according to a similar scoring system. The<br />
difference is that a reach of the river may receive rainfall from a much larger upstream<br />
area than that of the sub-basin polygon in which it lies. Thus, a sub-basin may not be<br />
highlighted because only light rain is occurring locally, while the reach of river passing<br />
through it is highlighted, due to heavy rains in upstream catchments.<br />
6.5.7 Potential Evapotranspiration (PET)<br />
Potential evapotranspiration represents atmospheric demand for water from the<br />
Earth's surface as a function of solar radiation, air temperature, wind, humidity, and<br />
atmospheric pressure. PET is essential for the calculation of a daily basin water balance.<br />
The USGS has developed routines for ingest of grids for the input variables as<br />
produced by NOAA's Global Data Assimilation System (GDAS) on a 1-degree grid. PET<br />
is then calculated on a cell-by-cell basis according to the Penman-Monteith equation<br />
(Shuttleworth, 1992; Verdin and Klaver, 2001). Grids are produced on a daily time step<br />
for use with the FEWS NET stream flow model.<br />
Fig. 6.5-8 Potential Evapotranspiration (Source: EROS Data Center, 2001)<br />
111
Technical report of project (GT/1010-00-04)<br />
6.5.8 Stream Flow Model Flow Chart<br />
The FEWS hydrological model was developed by USGS scientists to provide a<br />
continuous simulation of stream flow, on a daily time step, for nearly 3,000 basins on the<br />
African continent. Mean basin area in the Southern Africa region is approximately 5,400<br />
km 2 . The model is a physically based catchment scale hydrologic model (semi-distributed<br />
hydrologic model). It consists of a GIS-based module used for model input and data<br />
preparation, and the rainfall-runoff simulation model. The rainfall-runoff model<br />
comprises a soil and water accounting module that produces surface and sub-surface<br />
runoff for each sub-basin, an upland headwater basins routing module, and a major river<br />
routing module (http://edcnts11.cr.usgs.gov/gflood/images/moz03.jpg).<br />
The runoff prediction module conceptualizes the soil as composed of two main<br />
zones: (a) an active soil layer where most of the soil-vegetation-atmosphere interactions<br />
take place, subdivided into two-layers; and (b) a groundwater zone. The active soil layer<br />
is divided into an upper thin soil layer where evaporation, transpiration, and percolation<br />
take place, and a lower layer where only transpiration and percolation take place. The<br />
runoff producing mechanisms considered in the models include surface runoff due to<br />
precipitation excess (including direct runoff from impermeable areas of the basin), rapid<br />
subsurface flow (interflow), and base flow. The three linear reservoirs are for surface<br />
runoff, rapid sub-surface flow, and groundwater routing. For routing in the main river<br />
reaches, a nonlinear formulation of the Muskingum-Cunge channel routing scheme is<br />
used.<br />
Fig. 6.5-9 FEWS Flood Risk Monitoring System Flow Diagram (Source: USGS/EROS Data Center,<br />
2001)<br />
112
Technical report of project (GT/1010-00-04)<br />
6.5.9 Data<br />
Important data sets required by the model include:<br />
• USGS HYDRO1K database (http://edcdaac.usgs.gov/gtopo30/hydro), a<br />
derivative of the USGS digital elevation database<br />
(http://edcdaac.usgs.gov/gtopo30/gtopo30.html);<br />
• USGS global land cover characteristics database<br />
(http://edcdaac.usgs.gov/glcc/glcc.html);<br />
• FAO digital soil map of the world (http://www.fao.org/ag/agl/agll/prtsoil.htm);<br />
• A daily version of the NOAA 10-day rainfall estimate (RFE) images<br />
(http://edcintl.cr.usgs.gov/adds/data/data.html);<br />
• Daily potential evapotranspiration fields derived using Global Data Assimilation<br />
System (GDAS) climate fields as input to the Penman-Monteith equation.<br />
The HYDRO1K data provides basin boundaries and stream networks that form<br />
the spatial framework of the model. These elements carry identification numbers that<br />
embed topological (upstream-downstream connectivity) information in the digits - thus<br />
the need for complex linkage tables that add to the computational burden is avoided. Grid<br />
cell resolution for HYDRO1K data is one kilometer. The FAO soil map provides<br />
characterization of the hydraulic properties of the earth's surface that are required to<br />
compute the water balance within a basin. Its original scale is 1:5,000,000, roughly<br />
equivalent to a 5-km resolution. The NOAA RFE are calculated on a 0.1-degree<br />
latitude/longitude grid, approximately 10-km resolution. They provide the estimates of<br />
gross precipitation input to each basin. This product is prepared from METEOSAT<br />
thermal infrared images and ground based rainfall stations.<br />
6.5.10 Daily prediction hydrographs<br />
Updated plots of daily-simulated stream flow, for the period January through<br />
April, are provided for the important rivers. The model has not been calibrated (nor<br />
validated) with observed data, nor have the effects of dams on stream flow timing and<br />
magnitude been included. The utility of the hydrograph traces lies in their ability to<br />
illustrate trends in river flow magnitude and persistence. This model is still under<br />
development and these hydrographs are considered experimental. Model estimated<br />
hydrographs for dates in the future are based on quantitative precipitation forecasts (QPF)<br />
provided by NOAA.<br />
6.5.11 Rainfall estimates<br />
A technique for estimation of precipitation over Africa was developed to augment<br />
the rainfall data available from the relatively sparse observational network of rain gauge<br />
stations over this region. The method utilizes Meteosat satellite data, Global<br />
Telecommunication System (GTS) rain gauge reports, and microwave data from SSM/I<br />
and AMSU for the computation of estimates of accumulated rainfall. Rainfall Estimates<br />
(RFE) are produced by NOAA/CPC (Climate Prediction Center) to assist in drought and<br />
flood risk-monitoring efforts for the African continent.<br />
113
Technical report of project (GT/1010-00-04)<br />
6.5.12 Wide-Area Flood Risk Monitoring Model (See appendix 4 for details)<br />
6.6 Earth observation and remote sensing as a tool for developing an<br />
early warning system<br />
Remote Sensing technologies have proved to be valuable tools to support<br />
effective early warning for disasters. With the advent of remote sensing technologies,<br />
monitoring of atmosphere and retrieval of meteorological parameters has become simpler<br />
and scientists are using this information in daily weather forecasts. Numerous satellites<br />
with broadband electromagnetic wavelengths enable collection and monitoring of data<br />
about atmospheric conditions and characteristics of the Earth’s surface, leading to<br />
processes that may be able to predict natural disasters. Such information can be used to<br />
help determine appropriate actions to reduce the disastrous effects of these processes.<br />
6.6.1 Characteristics of remote sensing technologies<br />
Earth observation satellite systems provide a wealth of detailed information at a<br />
global level for early warning activities. This information includes two categories of data:<br />
first, numerical values of detected geophysical parameters or related measurements, and<br />
second, imaging data sensed in various electromagnetic bands. Many different space<br />
systems exist, with different characteristics related to:<br />
• Spatial distribution: the size of the area on the terrain that is covered by the<br />
instantaneous field of view of a detector<br />
• Spatial resolution: the minimum distance at which two adjacent targets are<br />
detected as individually separated<br />
• Temporal resolution: the time taken for a satellite to revisit the same part of the<br />
Earth’s surface<br />
• Spectral resolution: the number and width of the spectral bands recorded<br />
• Radiometric resolution: the accuracy of the sensor response to the changes of<br />
signal to be detected<br />
Data from satellites are collected through a variety of technologies that apply to<br />
both "passive" and "active" earth observations. Whatever the wavelength of the electromagnetic<br />
radiation, "passive" systems are meant to use natural radiation sources (e.g.,<br />
sunlight), whereas active systems (e.g., radar) emit and retrieve radio waves reflected<br />
from the Earth’s surface.<br />
Ultraviolet-to-infrared systems are sensitive to reflectance, which is a measure of<br />
molecular resonance of surface materials; the backscatter of microwaves is sensitive to<br />
their roughness and dielectric constant. The advantage of active microwave systems (e.g.,<br />
Synthetic Aperture Radar) is that they can "illuminate" the Earth’s surface and detect<br />
relief features regardless of night and weather conditions. Passive observation of the<br />
Earth is carried out essentially in high frequencies, usually between less than 0.3 microns<br />
(UV band, suitable for Ozone and SO2 detection, e.g.) and 11 microns (thermal far-IR). It<br />
includes the Visible (0.3-0.7 micron) and the near-IR bands (0.7-1.2 micron), like those<br />
used to forecast the weather, and the mid-IR (4 micron) sub-band that also senses<br />
variations in heat levels. Though less common, passive observation is also carried out in<br />
the upper microwave bands (between 50 and 90 GHz) for advanced meteorological<br />
114
Technical report of project (GT/1010-00-04)<br />
studies on cloud systems. Image acquisition techniques may be either film-based (analog)<br />
or electro-optical (digital). In the first case, optical or near-IR systems capture light<br />
reflected from the surface of the Earth with standard camera technology, and drop film<br />
canisters into the atmosphere to be retrieved and processed in hard copy form. Similar<br />
digital acquisition is used for SAR data that contain the additional information on the<br />
phase changes the signals have undergone after leaving the transmitter. Reconstruction of<br />
detailed altitude maps is then obtained by "unwrapping" the phase information across the<br />
pixels that constitute the entire SAR image.<br />
High Resolution Imaging Satellites<br />
Besides the use of conventional aerial photographs, which often remain the most<br />
useful tools in many types of disaster studies, the application of satellite data has<br />
increased enormously over the last few decades. After the initial low spatial resolution<br />
images of the LANDSAT MSS (60 x 80 m), LANDSAT also offers thematic mapper<br />
images with a spatial resolution of 30 m (except for the thermal infrared band) and an<br />
excellent spectral resolution with six bands covering the whole visible and the near and<br />
middle infrared part of the spectrum, and with one band in the thermal infrared.<br />
LANDSAT has a theoretical temporal resolution of eighteen days; however, weather<br />
conditions are a serious limiting factor in this respect, as clouds can hamper the visible<br />
band acquisition of data from the ground surface during overpasses. Another limitation of<br />
the LANDSAT System is the lack of an adequate stereovision. Theoretically, a stereo<br />
mate of a TM image can be produced with the help of a good digital terrain model<br />
(DTM), but this remains a poor compensation as long as very detailed DTMs are<br />
available. The French SPOT satellite is equipped with two sensor systems, each covering<br />
adjacent paths of a 60 km width. The sensors have an off-nadir looking capability,<br />
offering the possibility for images with good stereoscopic vision. The option for side<br />
views results in a higher temporal resolution. SPOT senses the terrain in a wide<br />
panchromatic band and in three narrower spectral bands (green, red and infrared). The<br />
spatial resolution in the panchromatic mode is 10 m, while the three spectral bands have a<br />
spatial resolution of 20 m. The system lacks spectral bands in the middle and far<br />
(thermal) infrared.<br />
LANDSAT has the longest record of widely available high-resolution multispectral<br />
image data series. However, image data in optical bands can be provided by<br />
devices carried on board the spacecraft of other countries, such as the Russian Federation<br />
(COSMOS, MIR and other missions), Japan (MOS) and India (IRS). Radar satellite<br />
images, available from the European ERS, the Japanese JERS and the Canadian Radarsat<br />
satellites offer an all-weather capability, as the system penetrates clouds. Theoretically,<br />
this type of image can yield detailed information on surface roughness and micromorphology;<br />
however, the applied wavelengths and viewing angle have made its<br />
application in mountainous terrain difficult. Early results of research with radar<br />
interferometery are promising, indicating that detailed terrain models with an accuracy of<br />
around one meter can be created. This offers the possibility of monitoring water<br />
movements. Remote sensing data should generally be linked or calibrated with other<br />
types of data obtained from mapping, measurement networks or sampling points, to<br />
derive the parameters that are useful in the study of flood disasters. The linkage is done in<br />
two ways, either via visual interpretation of the image or via digital data merging and<br />
115
Technical report of project (GT/1010-00-04)<br />
integration. GIS are powerful tools that facilitate the combination of the different types of<br />
data required for flood disaster management and the presentation of information in a form<br />
best understood by managers or administrators. If all of the currently scheduled<br />
government and commercial land-viewing satellite systems orbit as planned, in the near<br />
future, a minimum of 19 satellites will be in polar orbit providing land data at resolutions<br />
from 1 to 30 meters in panchromatic, multi-spectral and radar formats. This will then<br />
provide considerable opportunity to acquire data for improved early warning for natural<br />
hazards such as floods.<br />
Disasters are often associated with heavy cloud cover. The use of radar data from<br />
ERS, JERS and Radarsat permits the imaging of flooded areas through the clouds even<br />
when prohibitive airplane flight conditions exist. Multi-temporal radar images map<br />
flooded zones almost automatically, when image data from before, during and after the<br />
event are merged in a single colored image where data of the imaging dates are displayed<br />
in one of the three basic colors (red, green or blue).<br />
Meteorological Satellite Data for Monitoring the Earth<br />
A global meteorological satellite system monitors the Earth’s atmosphere, ocean<br />
and land surface areas almost in real time from equatorial and polar orbits. Existing<br />
geosynchronous satellites include the Geostationary Operational Environmental Satellites<br />
(GOES) operated by the United States (at 75 and 135 degrees West), METEOSAT,<br />
operated by the European Organization for the Exploitation of Meteorological Satellites<br />
at 0 degrees longitude, the Geostationary Meteorological Satellite (GMS) operated by<br />
Japan at 140 degrees East, the Geostationary Observation Meteorological Satellite<br />
(GOMS) operated by the Russian Federation at 70 degrees East, and the Indian National<br />
Satellite (INSAT) operated by India at around 90 degrees East. Their geo-synchronous<br />
equatorial position at 35,800 km of altitude allows them to observe the same regions<br />
every few minutes. Moreover, their capacity to provide synoptic observations of regional<br />
cloud distributions, atmospheric and ocean temperature, relative humidity, wind velocity,<br />
distribution of precipitation and other parameters that could be derived from the satellite<br />
images have become essential elements in weather forecasting.<br />
Two of the most useful parameters for early warning activities that could be<br />
derived from these satellite data are cloud-top temperature and height. Sun-synchronous<br />
meteorological satellites in quasi-polar orbit fly at lower altitudes, in a range between 500<br />
and 1,500 km, and can provide a higher spatial resolution than their geo-synchronous<br />
counterparts, although with a much longer revisiting time (6 or 12 hours). Such satellites<br />
provide global coverage of the Earth twice every 24 hours, and can be used to determine<br />
sea surface temperature with a higher accuracy than what could be achieved from the<br />
geostationary orbit. Land-surface data obtained by these satellites have been found<br />
particularly useful, and inexpensive, for determining green biomass indices. Analysis of<br />
this data is used to monitor the encroachment of desert into previously vegetated areas,<br />
thereby marking the onset of a slowly developing disaster. The polar-orbiting<br />
meteorological satellites currently in use are those operated by the United States (NOAA-<br />
N series), by the Russian Federation (Meteor series) and by China (Feng Yung 1 series).<br />
Although their spatial resolution is relatively low, the geostationary and polar-orbiting<br />
meteorological satellites together provide operational and high frequency coverage of the<br />
entire Earth at very low cost. Thus, the use of their data in early warning, disaster<br />
116
Technical report of project (GT/1010-00-04)<br />
prevention and mitigation practices should be easily achievable by most national and<br />
regional emergency planning and response services.<br />
6.6.2 Telecommunications technology for early warning<br />
The benefits of interactive real-time telecommunications links between and<br />
among meteorologists, geologists, epidemiologists and the host of other professional<br />
disciplines within the disaster management community have long been appreciated.<br />
Realizing these perceived benefits, though, has been a challenge in many areas of the<br />
world. In urban centers of countries with highly developed economies (locations that<br />
provide the economic stimulus frequently needed to motivate the development of new<br />
technologies), some of these systems are operating. But in remote areas of these countries<br />
in general, if such networks are available at all, they are not likely to be widespread.<br />
Within three to five years there will be dozens of geostationary (GEO), low earth orbiting<br />
(LEO) and medium earth orbiting (MEO) satellite systems covering the entire world.<br />
They will consist of from one to as many as 325 satellites per system and will be a part of<br />
the Global Mobile Personal Communications by Satellite (GMPCS). These systems will<br />
make it possible and affordable to maintain early warning communications regardless of<br />
the nature of a disaster, its location, or the terrain of the affected area. This was not<br />
possible five years ago. There are essentially three types of communications technologies<br />
or systems for early warning:<br />
• The first is the telemetry associated with the relay of information from sensing<br />
technologies, usually to or among scientists involved with the specific the<br />
phenomenon, e.g., meteorologists, seismologists, etc. The "system" of these<br />
technologies is usually dedicated to the particular application and managed by the<br />
scientific establishment.<br />
• The second is the system of communication between and among the community<br />
of disaster managers. This may mean the national civil defense establishment, the<br />
military, the scientific community, selected governmental ministries or agencies,<br />
NGOs and others. These systems of telecommunications are also frequently<br />
dedicated for this purpose and managed independently of the "public"<br />
telecommunications services, although they also rely on national<br />
telecommunications infrastructure such as normal telephone lines.<br />
• Third, there are systems and networks used to transmit or broadcast warning<br />
messages and information to the public.<br />
Some elements of these networks are managed by "public" broadcasting entities<br />
(such as radio or television station broadcasting towers) while others are operated by<br />
local or national telecommunications entities or commercial enterprises. The function of<br />
technology that has, historically, been referred to as early warning technology could more<br />
accurately be considered early detection. The telecommunication components to these<br />
applications consist of the telemetry between the detection device and the scientific<br />
institution.<br />
6.6.3 Towards a global system<br />
117
Technical report of project (GT/1010-00-04)<br />
The World Meteorological Organization (WMO) has developed, by far, the most<br />
extensive organization and operational capabilities for Early Warning Systems for<br />
Natural Hazards. It may serve as a model for other sectors or, with appropriate<br />
consideration and organizational modification, add scope to its own mission.<br />
Meteorological services are required for safety of life and property, the protection of the<br />
environment, and for the efficiency and economy of a wide range of weather-sensitive<br />
activities. The receipt of observational data, analyses and forecasts by National<br />
Meteorological Centers is crucial to the provision of these services. The World Weather<br />
Watch (WWW) is the international cooperative program that arranges for the gathering<br />
and distribution of real time meteorological information on a worldwide basis required by<br />
individual members. This information is also used by other programs of WMO as well as<br />
by relevant programs of other international organizations.<br />
The overall objectives of the WWW Program are to:<br />
• Maintain an effective worldwide-integrated system for the collection, processing<br />
and rapid exchange of meteorological and related environmental data, analyses<br />
and forecasts.<br />
• Make available observational data, analyses, forecasts and other products, in both<br />
real-time and delayed access, as may be appropriate, in order to meet the needs of<br />
all members of WMO programs and of the relevant programs of other<br />
international organizations.<br />
• Arrange for the introduction of standard methods and technology that enable<br />
members to make best use of the WWW system to ensure an adequate level of<br />
services and also to provide for compatibility of systems essential for cooperation<br />
with other agencies.<br />
• Provide the basic infrastructure for the Global Climate Observing System (GCOS)<br />
and other WMO and international programs for climate monitoring and studying<br />
of climate issues.<br />
The WMO operates at global, regional and national levels. It involves the design,<br />
implementation and further development of three closely linked and increasingly<br />
integrated core elements:<br />
• The Global Observing System (GOS) consists of facilities and arrangements for<br />
making observations at stations on land and at sea, and from aircraft,<br />
environmental observation satellites and other platforms. The system is designed<br />
to provide observational data for use in both operational and research work. The<br />
baseline space-based subsystem of GOS comprises two operational near-polarorbiting<br />
satellites and five operational geostationary environmental satellites.<br />
Over 1,000 satellite receivers located worldwide within the National<br />
Meteorological or the WMO Secretariat had registered Hydro-meteorological<br />
Services by 1996.<br />
• The Global Telecommunications System (GTS) is composed of an increasingly<br />
automated network of telecommunications facilities for the rapid, reliable<br />
collection and distribution of observational data and processed information<br />
(currently the GTS is made up of 311 circuits, 262 of which are operational at<br />
signal speeds that vary from 50 baud to 64 kbps).<br />
118
Technical report of project (GT/1010-00-04)<br />
• The Global Data-processing System (GDPS) consists of world, regional or<br />
specialized, and National Meteorological Centers to provide processed data,<br />
analyses, and forecast products.<br />
The implementation and integration of these three core elements are supported<br />
through two additional programs. The first is the Data Management (WDM), which<br />
addresses standards and practices for the efficient handing and flow of data and products<br />
within the WWW system. The other is WWW System Support Activities (SSA), which<br />
provides guidance, assistance and training related to the planning, development, and<br />
operation of WWW.<br />
6.7 World hydrological cycle observing system (WHYCOS)<br />
The World Hydrological Cycle Observing System (WHYCOS) was developed to<br />
contribute to the above goal. Composed of regional systems (HYCOSs) implemented by<br />
cooperating nations, WHYCOS will complement national efforts to provide the<br />
information required for water resource management. Modeled on WMO's World<br />
Weather Watch (WWW), and using the same information and telecommunications<br />
technology, WHYCOS will provide a vehicle not only for disseminating high quality<br />
information, but also for promoting international collaboration. It will build the capacity<br />
of national Hydrological Services (NHSs), so that they are ready to face the demands of<br />
the 21st century. It will provide a means for the international community to monitor more<br />
accurately water resources at the global level, and to understand the global hydrological<br />
cycle. The first steps in implementing WHYCOS have been made through regional<br />
WHYCOSs in the Mediterranean, Southern Africa, and West-Central Africa. They have<br />
been made possible by collaboration between WMO, the World Bank, the European<br />
Union, and the Government of France.<br />
6.7.1 The need for WHYCOS<br />
During this century, the pressure on water resources increased dramatically. The<br />
world's population has already reached 5.5 billion, and will pass 8 billion within two<br />
decades. In 1997, one third of the world's population was estimated to live under waterstress<br />
conditions, and it is expected that by 2025 two thirds of the population will do so.<br />
Demand for water will only increase, but growing pollution is likely to reduce the<br />
available quantity of suitable water. Irrigated agriculture and hydroelectric power<br />
generation compete with other uses for limited water within national boundaries. At the<br />
same time, maintaining the health of aquatic ecosystems is increasingly accepted as an<br />
essential concern. About 300 river basins and numerous aquifers are shared among two or<br />
more nations; competition for water among nations could become a potential source of<br />
conflict.<br />
Planning and decision-making must achieve new levels of sophistication,<br />
reliability, and acceptance. This will demand timely, accurate and comprehensive<br />
information about the status of water resources, to complement information about the<br />
economic, social, and environmental dimensions of water use. Unfortunately, in many<br />
parts of the world the systems for collecting and managing water-related information are<br />
inadequate, and often are deteriorating. Particular difficulties include a lack of resources<br />
119
Technical report of project (GT/1010-00-04)<br />
to maintain observing stations, differing procedures for collecting data, variations in<br />
quality assurance procedures and standards between different agencies and countries,<br />
unreliable telecommunication systems, and outdated systems for information<br />
management.<br />
For all these reasons, in 1993 WMO launched WHYCOS. Its objectives are to:<br />
• Strengthen the technical and institutional capacities of hydrological services to<br />
capture and process hydrological data, and meet the needs of their end users for<br />
information on the status and trend of water resources<br />
• Establish a global network of national hydrological observatories which provide<br />
information of a consistent quality, transmitted in real time to national and<br />
regional databases, via the Global Telecommunication System (GTS) of WMO<br />
• Promote and facilitate the dissemination and use of water-related information,<br />
using modern information technology such as the World Wide Web and CD-<br />
ROMs<br />
6.7.2 WHYCOS concept<br />
WHYCOS is a global Programme, modeled on the WMO's World Weather<br />
Watch.<br />
It has two components:<br />
• A support component, which strengthens cooperative links among participating<br />
countries<br />
• An operational component, which achieves "on the ground" implementation at<br />
regional and international river basin levels<br />
6.7.3 WHYCOS data network<br />
WHYCOS is based on a global network of reference stations, which transmit<br />
hydrological and meteorological data in near real-time, via satellites, to NHSs and<br />
regional centers. These data enable the provision of constantly updated national and<br />
regionally distributed databases, of consistently high quality. WHYCOS aims to support,<br />
in all parts of the world, the establishment and enhancement of information systems that<br />
can supply reliable water-related data to resource planners, decision makers, scientists<br />
and the general public.<br />
120
Technical report of project (GT/1010-00-04)<br />
Fig. 6.7-1 WHYCOS regional components around the world (Source: WHYCOS, 2001)<br />
WHYCOS does not replace existing hydrological observing programmes, but<br />
supplements them. An important product of WHYCOS is regional datasets that are of<br />
consistent quality and can be used in preparing products for water resources assessment<br />
and management. In its initial phase, WHYCOS has focused on establishing components<br />
in international river basins, in the catchment areas of enclosed seas, and in regions of<br />
Africa that are poorly served by hydrological information<br />
By providing a framework of common guidelines and standards, WHYCOS<br />
enables the use of information from the regional HYCOSs for larger scale applications,<br />
such as research into the global hydrological cycle. Hence, WHYCOS can make an<br />
important contribution to the work of other WMO and international scientific<br />
programmes which require water-related information.<br />
6.7.4 Working of WHYCOS<br />
WHYCOS consists of a number of regional components, each of which is<br />
independently implemented and responsive to local needs. Each component is launched<br />
when the countries concerned have expressed their collective desire for such a<br />
development and their commitment to making it a success.<br />
Implementation at a regional scale enables each HYCOS to establish institutional<br />
and financial arrangements that are appropriate to the region. It also allows each HYCOS<br />
to select activities and procedures and design products which are specific to the<br />
hydrological characteristics of the region and also meet the particular needs of the region,<br />
the participating countries and their hydrological services, and the end users.<br />
Key steps in establishing a regional WHYCOS include:<br />
• Reaching agreement among participating countries to proceed with<br />
establishing a HYCOS. This is an essential first step, to ensure that there is joint<br />
commitment to the concept, and that the system will be maintained into the future.<br />
• Defining the needs that are to be met. In general, these include the information<br />
required to underpin sustainable economic and social development in the<br />
participating countries, specific needs for capacity building in their hydrological<br />
services, and the needs of the international community for hydrological data to<br />
121
Technical report of project (GT/1010-00-04)<br />
support global water resources assessment and hydrological/environmental<br />
science. An Information Infrastructure Directory provides contact information on<br />
the HYCOS participants, collaborators and end users.<br />
• Installing a real-time data collection and transmission system. This system<br />
consists of observing stations equipped with Data Collection Platforms (DCPs),<br />
transmitting data via satellites, the GTS and the Internet, and includes national<br />
and regional data receiving centers. The DCPs incorporate multiple sensors to<br />
capture up to 16 variables, which describe the state of the local water resource and<br />
weather conditions. The observing stations are nationally and regionally important<br />
benchmark sites, most of which already exist, but require upgrading.<br />
• Upgrading national data processing and archiving systems. Implementation of<br />
a HYCOS provides a vehicle for installing new equipment for archiving and<br />
retrieving data, introducing refined data processing and quality assurance<br />
procedures, and providing appropriate staff training. Existing facilities are used as<br />
a starting point, but are strengthened and extended as necessary.<br />
• Establishing distributed regional databases. These are designed to provide data<br />
of defined and consistent quality, which are regularly updated and available to<br />
users in a timely manner. The existence of distributed regional databases provides<br />
support for individual countries, and provides opportunities for more efficient<br />
handling of information about shared water bodies.<br />
• Establishing a regional telecommunication network. This is designed to<br />
exchange messages, verify data and information via e-mail and electronic file, and<br />
document transmission. The network encourages collaboration between<br />
governments, hydrological services, and other operational or research<br />
organizations.<br />
• Preparing and disseminating hydrological information of national and<br />
regional interest. A wide range of information products, which meet specific<br />
user needs, can be prepared from the data provided by the observing system. This<br />
includes forecasts, hydrological statistics, information on trends on the state of the<br />
water resource, or "yearbooks" in electronic format. Products are designed to meet<br />
specific needs of users and are widely disseminated via the regional<br />
telecommunication network as well as other more traditional methods.<br />
• Staff training. Training in the use of the newly introduced technology is<br />
essential, but the opportunity can also be taken to provide refresher training in<br />
more conventional hydrological skills, as well as in non-technical areas such as<br />
administration, public relations, marketing and customer service.<br />
• Performance monitoring and follow-up. Careful monitoring of performance<br />
against defined objectives will be maintained, to avoid the difficulties that in the<br />
past have been so common in capacity-building programmes. This will provide<br />
the ability to identify impediments to successful implementation and their<br />
removal, thus assuring long-term sustainability.<br />
6.7.5 WHYCOS, other observing systems and data exchange<br />
The international community has established several global observing systems<br />
and scientific programmes, the aim of which are to monitor the state of the global<br />
environment, detect changes, and provide the scientific knowledge required to develop<br />
122
Technical report of project (GT/1010-00-04)<br />
appropriate response strategies. These systems include the Global Climate Observing<br />
System (GCOS), the Global Terrestrial Observing System (GTOS), the Global Oceanic<br />
Observing System (GOOS), and the Global Environment Monitoring System (GEMS).<br />
At present there is no common mechanism for the exchange of water-related<br />
observations. Hence, it is not possible to integrate and make efficient use of all the<br />
observations that are presently made. WHYCOS will contribute to a solution by<br />
providing a single, easily accessed source of information on selected hydrological<br />
information of global significance. A major contribution of WHYCOS will be to provide<br />
a means of incorporating information about the global water cycle into efforts to<br />
understand the global environment.<br />
A key element for promoting data exchange and scientific cooperation is the<br />
establishment, using Internet and other modern data transmission technologies, of a<br />
"global hydrological information system." It will provide a medium for easy, fast<br />
dissemination and exchange of water-related data and information, which has become a<br />
prerequisite for efficient and cost-effective operational hydrology. The "global<br />
hydrological information system" will be coordinated with existing information networks<br />
and databases at national, regional and global levels. In addition to meeting the needs of<br />
national and regional users, the global system will enable the exchange of information<br />
with databases maintained under the family of Global Observing Systems (GOSs).<br />
Participating Hydrological Services will establish sites on the World Wide Web to<br />
enable easy access to selected information. Raw data will be available in near-real time,<br />
although the service responsible for each monitoring station will subsequently carry out<br />
data quality assurance, according to WHYCOS criteria of data standards and timeliness.<br />
Derived products, such as maps of specific runoff, may be subject to cost recovery, to<br />
generate revenue for the hydrological services.<br />
To ensure that WHYCOS data and products meet the requirements of the end<br />
users, the global system and sites on the World Wide Web will be used for discussing<br />
results, obtaining feedback, expressing needs, and sharing ideas and views. Electronic<br />
communication will be supplemented by face-to-face meetings for purposes such as finetuning<br />
programme outputs to meet the precise needs of end users.<br />
The worldwide WHYCOS network will initially consist of about 1000 benchmark<br />
stations sited on major or critical rivers, lakes and reservoirs. The participating countries,<br />
from among existing stations that might be readily upgraded to a common WHYCOS<br />
technical standard, will propose stations. Criteria for selection of stations will depend on<br />
the following criteria:<br />
• Availability of a long historical record<br />
• A stable water level-discharge relationship<br />
• Regional significance<br />
Stations will normally capture a minimum set of observations:<br />
• Water level/flow<br />
• Precipitation<br />
• Temperature<br />
• Humidity<br />
Other variables required to estimate potential evapotranspiration and to describe the<br />
physical and chemical characteristics of the water would also be measured at many<br />
123
Technical report of project (GT/1010-00-04)<br />
locations. The stations will be equipped with Data Collection Platforms, which transmit<br />
via meteorological satellites (METEOSAT, GOES, etc.) and the Global<br />
Telecommunication System of WMO, to Data Receiving Stations located at regional and<br />
national centers.<br />
6.7.6 Regional databases<br />
The WHYCOS regional databases will be distributed databases, with operational<br />
centers at national and regional levels (Regional Pilot Centers) linked using flexible,<br />
easy-to-use communication networks. The databases will be fed in real time by the<br />
stations connected via satellite or other data transmission networks and at regular<br />
intervals by hydrological services with data from observing stations not linked to the<br />
transmission networks. Selected data will also be conveyed to the Global Runoff Data<br />
Center, adding to its global archive.<br />
Fig. 6.7-2 Global Precipitation Gauges (Source: WHYCOS, 2001)<br />
124
Technical report of project (GT/1010-00-04)<br />
Fig. 6.7-3 shows about 200,000 routinely operating recording precipitation gauges around<br />
the world during the last 4 decades (Source: WHYCOS, 2001)<br />
The databases will support:<br />
• Monitoring operation of the regional network of benchmark stations<br />
• Disseminating data to end users at national, regional and global levels<br />
• Preparing products for regional water resources assessment and drought<br />
• Management, flood forecasting and reservoir operation<br />
Fig.6.7-2 shows the density of precipitation gauges throughout the globe and Fig.<br />
6.7-3 shows about 200,000 routinely operating recording precipitation gauges around the<br />
world during the last 4 decades. The density of gauges is quite variable, and it relates<br />
quite well to the population density.<br />
6.8 The Global Climate Observing System<br />
Another major component of WMO's climate agenda is the Global Climate<br />
Observing System (GCOS). GCOS was established in 1992 to ensure that the<br />
observations and information needed to address climate-related issues are obtained and<br />
made available to all potential users. It is cosponsored by the WMO, the<br />
Intergovernmental Oceanographic Commission (IOC) of UNESCO, the United Nations<br />
Environment Programme (<strong>UNEP</strong>) and the International Council for Science (ICSU).<br />
GCOS is intended to provide the comprehensive observations required for monitoring the<br />
climate system, for detecting and attributing climate change, for assessing the impacts of<br />
125
Technical report of project (GT/1010-00-04)<br />
climate variability and change, and for supporting research toward improved<br />
understanding, modeling and prediction of the climate system.<br />
6.9 Global Atmospheric Watch (GAW)<br />
Set up in 1989, the WMO's Global Atmospheric Watch integrates the many<br />
individual monitoring and research activities involving the measurement of atmospheric<br />
composition, and serves as an early warning system to detect further changes in<br />
atmospheric concentrations of greenhouse gases, changes in the ozone layer and in the<br />
long-range transport of pollutants. As part of this program, WMO issues regular bulletins<br />
on the state of the ozone layer over the Antarctic.<br />
The AFWS web site is a cooperative effort managed by the IFLOWS Program of<br />
the National Weather Service. Information and products available at this site are from<br />
many sources, and in many cases collected from or through systems beyond the control<br />
of the NWS or any individual cooperator. The availability and accuracy of weather data<br />
via Internet and this site therefore cannot be assured. The rain gage data/Web Site<br />
Trouble Page of this site lists contact points for some of the specific systems contributing<br />
information to the site.<br />
6.10 Foreign assistant in Central America as an example<br />
6.10.1 Early Warning Preparedness<br />
Recognizing that Central America has limited severe weather warning and<br />
forecast services, NOAA has helped to create the infrastructure necessary to improve<br />
forecasts and early storm warnings through disaster preparedness and response.<br />
Key elements include:<br />
• Replaced damaged and expanded automatic meteorological and hydrological<br />
stations.<br />
• Reestablished upper air station in Honduras critical for hurricane forecasting.<br />
• Provided automated precipitation gauges for real-time data.<br />
• Improved capabilities to receive and interpret satellite imagery for the region.<br />
• Established a regional, seasonal climate prediction system.<br />
• Provided a satellite ground station that brings high-resolution digital imagery<br />
from NOAA's Geostationary Operational Environmental Satellites (GOES).<br />
• In cooperation with USGS, rebuilt tools to measure water levels, tides and<br />
geodetic positioning networks.<br />
• NOAA and USGS provided technology for state-of-the-art river and flood<br />
forecast systems.<br />
6.10.2 Coastal Assistance as an example<br />
NOAA also advised on regional watershed management and assisted in building<br />
more sustainable and resilient coastal communities. NOAA's environmental scientists are<br />
improving coastal management in the region to lessen the impacts of future weather<br />
disasters and improve response capabilities.<br />
126
Technical report of project (GT/1010-00-04)<br />
This includes:<br />
• Improving capabilities along coasts to cope with impacts of hurricanes.<br />
• Installing tide gauge networks.<br />
• Rebuilding the aquaculture shrimp industry and providing more information on<br />
water circulation and contaminant levels in the Gulf of Fonseca - an important<br />
bay on the Pacific coast.<br />
Traditionally, environmental information such as that required for hydrological<br />
applications has been provided by optical remote sensing; however, it was often<br />
hampered by time-of-day or weather constraints. In addition, the restricted penetration of<br />
optical wavelengths into a volume, such as a vegetative canopy or soil, limited the<br />
amount of information on hydrological conditions that could be derived from an image.<br />
Because SAR is an active microwave system, it has day and night data imaging<br />
capabilities, and the low frequencies (relative to optical systems) allow for data<br />
acquisition in fog and light rain. It is particularly well suited to hydrological applications<br />
due to the sensitivity of microwave energy to the presence of water. Radar also provides<br />
greater penetration into vegetation, soil or snowpack, thus allowing surface and<br />
subsurface information to be acquired.<br />
Field studies for hydrological applications are able to provide hydrological<br />
information at discrete points; however, these data are limited because the phenomenon<br />
being measured (e.g., soil moisture, flood extent) is highly variable over space and time,<br />
and there are difficulties in timing field data collections with dynamic events such as<br />
floods. Radar remote sensing can provide the near real time and synoptic view necessary<br />
to map hydrological features on a regional scale, and may also provide validations or<br />
supporting information for field data collection.<br />
When radar data is acquired for quantitative hydrological study or any other<br />
application, it is important that data is calibrated as it allows image brightness values to<br />
be more directly related to target backscatter. When radar data is acquired over longer<br />
periods for the purpose of monitoring change for hydrological applications, it is again<br />
important that data is calibrated. Image calibration for change detection ensures that any<br />
change in the image is a result of a change in the target and not from a change in the<br />
sensor.<br />
The hydrological applications of radar remote sensing that are of importance to<br />
water resources management include watershed modeling, flood mapping and fresh water<br />
ice mapping. The use of radar for watershed modeling involves many activities including<br />
soil moisture estimation, mapping of land cover, and determining wetland and snowpack<br />
conditions. Information acquired from these activities is input into models to predict the<br />
hydrological characteristics of a watershed. This in turn provides an estimate of the<br />
availability of free water for such activities as hydroelectricity production and crop<br />
irrigation.<br />
The measurement of soil moisture aids in the prediction of crop yield, plant stress<br />
and watershed runoff (Brown et al. 1993). The measurement of soil moisture by C-band<br />
radar is possible due to changes in the dielectric properties of materials produced by<br />
changes in water content.<br />
Land cover information provided by radar is an important input to watershed<br />
modeling as land cover determines in part the amount of free water available for runoff.<br />
127
Technical report of project (GT/1010-00-04)<br />
Stream flow predictions can thus be made to determine water availability for other uses.<br />
Land cover information using radar is valuable because of the differences in radar<br />
response to variations in geometric structure and moisture content associated with<br />
different land cover types.<br />
Wetland condition determination is imperative to watershed modeling as wetlands<br />
provide vital clues to the state and availability of hydrological resources within a<br />
watershed. Mapping wetland boundaries is possible using radar because of its sensitivity<br />
to changes in the dielectric constant at the wetland boundary. In many areas of the world,<br />
the majority of fresh water available for consumption and irrigation results from<br />
snowpack runoff. Snow wetness, snow-water equivalent and aerial extent of the snow<br />
cover are the most important parameters in predicting total runoff. Mapping the extent of<br />
wet snow is possible using SAR data (Rott et al. 1988); wet snow produces a low radar<br />
return in contrast to dry snow that is essentially transparent at C-band.<br />
Fresh water ice mapping using radar is an effective tool for the evaluation of ice<br />
conditions in rivers and lakes for flood prediction. The buildup of ice may prevent the<br />
normal flow of water that produces flooded conditions. Information provided from fresh<br />
water ice mapping helps in the implementation of preventative measures and evacuation<br />
procedures. Radar is capable of fresh water ice mapping due to volume and surface<br />
scattering from ice that has significant contrasts with the specular reflection from open<br />
water.<br />
7 Study areas and database development<br />
Most watersheds of the major rivers in the world are important to all living beings<br />
because they contain some of the most productive ecosystems. They provide valuable<br />
resources and contribute significantly to a country’s economy by providing employment,<br />
economic resources, and waterways for navigation and transportation of goods. Also the<br />
environment of these watersheds supports pristine habitats that include human life,<br />
wildlife and vegetation with high biological diversity.<br />
Floods remain one of the most frequent and devastating natural hazards<br />
worldwide. In recent years the frequency of abnormal floods in Bangladesh, China and<br />
India has increased substantially, causing serious damage to lives and property. Unusual<br />
or above normal surface-water flow that inundates otherwise high ground is called a<br />
flood. Riverine floods occur when the amount of water flowing in a drainage basin or<br />
watershed (the area that collects and directs the surface water into the streams) exceeds<br />
the carrying capacity of rivers that drain the area. Flooding can occur due to river<br />
overflow or surface runoff. Flooding propensity in an area can vary greatly with a change<br />
in the water carrying capacity of a drainage basin or with a change in land elevation with<br />
respect to the basin level (the depth to which a river can cause erosion) of rivers – the<br />
ocean.<br />
7.1 Survey of study areas<br />
7.1.1 Selection of the study areas<br />
In the recent past, numerous flood incidences took place throughout the globe.<br />
Such incidences are very common and frequent in the Asian region, due to unpredictable<br />
weather events. It is believed that the frequency of such incidences is increasing due to<br />
128
Technical report of project (GT/1010-00-04)<br />
global climatic change. Most of the Asian countries (including India, Indonesia, China,<br />
Bangladesh, Pakistan, Vietnam, and Malaysia), where nearly half of the world’s<br />
population lives, are prone to unpredictable weather events and natural disasters. These<br />
events are a major threat to life and property. Due to high population density along the<br />
rivers, especially in Asian countries such as Bangladesh, China and India, floods create<br />
huge loss of lives and property every year. For example, a consequence of the flooding<br />
occurring in Asia in 1991 was a final death toll surpassing 139,000 in Bangladesh alone.<br />
The Yangtze and Ganges/Brahmaputra River basins are the largest basins in Asia and the<br />
most heavily populated. Both are highly susceptible to large scale, disastrous flooding.<br />
7.1.2 Basic information of the study areas<br />
Ganges/Brahmaputra basin (India and Bangladesh)<br />
The Ganges and Brahmaputra are two of the world's greatest rivers. The Ganges’<br />
wide valley stretches across northern India and Bangladesh from the Himalayas to the<br />
Bay of Bengal. It is one of the most fertile of all agricultural regions. Its rice and other<br />
crops feed most of India and Bangladesh. The Padma River crosses the meeting point of<br />
the River Ganges and Brahmaputra. The river is also an important trade artery.<br />
Millions of Hindus venerate the Ganges as a "life-giving river" because their<br />
crops depend on its waters. To them the Ganges is sacred. They call it Gangamai,<br />
meaning "Mother Ganges." They believe that bathing in its waters washes away sin. To<br />
die on its banks assures eternal peace to the soul.<br />
The Ganges is about 1,557 miles (2,506 kilometers) long. The Ganges Valley, or<br />
basin, is 200 to 400 miles (322 to 644 kilometers) wide. The total drainage basin covers<br />
an area of about 376,800 square miles (975,900 square kilometers). The river starts in an<br />
ice cave on the southern slopes of the Himalayas, some 10,300 feet (3,140 meters) above<br />
sea level.<br />
129
Technical report of project (GT/1010-00-04)<br />
Fig. 7.1-1 The Maha Kumbh Mela (great urn fair) is the greatest festival in the Hindu<br />
religious calendar -- a holy gathering at the confluence of India's Ganges and Yamuna<br />
rivers. Lasting 42 days, it is held every 12 years and brings together the faithful from<br />
across all India -- businessmen, priests, farmers, and widows. It is rotated among four<br />
sites where a God on his way to heaven is believed to have accidentally spilled an urn<br />
containing the nectar of eternal life (Source: Robert Nickelsberg/Liaison for TIME)<br />
The headwater of the Ganges in the Himalayas is called Bhagirathi. The Ganges<br />
breaks out of the foothills at Hardwar and is joined by many small tributaries. Midway in<br />
its course, near Allahabad, it is joined by its chief tributary, the Yamuna (Jumna) River.<br />
The Hooghly River, an old channel of the Ganges, joins it at the delta.<br />
Between the Ganges and the Yamuna is a doab, meaning "land between rivers.”<br />
It is irrigated by two large canal systems supplied by the snow-fed Ganges. Rainfall in the<br />
valley ranges from 80 inches (203 centimeters) a year at the delta to about 25 inches (63<br />
centimeters) in the Upper Ganges. The water supply of the Ganges system is dependent<br />
partly on the rains brought by the monsoon winds from July to October. Melting<br />
Himalayan snows in the hot season, from April to June, also contribute to the supply.<br />
The Ganges Valley is one of the most thickly populated agricultural regions in the<br />
world. Within the basin’s 750,000 square kilometers (km 2 ) live 400 million people. Most<br />
of the original natural vegetation and wild animals have disappeared, and the land is now<br />
heavily cultivated to meet the needs of a rapidly growing population.<br />
Use of water for irrigation, either when the Ganges floods or by means of gravity<br />
canals, has been common since early times. Irrigation has increased the production of<br />
such food and cash crops as wheat, sugarcane, cotton, and oilseeds in the states of Uttar<br />
Pradesh and Bihar. River traffic is insignificant above the Middle Ganges basin around<br />
Allahabad, where railways serve the region, but the rural people of West Bengal and<br />
Bangladesh continue to rely on the waterway to transport their agricultural products.<br />
The Yamuna River flows to the west and south of the Ganges and joins almost<br />
halfway down its course. The Yamaha receives a number of rivers of central India. To the<br />
north of the Ganges, the large tributaries are Ramganga, Gomati, Ghagra, Gandak,<br />
Saptkosi, and the Mahananda. Beyond Mahananda the river enters its own delta, formed<br />
by its distributaries, and then merges into the combined delta of the Ganges,<br />
Brahmaputra, and Meghna Rivers.<br />
The Ganges River and its tributaries and distributaries flow through three<br />
countries: India, Nepal, and Bangladesh. The Ganges basin river system remains the main<br />
source of freshwater for half the population of India and Bangladesh and nearly the entire<br />
population of Nepal. The importance of the Ganges can hardly be exaggerated,<br />
particularly in its lower stretch, where it is the only river from which freshwater supplies<br />
are obtained for the distributaries (small rivers that distribute waters through a flood plain<br />
during peak flows). Freshwater is now a highly prized commodity. As the development<br />
of South Asia picks up momentum and populations increase, the Ganges River system<br />
rapidly increases its importance.<br />
The Lower Ganges basin contains both an active delta and a moribund delta, both<br />
of which are affected by enormous flood flows in the Ganges, relentless tidal pressures<br />
from the sea, and occasional severe cyclonic storms capable of disrupting environmental<br />
systems. The balance of environmental factors is extremely delicate and complicated, so<br />
130
Technical report of project (GT/1010-00-04)<br />
small changes in one factor affect all the others. The major environmental issues which<br />
are associated with population factors include: increasing demands on natural resources<br />
from development activities; the inward penetration of higher salinity levels; the spread<br />
of waterborne diseases due to the extensive embankment of former bodies of water; water<br />
and soil pollution; decline in fisheries due to human interventions; and the excessive<br />
felling of the Sunderbans forest.<br />
Bangladesh, being the downstream and deltaic portion of a huge watershed, is<br />
naturally vulnerable to the water quality and quantity that flows into it from upstream. All<br />
major rivers flowing through Bangladesh have their origins outside its borders; therefore<br />
any interventions in the upper riparian regions have a significant impact on Bangladesh.<br />
Through its complex network of river systems, Bangladesh drains roughly 1.76 million<br />
km 2 of catchment areas of the Ganges, Brahmaputra, and Meghna Rivers, even though<br />
only 7 percent of the water resources and population pressures in the Ganges River basin<br />
lie in Bangladesh. This physical characteristic severely limits the degree of control and<br />
management of the inflow water in the monsoon and dry season. The extreme variations<br />
of temporal and spatial occurrence of rainfall are a major constraint to the development of<br />
agriculture, which dominates the economy.<br />
The Brahmaputra River is an important waterway of southern Asia. This river<br />
rises on the northern slopes of the Himalayas in Tibet of China. After flowing 1,680<br />
miles (2,704 kilometers) through India and Bangladesh, this river joins the Ganges River<br />
and shares the Ganges Delta. The northern part of the river has many names, sometimes<br />
called Yarlung Zangbo in Tibet of China. It flows eastward and disappears into the Bay<br />
of Bengal forming a vast delta. At the delta the southward-flowing Brahmaputra River<br />
joins the Ganges. Their combined delta is the largest in the world. The delta begins more<br />
than 200 miles (322 kilometers) from the Bay of Bengal and lies mostly in Bangladesh. It<br />
is largely a tangled swampland.<br />
The Brahmaputra basin is a major river system, covering a drainage area of<br />
580,000 km 2 , of which 50.5 % lies in China, 33.6% in India, 8.1% in Bangladesh and<br />
7.8% in Bhutan. This basin represents a unique hydroclimatological and geo-biophysical<br />
setting characterized by a dominant monsoon rainfall regime, a relatively fragile geologic<br />
base, highly active seism city and an immensely rich biodiversity. The hydrologic regime<br />
of the Brahmaputra responds to the seasonal rhythm of the monsoon and freeze-thaw<br />
cycle of Himalayan snow in the backdrop of a unique geo-environmental framework. The<br />
river carries a mean annual flood discharge of 48,160 m 3 /sec at Pandu (India) where the<br />
highest recorded flood was 72,748 m 3 /sec (1963) with a recurrence interval of 100 years.<br />
The flow hydrograph of the river is marked by exceedingly high variability of discharge<br />
during the monsoon high flow season from June through September. The average annual<br />
rainfall in the basin is 230 cm with a marked variability in distribution over the<br />
catchment. Rainfall in the lower Himalayan region amounts to more than 500 cm per<br />
year, with higher elevations getting progressively lesser amounts. The excessive rainfall<br />
intensity occasionally causes flash floods, landslides, debris flow and erosion. Patterns of<br />
correlation of concurrent flows in different tributary rivers and among various stations on<br />
the mainstream have been examined. Few extreme climatic events recorded so far in the<br />
Eastern Himalayan are analyzed and their hydrological consequences mainly in regard to<br />
water-induced mountain disasters like floods and landslides are discussed. The changing<br />
land use (mainly deforestation) and development as well as population pressures in the<br />
131
Technical report of project (GT/1010-00-04)<br />
region and their hydrological implications are also highlighted with the help of selected<br />
illustrations. The impact of Himalayan neotectonics on the hydrologic regime of the<br />
Brahmaputra especially with regards to the 1897 and 1950 earthquakes (both of Richter<br />
magnitude 8.7) is discussed based on the analysis of observed hydrological data. The<br />
pattern of accumulation and depletion of snow and glacial cover in the Tista and Kameng<br />
sub-basins of the Brahmaputra is delineated using satellite remote sensing techniques and<br />
melt water runoff is estimated. Lack of sufficient and reliable hydrometeorological data<br />
and information shows the need for greater regional cooperation and international<br />
assistance. Strengthening of the hydro-meteorological monitoring network in the Eastern<br />
Himalayas especially with respect to the upper catchment of the Brahmaputra River and<br />
development of scientific and manpower base in the area of hydrological and climatic<br />
research are considered to be of prime importance for sustainable development of the<br />
immense water resources potential, preservation of its unique ecological wealth and for<br />
management of natural hazards.<br />
Although still a point of controversy, one of the causes of increased flooding in<br />
Bangladesh can be traced from Nepal and India (Assam), where the majority of the rivers<br />
originate. Massive deforestation of the mountainsides has significantly reduced the<br />
Himalayan’s capacity to absorb the monsoon rains, and has greatly increased the amount<br />
of eroded soil that is carried by floodwaters.<br />
Fig. 7.1-2 Map of the Ganges/Brahmaputra River basin<br />
132
Technical report of project (GT/1010-00-04)<br />
The physical geography of Bangladesh makes the country and its population<br />
extremely vulnerable to disastrous flooding. Bangladesh has more than 80% of its land in<br />
the floodplain of the Ganges, Brahamputra and other rivers. With an area of only<br />
144,000 km 2 and a population of 118 million, about 832 persons per km 2 , it is one of the<br />
most densely populated countries in the world (UNDP, 1995). In this semi-tropical,<br />
predominantly rural country, roughly 48 percent of the rural population and 44 percent of<br />
the urban population live below the poverty line (BBS, 1995). Per capita gross national<br />
product in 1991 was US$ 220. Households spend 59 percent of their income on food, and<br />
60 percent of children under 5 years of age are malnourished.<br />
The Lower Ganges basin comes under the jurisdiction of the greater districts of<br />
Kushtia, Jessore, Faridpur, Khulna, Barisal, and Patuakhali. It comprises an area of<br />
approximately 40,450 km 2 , or 27 percent of Bangladesh's total area. It is bordered by<br />
India to the west, by the Ganges (Padma) and Lower Meghna rivers to the north and east,<br />
and by the Bay of Bengal to the south. Sixty-two percent of the region is cultivated.<br />
Roughly 10 percent, or 4,000 km 2 , is covered with a coastal mangrove forest known as<br />
the Sunderbans. Surface water areas, including rivers and natural land depressions known<br />
as beels, cover approximately 13 percent of the country. The northern part of the area is<br />
comparatively high to medium-high land with a rolling topography. Further south, the<br />
topography starts off as gently sloping but soon becomes very flat. This southern part has<br />
a large number of beels and low-lying areas. In addition, the coastal areas, which include<br />
the Sunderbans, are criss-crossed by a number of tidal rivers and creeks.<br />
The area has a typical monsoon climate with a warm and dry season from March<br />
to May, followed by a rainy season from June to October and winter period from<br />
November to February. The mean annual rainfall is 2,000 millimeters (mm), of which<br />
approximately 70 percent occurs during the monsoon season. Rainfall generally varies<br />
from northwest to southeast, increasing from a mean annual rainfall of 1,500 mm in the<br />
northeast to 2,900 mm in the southeastern corner. Potential evapotranspiration rates are<br />
approximately 1,500 mm and exceed rainfall rates from November to May. The relative<br />
humidity is high, varying from 70 percent in March to 89 percent in July. The area<br />
experiences moderate to high duration of sunshine hours, and durations in excess of 8.5<br />
hours outside the monsoon season. The mean annual temperature is 26 o Celsius (C) with<br />
peaks of over 30 o C in May. Winter temperatures can fall to 10 o C in January.<br />
The southern region of the area and in particular the southeastern coastline is<br />
vulnerable to cyclones during the monsoon season. Storm surges can cause dramatic<br />
increases in the water level of up to 4 meters above tide and seasonal levels. The<br />
southwest coastline is protected to some extent by the dampening effects of the<br />
Sunderbans, although surges do progress up the major rivers.<br />
The coastal zone consists of the extensive flat, coastal and deltaic land of the<br />
Ganges Delta, which is crossed by large tidal rivers discharging into the Bay of Bengal.<br />
The Lower Ganges basin coastal zone is in a state of transition. It is changing from an<br />
actively developing delta of the Ganges to a semi-moribund delta partially sustained by<br />
local rivers.<br />
The coastal area is subjected to coastal processes, which include tides causing<br />
periodic variations in water levels and currents, consequential saline intrusion, wave<br />
attack on the coastal fringe, surges and extreme wave attacks due to cyclones, and<br />
possible long-term sea-level rise due to global warming.<br />
133
Technical report of project (GT/1010-00-04)<br />
As a consequence of the flat topography, coastal processes have a major impact<br />
on the freshwater resources of the area. Tidal propagation into the delta system carries<br />
saline water inland, which mixes with the fresh water to create different levels of salinity<br />
in the river system, depending on the upland freshwater discharges.<br />
The western half of the Ganges delta contains the Sunderbans, which is the largest<br />
single block of natural mangrove forest in the world. It covers 5,892 km 2 , and contains a<br />
continuing, dynamic, and changing mosaic of plant communities. The Sunderbans house<br />
many species of flora and fauna, and part of it is being considered as a World Heritage<br />
Site. At present, the Sunderbans are under considerable threat, which may be attributed to<br />
the reduction in the freshwater flushing action caused by upstream extraction at the<br />
Farakka barrage, increasing shrimp cultivation, over-exploitation of wood resources,<br />
increased agriculture, and increased silt deposits.<br />
Yangtze basin (China)<br />
The Yangtze River or Chang Jiang, the longest river of Asia and the third longest<br />
of the world, in China, is about 6300 km (about 3,937 mi) in length. It rises in the Kunlun<br />
Mountains in the southwestern section of Qinghai Province, and flows generally south<br />
through Sichuan Province into Yunnan Province, where, in the vicinity of Huize, it bends<br />
sharply to the northeast. Then, it flows generally northeast and east across central China<br />
through Sichuan, Hubei, Anhui, and Jiangsu Provinces to its mouth in the East China Sea,<br />
about 23 km (about 14 mi) north of Shanghai.<br />
The headwaters of the Yangtze start at an elevation of about 4900 m (about<br />
16,000 ft). In its descent to sea level, the river falls to an altitude of 305 m (1000 ft) at<br />
Yibin, Sichuan Province, the head of navigation for riverboats, and to 192 m (630 ft) at<br />
Chongqing. Between Chongqing and Yichang (I-ch'ang), at an altitude of 40 m (130 ft)<br />
and a distance of about 320 km (about 200 mi), it passes through the spectacular Yangtze<br />
Gorges, which are noted for their natural beauty but are dangerous to shipping. Yichang,<br />
1600 km (1000 mi) from the sea, is the head of navigation for river steamers; ocean<br />
vessels may navigate the river to Hankou (Hankow), a distance of almost 1000 km<br />
(almost 600 mi) from the sea. For about 320 km (about 200 mi) inland from its mouth,<br />
the river is virtually at sea level.<br />
More than 1,683,500 sq km (650,000 sq mi) of territory is drained by the Yangtze<br />
and its branches. The principal tributaries are the Han, Yalong, Jialing, Min, and Tuo He<br />
(T'o Ho), on the north; on the south, the Wu; at Zhenjiang, the Grand Canal links the<br />
Yangtze to the Huang He (Huang Ho). During periods of heavy rains, Lakes Dongting<br />
and Poyang receive some of the overflow of the Yangtze. Despite these outlets, floods<br />
caused by the river occasionally have caused great destruction of life and property. In the<br />
20 th century, devastating floods occurred in 1905, 1980, and 1981.<br />
134
Technical report of project (GT/1010-00-04)<br />
Fig. 7.1-3 Image of Three Gorges of Yangtze river in China (Source: RSI, 2001)<br />
With numerous tributaries and feeders, the Yangtze River provides a great<br />
transportation network through the heart of some of the most densely populated and<br />
economically important areas in China. Among the principal cities on the Yangtze, in<br />
addition to those cited in the foregoing, are Wuchang, Nanjing, Hanyang, and Anqing<br />
(An-ch'ing). Jiangsu Province, largely a deltaic plain consisting of silt deposited by the<br />
Yangtze river (more than 170 million cu m/6 billion cu ft annually), is one of the chief<br />
rice-growing areas of China.<br />
While the entire river (jiang) is known as the Yangtze, the Chinese apply that<br />
designation only to the last 480 or 645 km (300 or 400 mi) of its course, the portion<br />
traversing the region identified with the Yang kingdom (which flourished about 10th<br />
century BC).<br />
From, its upper reaches to Yibin, the river is known as Jinsha (Chin-sha), or<br />
“Golden Sand,” and various other names are applied in the provinces it traverses. The<br />
official name for the entire river is Chang Jiang, or “Long River.” The Yangtze River<br />
basin is an important agricultural and industrial production base to China’s economy. It<br />
contains about 1/4 of the farmland of China, which supports over 358 million people,<br />
supplies 36.3% of the total crops, 23.5% of the total cotton and 33% of the total vegetable<br />
oil to the country, and contributes 49.5% of total Chinese GDP. The Yangtze River is a<br />
flooding river. Historically, there were 214 floods during the Han Dynasty (185 B.C.) to<br />
the Qing Dynasty (1911 A.C). There were 14 big floods from 1921-2000.<br />
135
Technical report of project (GT/1010-00-04)<br />
Fig. 7.1-4 The map of the Yangtze River basin, China<br />
7.2 Database development<br />
Several data sets including information available on the Internet have been<br />
obtained. GIS data sets have been compiled for the Ganges River basin covering a part of<br />
India and Bangladesh, and for the Yangtze River basin in China.<br />
7.2.1 <strong>UNEP</strong>/<strong>GRID</strong> database<br />
In an information-based society, both spatial and non-spatial data and information<br />
are critical to decision making. This section describes the efforts of <strong>UNEP</strong>/<strong>GRID</strong> in<br />
developing georeferenced database concerning flood risk monitoring and early warning.<br />
In general, database efforts followed two tracks. One was the compilation of<br />
existing digital data for the two river basins. The other was the creation, often involving<br />
previously uncompiled data, of very specific data and analysis for the floodplains.<br />
7.2.2 The spatial dimension of information<br />
Many definitions of GIS have been written (Maguire, 1991). Most definitions fall<br />
into one of three overlapping categories: 1) map, 2) database, and 3) spatial analysis.<br />
Because of the spatial extent, complexity, and potential variety of uses, the <strong>UNEP</strong>/<strong>GRID</strong><br />
GIS fits into each of the defining categories. First, it is a method of digitally storing<br />
geographic data and producing useful map products from those data. Second, it is a large<br />
136
Technical report of project (GT/1010-00-04)<br />
database and database management system that contains both spatial and non-spatial data<br />
of value to management decision makers and scientific analysts alike. Third, it is<br />
designed to enable analysis. The analysis conducted has already provided valuable<br />
information for policy and management decision-making.<br />
Two basic spatial data structures are used in a GIS database: vector and raster. A<br />
vector structure stores data or features as points, lines, or polygons that are defined by a<br />
set of Cartesian coordinates. Each feature in a vector layer can have many attributes<br />
associated with it – a vegetation layer may have attributes for dominant species, crown<br />
height, canopy cover, and so on. A raster structure stores data as a regular array of cells,<br />
such as in satellite image data, or in generalized data that could be obtained by laying a<br />
grid over the landscape. Typically, single theme data in a single raster cell, or pixel, are<br />
given a single value.<br />
In this report, the term 'coverage' refers to a raster or vector-based GIS data set<br />
that corresponds to a single theme, or layer. It is the principal storage unit for the<br />
<strong>UNEP</strong>/<strong>GRID</strong> database. Spatial data can be tied to a location; geospatial data can be tied<br />
to a location on, in, or above the Earth.<br />
Relational databases, such as spreadsheets or time-series, often can be tied to a<br />
point, line, or an area, and thus become attributes of the GIS coverage. Time-series data<br />
are important because they provide an opportunity to relate changes in one phenomenon<br />
to changes in another, offering insights to causal relationships, trends, and event<br />
frequency that could not be identified or interpreted any other way.<br />
7.2.3 Development of digital data<br />
Since the inception of <strong>UNEP</strong>/<strong>GRID</strong> in 1985, efforts have been made to develop a<br />
list of data sets that are critical for assessing impacts of the environment and provide<br />
early warning information. This list was refined with the time and as the database was<br />
built. Some of the global data sets have been relatively easy to obtain, such as NOAA<br />
AVHRR derived satellite data, Topographic data, Landsat Thematic Mapper (TM)<br />
satellite data and global population data, because their existence is widely known and<br />
there is an established, accessible distribution mechanism. Other data sets are more<br />
difficult to obtain because no clearinghouse or defined point of contact existed for<br />
information about the data. Generally, most organizations are cooperative within the<br />
limitations of their resources.<br />
<strong>UNEP</strong>/<strong>GRID</strong> built its database for this project by 1) obtaining existing digital<br />
data, 2) converting existing data from one form to another; 3) automating data from paper<br />
documents or maps, 4) interpreting original source data to form analytic data sets, and 5)<br />
combining or analyzing existing data to form new data sets. Data were compiled from a<br />
number of sources, at a variety of scales, and in many formats that are designed for<br />
widely different purposes. The principal coverage and the ones that are close to final<br />
form are discussed here.<br />
Asian administrative boundaries and population datasets<br />
Developing Asian administrative boundaries and population databases is part of<br />
an ongoing effort to improve global, spatially referenced demographic data holdings.<br />
Such databases are useful for a variety of applications including strategic-level<br />
137
Technical report of project (GT/1010-00-04)<br />
environmental assessment research and applications in the analysis of the human<br />
dimensions of global change.<br />
While the private sector is addressing some of this need for spatial data by<br />
marketing georeferenced demographic databases for developed and some large<br />
developing countries (e.g., India), administrative boundaries and population figures for<br />
many countries are still hard to obtain. The project has pooled available data sets, many<br />
of which have been assembled for the global demography project. All data were checked,<br />
international boundaries and coastlines were replaced with a standard template, the<br />
attribute database was redesigned, and new, more reliable population estimates for subnational<br />
units were produced for all countries. From the resulting data sets, raster surfaces<br />
representing population distribution and population density were created.<br />
a. Discussion of data sources<br />
The Asian administrative boundaries and population database was compiled from<br />
a large number of heterogeneous sources. The objective was to compile a comprehensive<br />
database from existing data in a fairly short time period that is suitable for regional or<br />
continental scale applications. The resources available did not allow for in-country data<br />
collection or collaboration with national census bureaus. With few exceptions, the data do<br />
not originate from the countries, and none of the input boundary data have been officially<br />
checked or endorsed by the national statistical agencies.<br />
b. Population data<br />
With few exceptions, official census figures or official estimates were used, taken<br />
from national publications (census reports or statistical yearbooks) or from secondary<br />
data sources (yearbooks and gazetteers). The specific sources are indicated for each<br />
country below. The accuracy of censuses obviously varies by country. It was beyond the<br />
scope of this project to evaluate the accuracy of every census used, or of any of the<br />
official estimates. This would be possible since most censuses are followed by a postcensus<br />
enumeration that provides an accuracy estimate. In countries with functioning<br />
registration systems, population figures reach accuracy within a fraction of a percent. In<br />
the US, census counts have been shown to have an accuracy of about 2 percent. With few<br />
exceptions, the accuracy of Asian censuses is likely to be considerably lower.<br />
Since census is irregular in many countries, the data for some countries are quite<br />
old. For several nations data from the early 1980s is the only available source of<br />
subnational population figures. The following figure shows the distribution of reference<br />
years in the database. For about 25% of the countries, the reference year is 1988 or<br />
earlier. It is important to note that this distribution and the average year (1990) are biased<br />
upward by those countries for which no sub-national data were available, in which case<br />
the 1995 UN figures were used.<br />
UN population figures were used in two additional cases: (1) for countries for<br />
which no sub-national boundaries or data are available (e.g., Singapore, Bahrain,<br />
Lebanon), the 1995 population estimate from the UN Population Division was used; (2)<br />
in countries for which census figures are available for only one point in time or for which<br />
the next to last census is too long ago, the average annual national growth rate between<br />
the census year and 1995 was applied to each administrative unit, as indicated in the UN<br />
138
Technical report of project (GT/1010-00-04)<br />
World Population Prospects, resulting in a uniform adjustment of population figures<br />
across the nation. In countries where large areas are uninhabitable, the mean resolution<br />
in km gives a biased impression of available detail. In such cases, the number of people<br />
per unit is a more meaningful indicator.<br />
Land cover data set<br />
The land cover database was derived from the IGBP land cover characteristics<br />
database developed through international cooperation with USGS EROS Data Center.<br />
Vegetation classifications and descriptions in the USGS land cover database are built on<br />
characteristics of vegetation seasonality determined in terms of 1992-93 NOAA AVHRR<br />
NDVI. In the database, unique NDVI signatures and associated attributes, such as terrain<br />
and eco-regions, characterize large-area land cover patterns. The magnitude of integrated<br />
NDVI over the length of the temporal period has helped to separate successively<br />
decreasing vegetation primary production, ranging from healthy, dense forestlands to<br />
open woodland, shrubs and grass, and sparse land cover. Additionally, seasonal<br />
variations were investigated to partially support identification of vegetation physiognomy<br />
(e.g., separating deciduous from evergreen forests). The use of both integrated NDVI<br />
and seasonal NDVI variations has been found helpful in applications such as monitoring<br />
large-area vegetation interannual variations (Reed et al. 1994) and mapping tropical<br />
deforestation and fragmentation (Skole and Tucker, 1993).<br />
To provide the least atmospherically affected result, the final percent forest cover<br />
is determined over the course of the year on the basis of maximum monthly forest cover<br />
value achieved, regardless of the methods chosen (mixture analysis or scaled NDVI).<br />
Using the estimated forest density and information about the two methods, a simple<br />
modeling process is developed to guide decisions on adapting the mixed seasonal classes<br />
(in terms of the FAO forest classes) from the first step.<br />
The modeling process determines the level of forest fragmentation if forest<br />
density is from the modified mixture analysis and separation of various types of forest<br />
and woodland from other land cover is based on results from the linear NDVI scaling.<br />
Because of varying ecological conditions within and between continents, flexible<br />
regional rules are developed according to reference data in determining forest density<br />
threshold values for the FAO forest classes.<br />
Political Boundaries Data<br />
Political Boundaries Data set for the country boundaries is the National Imagery<br />
and Mapping Agency's (NIMA) Vector Map Level 0 (VMAP0) series of CD-ROM. This<br />
data set provides, among other things, a 1995 version of the political boundaries of the<br />
world at 1:1,000,000 nominal scale. The political boundaries layers for this data set is<br />
stored using the Geographic coordinate reference system, and is divided into 4 regional<br />
CD-ROM. The input layers were read from the CD-ROM set in its VPF format using<br />
ArcVIEW. These data have been converted to ARC Shape files and then brought into<br />
ArcINFO for further editing. The Shape files have been converted to ArcINFO<br />
REGIONs regions, and into POLYGON coverages. The data are compared to the NIMA<br />
Digital Chart of the World (DCW) data set and found to be in error in several places.<br />
DCW linework was added to the VMAP0 data wherever it was found to be appropriate to<br />
correct and complete the VMAP0 data.<br />
139
Technical report of project (GT/1010-00-04)<br />
Attribute assignments have been verified and corrected as needed for the resulting<br />
polygon coverages, and the coverages have been joined to form world coverage. The<br />
world coverage was intersected with a polygon coverage denoting the 12 Goode's regions<br />
and 2 cap regions. (Note that regions here are Goode's regions, not ArcINFO<br />
REGIONS). Geographic areas in the 2 cap regions have been replicated and moved to<br />
extend beyond +/- 180 degrees, allowing for repetition of the features found in the cap<br />
regions. Attributes have been then assigned to the resulting regions. Each land area is<br />
represented by a numeric code for the country that it belongs. Disputed regions, regions<br />
of special administrative status, foreign holdings, and regions that appeared in the caps<br />
have been assigned incremented codes offset from the base numeric code for the country,<br />
allowing varying interpretations in defining statistics for a country.<br />
The features for each Goode's region have been projected to the Goode's<br />
component map projection for that region, and the data have been joined in the Goode's<br />
coordinate space. Countries have been aggregated from the polygon components, and the<br />
resulting political layer has been rasterized at 1 km resolution.<br />
Global Protected Areas<br />
The world's protected areas are the greatest legacy that can be left to future<br />
generations - to ensure that future descendants have access to nature and all the material<br />
and spiritual wealth that it represents. IUCN – the World Conservation Union, defines a<br />
protected area as: "an area of land and/or sea especially dedicated to the protection and<br />
maintenance of biological diversity, and of natural and associated cultural resources, and<br />
managed through legal or other affective means."<br />
IUCN categorizes protected areas by management objective and has identified six<br />
distinct categories of protected areas:<br />
• Strict Nature Reserve/Wilderness Area: protected area managed mainly for<br />
science of wilderness protection.<br />
• National Park: protected area managed mainly for ecosystem protection and<br />
recreation.<br />
• Natural Monument: protected area managed mainly for conservation of specific<br />
natural features.<br />
• Habitat/Species Management Area: protected area managed mainly for<br />
conservation through management intervention.<br />
• Protected Landscape/Seascape: protected area managed mainly for<br />
landscape/seascape protection and recreation.<br />
• Managed Resource Protected Area: protected area managed mainly for the<br />
sustainable use of natural ecosystems.<br />
Until the year 2000, the world's 30,000 protected areas covered over 13,250,000<br />
km 2 of the land surface of the world (roughly the size of India and China combined). A<br />
much smaller proportion of the world's seas (barely 1%) are protected. This represents a<br />
tremendous investment by the countries of the world to protect their biological diversity<br />
for future generations.<br />
Protected areas perform many functions. They are essential for conserving<br />
biodiversity, and for delivering vital ecosystem services, such as protecting watersheds<br />
and soils and shielding human communities from natural disasters. Many protected areas<br />
140
Technical report of project (GT/1010-00-04)<br />
are important to local communities, especially indigenous peoples who depend for their<br />
survival on a sustainable supply of resources from them. They are places for people to get<br />
a sense of peace in a busy world - places that invigorate human spirits and challenge the<br />
senses.<br />
Protected landscapes embody important cultural values; some of them reflect<br />
sustainable land use practices. They are important also for research and education, and<br />
contribute significantly to local and regional economies, most obviously from tourism.<br />
The importance of protected areas is recognized in the Convention on Biological<br />
Diversity (CBD). Article 8, for example, calls on contracting parties to develop systems<br />
of protected areas.<br />
Protected areas face many challenges, such as external threats associated with<br />
pollution and climate change, irresponsible tourism, infrastructure development and everincreasing<br />
demands for land and water resources. Moreover, many protected areas lack<br />
political support and have inadequate financial and other resources.<br />
There is only one body working world wide for the protection of these vitally<br />
important areas. This is the World Commission on Protected Areas (WCPA) - one of the<br />
six Commissions of the IUCN.<br />
The protected areas database is extracted from the 1997 CD-ROM title “A Global<br />
Overview of Forest Conservation” published by the <strong>UNEP</strong>- World Conservation<br />
Monitoring Center (WCMC)).<br />
Global 30 Arc-Second Elevation Data Set<br />
GTOPO30 is a global digital elevation model (DEM) with a horizontal grid<br />
spacing of 30 arc seconds (approximately 1 kilometer). GTOPO30 is derived from<br />
several raster and vector sources of topographic information. For easier distribution,<br />
GTOPO30 has been divided into tiles that can be selected from the map shown above.<br />
Detailed information on the characteristics of GTOPO30 including the data distribution<br />
format, the data sources, production methods, accuracy, and hints for users, is found in<br />
the GTOPO30 README file. GTOPO30, completed in late 1996, was developed over a<br />
three-year period through a collaborative effort led by staff at the USGS EROS Data<br />
Center (EDC). Numerous organizations participated by contributing funding or source<br />
data: the National Aeronautics and Space Administration (NASA), the United Nation<br />
Environment Programme/Global Resource Information Database (<strong>UNEP</strong>/<strong>GRID</strong>), the<br />
U.S. Agency for International Development (USAID), the Instituto Nacional de<br />
Estadistica Geografica e Informatica (INEGI) of Mexico, the Geographical Survey<br />
Institute (GSI) of Japan, Manaaki Whenua Landcare Research of New Zealand, and the<br />
Scientific Committee on Antarctic Research (SCAR).<br />
141
Technical report of project (GT/1010-00-04)<br />
Fig. 7.2-1 Flood in Bangladesh. ('Asian people in Britain are desperate to do what they can<br />
for the 30 million Bangladeshis whose lives have been torn apart by the worst floods in<br />
living memory.' Aziz-Ur Rahman, Vice-Chair of the Guild of Bangladeshi Restaurateurs.<br />
Source: Oxfam, 1998).<br />
FAO global soil data set<br />
The FEWS Flood Model requires data describing the average water holding<br />
capacity of the soils in millimeters, average hydrologic active soil depth in centimeters,<br />
textural description of the soil, average saturation soil hydraulic conductivity in meters<br />
per hour, average Soil Conservation Service curve numbers for the soils, maximum<br />
percentage of the watershed which can be impervious, and minimum percentage which<br />
can be impervious for each sub watershed that makes up the watershed being modeled.<br />
The FAO soils database at 1:5 million scale contains a great deal of information about the<br />
soils of the world.<br />
Climate Data<br />
Historical data on monthly temperature, precipitation, and evaporation for<br />
national climate divisions throughout the area can be obtained from the government or<br />
local climate Centers.<br />
8 Assessing human vulnerability due to floods in two<br />
basins<br />
8.1 Introduction<br />
The Ganges/Brahmaputra and Yangtze River basins in Bangladesh, China and<br />
India are two of the most densely populated basins in the world with 1.6 billion people.<br />
142
Technical report of project (GT/1010-00-04)<br />
Approximately 40% of the total population of the three countries lives along the river and<br />
coastal areas. They are extremely dependent on natural resources such as water, woods<br />
as fuel, fruits, large fish resources, etc. The people living in these regions of the two<br />
basins are most vulnerable to natural hazards such as cyclones and floods. The<br />
occurrence of floods in these areas is very frequent. Floods take million of lives and<br />
property and cause loss of natural resources in these and adjoining areas. For example, in<br />
spite of flood warning systems, a recent cyclone with resulting flooding killed about<br />
10,000 people and millions of people became homeless. These two basins, in general, are<br />
two of the most vulnerable regions in the world in terms of floods. Figure 8.1 shows the<br />
development of a cyclone close to east coast of India and it will cause a flood. In Orissa,<br />
during the last cyclone with subsequent flooding, 90-100 % of agricultural crops were<br />
damaged in vulnerable areas as the flood hit at the most vulnerable time for the paddy<br />
crop.<br />
Fig. 8.1-1 Tropical Cyclone close to east coast of India (NOAA, 1998)<br />
Vulnerability studies of the two basins due to flooding have been made. The<br />
vulnerability of the region is modeled and population is calculated through GIS in terms<br />
of people density and flood risk.<br />
8.2 Key factors that affect people and the environment<br />
Human beings have a close relationship with their environment. The relationships<br />
are inter-dependent. While human activities modify, shape, and affect the environmental<br />
processes, the processes also affect human activities. The total impact of environmental<br />
modifications causes damages to humans as well as to their living environments. The<br />
impact to humans depends on their exposure and coping capacity to a particular effect.<br />
143
Technical report of project (GT/1010-00-04)<br />
People in the study areas are exposed to risk due to a number of factors:<br />
population clustering and high population density; land cover change; poor quality of<br />
human health; poor access to transport, communication and other infrastructure, food<br />
deficit; geographical exposure and natural disasters are some of the factors. Further,<br />
fragile ecosystems such as diminishing grasslands, wetlands and forests face threats from<br />
environmental modifications, particularly when these ecosystems have to compete with<br />
humans for their existence.<br />
People and their ecosystems in the study areas are more exposed to the effects of<br />
environmental changes. Concentrations of people and cities demand more services and<br />
land resources. Intense human activities degrade the quality of the environment – air,<br />
land, and water. Even though there are a number of causes that indicate why people and<br />
their ecosystems are vulnerable to certain risks, only the key factors have been considered<br />
in this study due to lack of reliable data. In this report, population, land cover, protected<br />
areas, biodiversity hot spots, and exposure to flood and storm surges have been examined<br />
as the key factors in assessing the status of environments.<br />
Fig. 8.2-1 Flood in China (Source, CNN, 1998)<br />
8.2.1 Main disaster — flood<br />
As discussed above, flooding is the main disaster in these two basins. Every year<br />
during the monsoon season catastrophic floods on the plains of the Ganges/Brahmaputra<br />
and Yangtze Rivers occur. It is generally assumed that forest cutting in the upstream<br />
areas is responsible for the apparent increase of floods in the lowlands and downstream<br />
(Farzend, 1987). Population growth in the upstream areas increases the demand for fuel<br />
wood, fodder and timber; uncontrolled and increasing forest removal in more and more<br />
marginal areas; intensifies erosion and higher peak flows in the rivers, contributing to<br />
severe flooding in the densely populated and cultivated plains of these two basins. On<br />
one hand, there is no doubt that upstream areas and forest lands have undergone a most<br />
dynamic change in land use in recent decades due to rapid increase in population; flood<br />
hazards are aggravated by human activities. On the other hand, human vulnerability is<br />
increased because of high population density in big cities and more developed<br />
economics. Several photos and images of floods in Bangladesh, China and India are<br />
shown in Figs. 8.2-1,2 (a, b, c).<br />
144
Technical report of project (GT/1010-00-04)<br />
Fig. 8.2-2 (a) Image of flood in Yangtze River basin. RADARSAT Tracks Yangtze River<br />
flooding in China Aug 12, 1998 (Source: RSI, 1998)<br />
Fig. 8.2-2 (b) A Life boat during a flood in Bangladesh (Source: CNN, 1998)<br />
145
Technical report of project (GT/1010-00-04)<br />
8.2.2 Population concentration<br />
Fig. 8.2-2 (c) A week<br />
after the flood these<br />
villages off the<br />
Cuttack Paradeep<br />
expressway remain<br />
marooned. India<br />
(Source, UNICEF,<br />
2001)<br />
A considerable portion of the study areas is among the most crowded regions in<br />
the three countries. There is no reliable basin estimate as to how many people live in the<br />
two basins. This disparity is mainly related to lack of consistent and uniform methods of<br />
assessing population distribution in two basins. This is a first study that attempts to<br />
provide basin-wise estimations of total population as well as their spatial distributions.<br />
146
Technical report of project (GT/1010-00-04)<br />
Fig. 8.2-3 Over two million people have to get home after a religious festival! Why not take<br />
the train? No, not all at once! Scenes like this are a photographer's paradise. Make sure<br />
you find a suitable spot. Have all your gear ready and then shoot to your heart's content. If<br />
anything goes wrong, there's always another chance at next year's festival (Source: Dirk<br />
R. Frans, 2001)<br />
Fig. 8.2-4 Much of the high human loss that occurs during natural disasters happen<br />
because of high population density. The photo above shows a crowded fish marketplace<br />
in India (Source: FAO Image/ G. Bizzari)<br />
8.2.3 Land cover change<br />
147
Technical report of project (GT/1010-00-04)<br />
Fig. 8.2-5 Land cover change: Degradation in protected areas: the case of Wolong nature<br />
reserve located at upstream of Yangtze River, China (Source: Science, 2001)<br />
High population growth and urbanization demand increased food production and<br />
more resource use. In the study areas, land is limited and competition for resource use is<br />
high due to increasing urbanization and agricultural expansion. The impact can be seen<br />
through the depletion of biodiversity, soil erosion, and deforestation and wetlands<br />
disappearance. The study areas, habitats, and land resources are vital to the communities<br />
and to the economic success of the countries. Sustainable management requires regular<br />
assessment of the distribution and patterns of land resources. Degradation of land<br />
resources exposes the communities and ecosystems to flood hazard risk. A recent article<br />
in the 6 April, 2001 Science Journal revealed that even in the Wolong natural reserve,<br />
established to protect the home of the famed and endangered giant pandas, habitat<br />
degradation continues. The study analyzed data acquired over a thirty-year period and<br />
concluded that rates of degradation in the protected habitat were equal to areas outside<br />
the protected area. The rate of habitat degradation conclusively accelerated after<br />
designation of preserve in 1975 (Fig. 8.2-5).<br />
8.3 Methodology<br />
Data was processed using several remote sensing and GIS software systems<br />
(ERDAS, ESRI, 2000). Most of the work has been carried out in the <strong>GRID</strong> module of<br />
ArcINFO. Raster and vector data layers have been in an Interrupted Goode Homolosine<br />
Projection, which is an equal area projection. All raster data sets have a cell size of 1000<br />
meters (1 km).<br />
The data layers have been analyzed individually or combined with other data<br />
layers in order to see possible interrelations or possible spatial relationships among them.<br />
148
Technical report of project (GT/1010-00-04)<br />
For example, “basin layer,” “population density layer” and “political boundaries layer”<br />
have been digitally overlain in order to assess the population pressure on the two basins<br />
with three countries.<br />
Population distribution was measured using a grid of political boundaries of the<br />
two basins. These layers are combined with the population grid data individually. The<br />
number of people from Bangladesh, India and China were counted for the two basins<br />
with the resulting data being exported as a spreadsheet and combined in one graph<br />
showing the population of the two basins.<br />
8.3.1 Population density: The following classification was used for population<br />
density<br />
• Low population density: < 25 people km -2<br />
• Medium population density: 25-100 people km -2<br />
• High population density: > 100 people km -2<br />
8.3.2 Land cover distribution<br />
The land cover distribution in the two basins has been estimated by combining the<br />
land cover distribution grid with the two basins’ boundary grid individually.<br />
8.3.3 Designated protection status<br />
The protection status has been estimated by combining the protected area grid<br />
with the two basins boundary grids individually.<br />
8.3.4 Biodiversity hotspots<br />
The presence of biodiversity hotspots in two basins has been estimated by<br />
combining the hotspots grid with the two basins boundary grids individually.<br />
8.4 An assessment of environment in two basins<br />
8.4.1 Population distribution<br />
China and India holds the largest population in the world, and Bangladesh has the<br />
highest human population pressure in the world. The population in three countries has<br />
increased from 954 million to 2,411 million in the last 50 years (WRI, 2001). In many<br />
parts of three countries, the two basins are among the fastest population growth areas<br />
(Beckel, 1998, Engelman, et al., 2000). Future environmental change, especially<br />
flooding, and disease are likely to affect the two basins within the three countries more<br />
than any other inhabited regions in the country. These regions contain approximately<br />
55% of population in both of Bangladesh and India and 41% of China's population. The<br />
two basins are under increasing pressure from population growth and related<br />
development. The basic question is how many people live in these areas and what is their<br />
distribution? Different scientists have carried out work in these areas using statistical<br />
data. But there is no reliable estimate of how many people live in the two basins using<br />
consistent data sources and methodology. There exist multi-year statistical data by<br />
different level administration units in Bangladesh, China and India, but there is no clue as<br />
149
Technical report of project (GT/1010-00-04)<br />
to how many people lives within the two basins. Hence, a reliable estimate of population<br />
distribution in the two basins is needed to reduce uncertainty.<br />
High population<br />
pressure<br />
Medium population<br />
pressure<br />
Low population<br />
pressure<br />
Region<br />
Ganges/ Brahmaputra<br />
River basin<br />
60.2 10.2 29.2<br />
Yangtze River basin 60 14.2 25.8<br />
Bangladesh 92.3 5.6 2.1<br />
China 30.8 14 55.2<br />
India 75 14.5 10.5<br />
Table 8.4-1 Distribution of population pressure in two basins in three countries (Unit:<br />
percent of land area)<br />
Based on this analysis, we can estimate that the two basins occupy approximately<br />
41.9% of the land area in both of India and Bangladesh, and 20% of the land area in<br />
China. The comparison of population density in these two basins and the average in three<br />
countries provides that population density is higher in the two basins than total land,<br />
where there are on average 509 people/km -2 in the Yangtze Basin, 999 people in the<br />
Ganges basin in comparison to 137 people/km -2 in China and 367 in India and<br />
Bangladesh national average in 2000. In regards to population distribution in the two<br />
basins, 29.2% of the area has a low or non-existent population density, 10.2% has<br />
medium population density, and the remaining 60.2% is under high population pressure<br />
in the Ganges basin; 25.8% of the area has a low or non-existent population density,<br />
14.2% has medium population density, and the remaining 60% is under high population<br />
pressure in the Yangtze basin (Table 8.4-1).<br />
About 500 million people or 50% of the population in India and Bangladesh, and<br />
about 300 million people or 25% of population of China, live within these two basins.<br />
Fig. 8.4-1 (a) Population density in Ganges/Brahmaputra<br />
150
Technical report of project (GT/1010-00-04)<br />
Fig. 8.4-1 (b) Population density of Yangtze basin<br />
8.4.2 Distribution and pattern of land cover<br />
In general, land resources everywhere are threatened by uncontrolled degradation<br />
and conversion to alternative land uses, including agricultural expansion, transportation<br />
and urbanization. The impact of loss and degradation can be seen through the depletion<br />
of biodiversity, desertification, deforestation, soil erosion, wetland disappearance, and<br />
economic development.<br />
Diverse land resources and productive habitats are important for human<br />
settlement, development, and local subsistence. Despite efforts at varying levels, current<br />
approaches to the management of land resources have not always proved capable of<br />
achieving sustainable development while land resources and environment are rapidly<br />
being degraded and eroded. Rapidly growing developing countries usually base their<br />
economic success on the export of labor-intensive manufactured products. One of the<br />
greatest areas of economic success in the three countries has been in the export of these<br />
high labor products. The Ganges/Brahmaputra basin of India and Bangladesh, and the<br />
Yangtze basin of China will be the most threatened for development in order to gain<br />
access to markets if this trend continues. Sustainable development practices must be<br />
undertaken to ensure the vitality of the basins, and certain protection status must be<br />
provided to avoid excessive industrial development. Exploitation of natural resources will<br />
continue at an accelerated pace, while resources and environmental protection will also<br />
need to be addressed. Meanwhile, there exist many ecological and environmental<br />
problems such as water shortages, land degradation and heavy potential pressures from<br />
population growth and resources exploitation. In order to develop a suitable strategy for<br />
sustainable development of the basins, it is vital to assess the distribution and pattern of<br />
land cover and its protected status.<br />
151
Technical report of project (GT/1010-00-04)<br />
Fig. 8.4-2 (a) Land cover distribution of Ganges/Brahmaputra basin<br />
This is the most comprehensive estimation of the distribution and pattern of land<br />
cover in the two basins using recent satellite data.<br />
Land cover distribution in the two basins is derived from remote sensing data, and<br />
has the following distribution (Fig. 8.4-2 (a) and (b)): 1) Ganges/Brahmaputra basin:<br />
15.4% closed forest (density >40%), 10.2% open or fragmented forests (Density 10-<br />
40%), 4.5% other wooded land, 13.4% barren, snow and ice, 10.3% grassland, 44.5%<br />
cultivation and 1.7% water. About 6.5% of the land has been accorded some sort of<br />
formal protection; 2) Yangtze basin: 16.6% closed forest (density >40%), 18.1% open or<br />
fragmented forests (density 10-40%), 10.1% other wooded land, 4.7% barren, snow and<br />
ice, 13.4% grassland, 35.4% cultivation and 1.7% water. About 7.8% of the land has been<br />
accorded some sort of formal protection (Table 8.4-2).<br />
152
Technical report of project (GT/1010-00-04)<br />
Fig. 8.4-2 (b) Land cover distribution of Yangtze basin<br />
Land cover Ganges/<br />
Brahmaputra<br />
Yangtze Bangladesh China India<br />
Closed forest 15.4 16.6 8.2 11.9 12.0<br />
Open and fragmented<br />
forest<br />
10.2 18.1 19.8 10.6 8.6<br />
Other woodland 4.5 10.1 6.2 3.8 9.2<br />
Barren, ice and Snow 13.4 4.7 4.0 33.7 16.2<br />
Grassland 10.3 13.4 0.5 17.1 0.6<br />
Cultivation 44.5 35.4 56.2 21.7 52.3<br />
Water 1.7 1.7 5.2 1.2 1.1<br />
% of protected land 6.5 7.8 7 5.6 4.5<br />
Table 8.4-2 Land cover distribution with protection status (percent of land area)<br />
In Fig.8.4-2, land cover patterns of the two basins are apparent. Several br oad<br />
ar eas of for est ed land cover can be seen in the northeast, southeast, and southwest with<br />
barren/ice and snow cover existing in the extreme northwest and Tibet regions.<br />
Cultivated land is primarily located in the eastern part of China. Most grassland can be<br />
seen in the northern region and Tibet. The western region has 7.8% of land area<br />
designated as being protected, which is higher than the national average.<br />
8.4.3 Status of designated protected areas and bio-diversity hotspots<br />
Biodiversity, the variety and variability among living organisms and the<br />
environment in which they occur, is important to maintain life-sustaining systems of the<br />
biosphere (Myers, 1988). Many human activities are reducing overall biodiversity. The<br />
total number of species that inhabit the planet is unknown and it is feared that the<br />
153
Technical report of project (GT/1010-00-04)<br />
extinction of many will occur even before they have been named and described. It is<br />
estimated that 85-90% of all species can be saved by identifying and protecting areas of<br />
high biodiversity before they are further degraded, without having to actually inventory<br />
species individually (Myers, 1990). Realistically, only a relatively small portion of total<br />
land areas are likely to be devoted to biodiversity conservation; hence, it is important to<br />
identify areas rich in species diversity and endemism for priority-setting purposes. In the<br />
past, areas have been set aside as protected, often without regard to the biodiversity<br />
within their boundaries. As a result, many designated protected areas have little<br />
significance in terms of biodiversity, and conversely, many areas of habitat with<br />
significant biodiversity lack protection.<br />
The next half-century could be called the “last chance decades” (Mittermeier et<br />
al., 1999). These could be some of the most dangerous years ever for the Earth’s species<br />
and ecosystems. Yet this is also a time in which we will still have a chance to make a<br />
difference. There remains a relative handful of fragile places where biodiversity is still<br />
robust. These biodiversity “hotspots” are remote, they are spectacular – and, without<br />
expectation, they are in danger of being destroyed. To protect the diversity of life on the<br />
Earth, we need to protect these valuable hotspots (Myers 1990). Bangladesh, China and<br />
India have a very rich biodiversity, and China and India are two of only 12 “mega<br />
diversity countries” in the world (McNeely et al. 1990). The Yangtze basin in China has<br />
some of the world’s most interesting and best known flagship species, of which the giant<br />
panda, perhaps the world’s number one wildlife symbol, is the most famous. In the three<br />
countries, every bit of available land is occupied by and under the influence of humans,<br />
even in areas above the timberline. All biodiversity hotspots and protected areas in the<br />
three countries are not exempt from this influence. In order to address the issue, this<br />
study has been designed to assess and analyze the status of protected areas and<br />
biodiversity hotspots in the two basins within the three countries to answer the question:<br />
Are areas in hotspots with significant biodiversity in the two basins adequately protected?<br />
Designated protected areas in the Ganges/Brahmaputra basin occupy roughly<br />
2.8% of the land area. About 3.6% closed forests, 3% open and fragmented forests, 3.9%<br />
other woodland, 9.6% barren, snow and ice, 8.5% grassland, 1.8% cultivation and 1.2%<br />
water has been designated as protected areas in the land area. Designated protected areas<br />
in the Yangtze basin occupy roughly 7.8% of the land area. About 2.7% closed forests,<br />
3% open and fragmented forests, 2.7 % other woodland, 11.7% barren, snow and ice,<br />
1.9% grassland, 1.3% cultivation and 22.2% water has been designated as protected areas<br />
in the Yangtze basin. Forests, especially tropical and sub-tropical forests, are biologically<br />
the most diverse and home to thousands of endemic species.<br />
Worldwide, approximately 3.4% of the area within biodiversity hotspots is<br />
concentrated in these two basins. The regions include 29.8% of the Ganges/Brahmaputra<br />
basin, and 15.1% of the Yangtze basin. Both of these regions are “bright hot” in progress<br />
of economic development in these three countries, while at the same time being<br />
“hotspots" for biodiversity.<br />
Of the 25 total hotspots around the world, 2 are at least partially within the<br />
Yangtze basin. The mountains of south central China are mostly located in the Yangtze<br />
basin; part of the Indo-Burma hotspot lies within the Yangtze basin. The Indo-Burma<br />
hotspots are largely located in the Ganges/Brahmaputra basin.<br />
154
Technical report of project (GT/1010-00-04)<br />
Population pressure is high in the portions of these two hotspots that lie in the two<br />
basins. About 26.6 million people live in and around the Indo-Burma hotspot; 62.3% of<br />
the hotspot area has a high-population density, 27.7% has medium-population density<br />
and only 10% is considered low-population density. About 10.9 million people live in<br />
and around the mountains of the south central China hotspot. About 5% of that area has a<br />
high-population density, 11.3% has medium-population density, and 83.7% has lowpopulation<br />
density.<br />
The lack of designated protected areas within Bangladesh, China and India is<br />
alarming. On an average, only 5.6% of the total land area of two basins, and only 4.2% of<br />
hotspots in the two basins, 3.5% of hotspots in the Ganges/Brahmaputra basin, and 3.1%<br />
of hotspots in the Yangtze basin are designated as protected areas. Only 3% of the land<br />
area within the mountains of the south central China hotspot holds any type of protected<br />
status, and the hotspot of Indo-Burma has only 5.4% of the total land of the two basins<br />
under designated protected status. The critical issue is to establish immediate protection<br />
status in areas that remain unprotected.<br />
8.4.4 Surface topographic characteristics<br />
Fig. 8.4-3 A DEM model map of Ganges/Brahamputra River and Yangtze River basins<br />
Many parts of the two basins, particularly in downstream rivers, have a majority<br />
of their land characterized as relatively flat (elevation under 50 m). For instance, the<br />
Bengal delta in Bangladesh and the delta of the Yangtze have more than 90% and 70% of<br />
their land under 50 m elevations, respectively. People and ecosystems in low elevation<br />
areas (coastal areas) are more exposed to floods (coastal floods due to wind storm and<br />
tidal wave actions) compared to high elevation areas (Fig. 8.4-3).<br />
8.5 Vulnerability due to floods<br />
Human vulnerability can be defined as the exposure to hazards by external<br />
activity (e.g. the climatic change) and coping capacity of the people to reduce the risk. In<br />
other words, vulnerability is the function of exposure to hazard and coping capacity at a<br />
155
Technical report of project (GT/1010-00-04)<br />
certain point of time. Vulnerability is also connected with access to opportunities, which<br />
defines the ability of people to deal with the impacts of the hazard to which they are<br />
exposed. It states the characteristics of a person or group in terms of their capacity to<br />
anticipate, cope with, resist, and recover from the impact.<br />
Fig. 8.5-1 People try to collect pure drinking water that was scarce during the flood in<br />
Bangladesh. (Source: Daily Tttefaq, 1998)<br />
The vulnerability analysis for the project has two major parts: a human<br />
component and an environmental component. The human component is the most<br />
important part as if there is no human activity; there is no human vulnerability. Global<br />
population and resources are unequally distributed over the earth surface. The largest<br />
concentration of population and resources are found in the Ganges/Brahmaputra and<br />
156
Technical report of project (GT/1010-00-04)<br />
Yangtze basins. These two basins have extensively been used for human activities – city<br />
development, agriculture, and resource exploitation. The basins also house pristine<br />
habitats such as wetlands and areas for unique wild life. Extensive use of the two basins<br />
for human activity has led to conflicts between resource use and environmental quality on<br />
these areas. This is the human dimension of the problem.<br />
The environmental component is the other dimension of vulnerability. Whether<br />
natural or man-made, environmental changes have a significant impact on people as well<br />
as on overall ecosystems of the two basins. Impacts of climate change on the<br />
environment have received wide attention among the research community. This is mainly<br />
related to recent advances in spatial information technologies, which show that physical<br />
changes in the environment, increasing storm activity, flood and unusual weather patterns<br />
have some links to global climate change.<br />
Human impact on the environment increases environmental vulnerability, which<br />
also increases human awareness and stimulates human efforts to protect the environment.<br />
It is hoped that increased human awareness will decrease future human impacts.<br />
Fig. 8.5-2 The house remains submerged a week after the first flooding in India (Source,<br />
UNICEF, 2001)<br />
157
Technical report of project (GT/1010-00-04)<br />
9 Conclusions and main findings<br />
Large river floodplains around the world support heavy population settlements<br />
where most often, development goals are improved navigation, enhanced agricultural<br />
production and flood protection. Floods are one of the most common devastating natural<br />
hazards in the world, claiming more lives and property when compared to other natural<br />
disasters. Floods are frequent and a common feature every year especially after heavy<br />
rains or thunderstorms, winter snow thaws, strong cyclones and monsoons. Floods can be<br />
slow or fast rising depending upon the amount of rains and snow melt, and generally<br />
develop over a period of days. Floods have also created havoc and loss of life and<br />
property instantaneously after dam failures. Potentially the worst flood events are due to<br />
poor dam design and/or structural damage caused by a major event such as an<br />
earthquake.<br />
Eliminating the “flood problem” in Bangladesh is nearly impossible. Improved<br />
understanding of the causes of flooding, better forecasting, monitoring and early warning<br />
of flood events and more sophisticated responses to the flood hazard will, in the long<br />
term and on a year-to-year basis, reduce the enormous damage and loss of life to which<br />
many have become accustomed. Densely populated floodplains and coastal lowlands will<br />
eventually experience a more catastrophic flood, perhaps in the form of a 1000-year<br />
flood, a 2000-year flood or even the Probable Maximum Flood. When that happens flood<br />
defenses will be overtopped with the direst of consequences (Smith and Ward, 1998).<br />
Through a review of early warning and flood forecasting tools and models being<br />
used by developed countries, this study attempts to assess the gap in knowledge and<br />
technology being deployed by developing countries. It is hoped this will assist in<br />
knowledge transfer related to operational systems for flood risk monitoring using the<br />
latest tools and technologies.<br />
Improved databases are likely to play an important part in Bangladesh, China and<br />
India. Relevant databases on numerous parameters using GIS for the two river basins<br />
have been compiled and analyzed to demonstrate the usefulness of GIS to visualize the<br />
early warning of floods, occurrence of floods and total affected areas.<br />
A reliable assessment of the current status of the environment in the two basins is<br />
long overdue. The major constraint has been the lack of accurate and timely data at the<br />
basin level. Recent advances in spatial data gathering and processing techniques such as<br />
satellite remote sensing and GIS have helped the research community address these<br />
issues. It is vital to assess human vulnerability to environmental threats in these two<br />
basins using population distribution, land cover, topographical characteristics of the<br />
landscape, potential of flood occurrence and the strength of people’s coping capacity.<br />
People in these areas are relatively more exposed to environmental threats. This<br />
study shows that the vulnerability of a community to environmental threats depends on<br />
their exposure and coping capacities. These two basins with high population<br />
concentrations and a high probability of natural disasters (floods) are highly vulnerable.<br />
158
Technical report of project (GT/1010-00-04)<br />
Fig. 9.0-1 Yangtze River Flood (July-August 1998). The image shows an area located about<br />
200 km southwest of Wuhan, one of the cities most damaged by the floods along the<br />
Yangtze River in China. The image was obtained by geocoding and superimposing an ERS<br />
SAR multitemporal data set (processed by DLR) onto a topographic map of the area. The<br />
ERS data used for the multitemporal image have been acquired by Ulan Bator ground<br />
station on 9/6/1993 (reference frame) and 1/8/1998 (during the flood event). Flooded zones<br />
are shown in light blue tones. Areas normally covered by water such as lakes, artificial<br />
basins and swamps are visible in dark blue or black colors. See also comments on the<br />
disaster and same SAR image before and after superimposition (August 1st, 1998 - June<br />
9th, 1993). (Copyright © Eurimage – Earthwatching, Source: ESA, 2002)<br />
159
Technical report of project (GT/1010-00-04)<br />
Bibliography<br />
Abbas, B. M. 1982. The Ganges Water Dispute. Dhaka, Bangladesh: University Press<br />
Ltd.<br />
Abbas, B. M. 1992. “Development of Water Resources in the Ganges and Brahmaputra<br />
River Basins.” In the Ganges Brahmaputra basin, edited by D. J. Eaton. Austin, Texas:<br />
The University of Texas at Austin.<br />
Adnan, S. 1993. Living Without Floods. Dhaka, Bangladesh: Research & Advisory<br />
Services.<br />
Ageta, Y. and Higuchi, K., 1984. Estimation of mass balances components of a summer<br />
accumulation type glacier in the Nepal Himalaya. Geografis. Annal, 66A, 249-255.<br />
Ageta, Y. 1983. Characteristics of mass balance of summer accumulation type glacier in<br />
the Nepal Himalaya (1), (11). Seppyo, 45, 81-105.<br />
Ahmad, F. and Mirza, M. Q., 1992. Bangladesh Development, Resources and<br />
Constraints. Bangladesh Development Dialogue, Issue No. 1.<br />
Ahmed, F. and Smith, P. G., 1988. “Water Usage in Rural Areas of Bangladesh”. In<br />
Developing World Water. Loughborough, USA: Grosvenor Press International.<br />
Ahsan, A. 1995. Proposal for a Multi-disciplinary Study on a Framework for Subregional<br />
Cooperation for Development of Water Resources in the Eastern and<br />
Northeastern Subregion of South Asia. Dhaka, Bangladesh: National Institute for Mass<br />
Communication.<br />
Ali, M. Y. 1991. Towards Sustainable Development: Fisheries Resources of Bangladesh.<br />
Bangladesh Bureau of Statistics (BBS), 1995. Statistical Yearbook of Bangladesh.<br />
Dhaka, Bangladesh: Bangladesh Bureau of Statistics.<br />
Bangladesh Center for Advanced Studies (BCAS), 1994. Rivers of Life. Edited by Kelly<br />
Aggart et al. Dhaka, Bangladesh: Bangladesh Center for Advanced Studies.<br />
Bangladesh. Copenhagen: Department of International Development Cooperation.<br />
Bangladesh: A Report by the World Conservation Monitoring Center, 1990.<br />
Bangladesh: Flood Plan Coordination Organization, Government of Bangladesh.<br />
Begum, K. 1987. Tension Over the Farakka Barrage. Dhaka, Bangladesh: University<br />
Press Ltd.<br />
Berz, G. 2000. Flood disasters: lessons from the past - worries for the future, Proc. Instn<br />
Civ. Engrs. Water & Mar. Engn, Vol. 142, Mar. 3-8, p. 3 - 8.<br />
Brahmaputra Basin: Water Resource Cooperation Between Nepal, India and Bangladesh.<br />
Bull. Amer. Met.Soc. 81, 1338-1340.<br />
160
Technical report of project (GT/1010-00-04)<br />
Burke, L., Kura, Y., Kassem, K., Spalding, M. and Revenga, C. 2000. Pilot analysis of<br />
global ecosystem: Coastal ecosystems technical report. Washington, D.C. World<br />
Resources Institute.<br />
Chalise, S.R. 1994. Mountain environment and climate change in the Hindukush-<br />
Himalaya, In: Mountain Environment in changing climate, Martin Beniston, Routledge,<br />
pp. 382-404.<br />
Chaturvedi, M.C. 1992. “Water Resources Engineering Considerations”. In The Ganges<br />
Brahmaputra basin: Water Resource Cooperation Between Nepal, India and Bangladesh.<br />
CLIFF, Floods. 2001. Cluster Initiative for Flood and Fire emergencies. Frascati (RM)<br />
Italy (http://tempest.esrin.esa.it/~cliff/).<br />
Committee for the National Institute for the Environment. 1998. Population and<br />
environment linkages: Oceans. http://www.csa.com/hottopics/ern/.<br />
Danish International Development Agency (DANIDA), 1989. Environmental Profile,<br />
Dhaka, Bangladesh: IUCN-The World Conservation Union, Ministry of Environment and<br />
Forest, National Conservation Strategy of Bangladesh, Bangladesh Agricultural Research<br />
Council.<br />
Dhar, O.N. and Nandargi, S. 1995. Floods in Indian rivers and their meteorological<br />
aspects, Memoir Geological Soc. Of India, no. 41, pp.1-25.<br />
Edited by D. J. Eaton. Austin, Texas: The University of Texas at Austin.<br />
Elahi, K. M., Ahmed, K. S., and Mafuzuddin, M. Ed. 1991. Riverbank Erosions, Flood<br />
and Population Displacement in Bangladesh. Dhaka, Bangladesh: Academic Publishers.<br />
EFFS. 2001. European Flood Forecasting System. Delft, The Netherlands<br />
(http://effs.wldelft.nl/).<br />
Engelman, R., and LeRoy P. 1993. Sustaining Water: Population and Environment<br />
Program. Washington, DC: Population Action International.<br />
Engelman, R., Cincotta, B. D., Gardner-Outlaw, T. and Wisnewski, J. 2000. Population<br />
and Natural Resources at the Turn of the Millennium: People in the Balance. Population<br />
Action International, Washington, D.C., USA.<br />
ERDAS and ESRI, 2000. IMAGINE - Version 8.3 (ERDAS) for stratification and<br />
digitizing of vector polygons; ENVI (Research Systems, Inc) for image interpretation,<br />
graphical analysis and determining models; and Land Analysis System (public domain)<br />
for modeling. GIS analysis was performed using software donated by the Environmental<br />
Systems Research Institute (ESRI), Inc.<br />
Falkenmark, M., and Widstrand, C. “Population and Water Resources: A Delicate<br />
Balance.” Population Bulletin (November 1992).<br />
161
Technical report of project (GT/1010-00-04)<br />
Fagan, Brian.1999. Floods, Famines, and Emperors – El Nino and the fate of<br />
civilizations. Basic Books. New York, USA.<br />
FAO, 1995. Forest Resources Assessment 1990: Global Synthesis. FAO Forestry Paper<br />
114, 46. United Nations Food and Agriculture Organization (FAO), Rome, Italy.<br />
FAO, 1997. Digital Soil Map of the World (1:5,000,000),<br />
http://www.fao.org/ag/agl/agls/t1.htm.<br />
Flood Plan Coordination Organization (FPCO), 1993. Southwest Area Water Resources<br />
FPCO, September 1995. Bangladesh Water and Flood Management Strategy. Dhaka,<br />
Bangladesh.<br />
Green, M.J.B. 1990. An Overview of Bangladesh Protected Areas System. Dhaka.<br />
Flood Plan Coordination Organization (FPCO), 1993. Southwest Area Water Resources.<br />
FPCO, 1995. Bangladesh Water and Flood Management Strategy. Dhaka, Bangladesh.<br />
Gesch, D.B., Verdin, K.L., and Greenlee, S.K. 1999. New land surface digital elevation<br />
model covers the Earth. EOS, Transactions of the American Geophysical Union, v. 80,<br />
no. 6, pp. 69-70.<br />
Graham, W.J. 2000. Should dams be modified for the probable maximum flood? J. Am.<br />
Water Resources Association, vol. 36, no. 5, p. 953 - 962.<br />
Green, M.J.B. 1990. An Overview of Bangladesh Protected Areas System. Dhaka,<br />
Bangladesh: A Report by the World Conservation Monitoring Center, 1990.<br />
Gupta, A. 1998. Geomorphological Effects of Floods on Indian Rivers, Memoir<br />
Geological Society Of India, no. 41, pp. 143-153.<br />
Hasnain, S.I. 1999. Himalayan Glaciers: Hydrology and Hydrochemistry, Allied<br />
Publishers, Ltd.<br />
Herman, A., V. Kumar, P. Arkin, and J. Kousky. 1997. Objectively determined 10-day<br />
African rainfall estimates created for famine early warning systems, International Journal<br />
of Remote Sensing, v. 18, no. 10, 2147-2159.<br />
His Majesty's Government of Nepal (HMGN), May 1997. Erosion and Sedimentation in<br />
the Nepal Himalayas. Kathmandu, Nepal: His Majesty's Government of Nepal.<br />
Hofer, T. 1998. Floods in Bangladesh: A highland-lowland interaction, Ph. D. thesis,<br />
University of Berne, Institute of Geography, Switzerland.<br />
Hooper, A.G. 2001. Coping with river floods in Bangladesh, The Environmental of<br />
Constructions Edited by T.G. Carpenter, Wiley Pub.<br />
Jayaraman, V., Chandrasekhar, M.G. and Rao, U.R. 1997. Managing the Natural<br />
Disasters From Space Technology Inputs, Acta Astronautica, Vol. 40, no. 2-8, pp. 291-<br />
325.<br />
162
Technical report of project (GT/1010-00-04)<br />
Jeanne X. Kasperson, Roger E. Kasperson and B.L. Turner II. 1995. Regions at risk:<br />
Comparisons of threatened environments. United Nations University Press, New York.<br />
Kelleher, G. C., Bleakley, C. and Wells, S. 1995. A Global Representative System of<br />
Marine Protected Areas, Volume 1. World Bank, Washington, D. C., USA, 30 pp.<br />
Khan, A.H. 1995. “Ganges Water Sharing: An Overview.” In Women for Water Sharing.<br />
Edited by H. Maudud. Dhaka, Bangladesh: Academic Publishers.<br />
Khandakar, K. et al. June 1994. A Brief Study Report on Environmental Degradation of<br />
Ganges Basis Area. Dhaka, Bangladesh: Academic Publishers.<br />
Kleypas, J. A., R. W. Buddemeier, D. Archer, J.P. Gattuso, C. Landon and B. N. Opdyke.<br />
1999. Geochemical consequences of increased atmospheric carbon dioxide on coral reefs.<br />
Science 284, 118-120.<br />
Loveland, T. R, Reed, B. C., Brown, J. F., Ohlen, D. O., Zhu, Z., Yang, L. and Merchant,<br />
J. W. 2000. Developments of a Global Land Cover Characteristics Database and IGBP<br />
DISCover from 1-km AVHRR Data. International Journal of Remote Sensing 21, 1303-<br />
1330.<br />
Loveland, T. R. and A. S. Belward. 1997. The IGBP-DIS global 1-km land cover data<br />
set, DISCover: first results. Int. J. Remote Sensing 18: 3289-3295.<br />
Lu E., and Y. Ding. 1997. Low frequency oscillation in East Asia during the 1991<br />
excessively heavy rain over Changjiang-Huaihe River basin. Acta Meteorologica Sinica,<br />
11 (1), 12-22.<br />
Management Project. Volume I. Dhaka, Bangladesh: Sir William Halcrow & Partners<br />
Ltd., Flood Plan Coordination Organization.<br />
Mather, J. R. and Sdasyuk, G. V. 1991. Global change: Geographic approaches.<br />
University of Arizona Press, Tucson, Arizona, USA.<br />
Mayers, N., Mittermeier, R. A., Mittereier, C. G., daFonseca, G. A. B. and Kent, J. 2000.<br />
Biodiversity hotspots for conservation priorities. Nature 403, 24, pp 853- 858.<br />
Mehta, J.S. 1992. “Opportunity Costs of Delay in Water Resource Management between<br />
Nepal, India and Bangladesh.” In the Ganges Brahmaputra basin: Water Resource<br />
Cooperation Between Nepal, India and Bangladesh. Edited by D. J. Eaton. Austin, TX:<br />
The University of Texas at Austin.<br />
Mittermeier, R. A., Myers, N. and Mittermeier, C. G. 1999. Hotspots: Earth’s biological<br />
richest and most endangered terrestrial ecoregions. CEMEX, Conservation International,<br />
Washington, D. C., USA, 11 pp.<br />
Monitoring of the Progress of Implementation of the Strategies for Health For All by the<br />
Year 2000. Common Framework 3, Bangladesh. Dhaka, Bangladesh: Directorate of<br />
Health Services, Ministry of Health and Family Welfare.<br />
163
Technical report of project (GT/1010-00-04)<br />
National Environmental Protection of China. 1998. Research report of Chinese<br />
biodiversity. Chinese Environmental Press, Beijing, China<br />
Nelson, L., and Sandell, C. 1990. Population and Water Resources. Washington, DC:<br />
National Audubon Society.<br />
Nishat, A. 1992. “Bangladesh's Opportunity Costs”. In The Ganges Brahmaputra basin:<br />
Water Resource Cooperation Between Nepal, India and Bangladesh, edited by D. J.<br />
Eaton. Austin, TX: The University of Texas at Austin.<br />
NOAA 2000. Coastal: The Potential Consquences of Climate Variablity and Change.<br />
National Oceanic and Atmospheric Administration (NOAA), Silver Spring, Maryland,<br />
USA, 6 pp.<br />
NOAA 2000. The potential consequences of climate variability and change on coastal<br />
areas and marine resources. Silver Spring, Maryland, USA, 1 pp.<br />
Potkin, A. 1991. “Towards Watering the Bangladeshi Sundarbans.” The Journal of Social<br />
Studies (January 1991).<br />
Pradhan, B. K. and Shreshta, M. 1992. A Nepalese Perspective of Himalayan Water<br />
Development. Kathmandu, Nepal: Water and Energy Commission Secretariat, His<br />
Majesties Government of Nepal.<br />
R. Watson, M.C.Z., R.H. Moss. 1996. Climate Change 1995: Impacts, adaptations and<br />
mitigation of climate change: Scientific-Technical Analyses. Intergovernmental Panel on<br />
Climate Change (IPCC). New York, Cambridge University Press, 296, 22 pp.<br />
Rao, A., Scofield, R.A., Grody, N.C. and Tsai, C. 1997. Global Monitoring of large area<br />
flooding using the DMSP SSM/I Soil Wetness Index, Eighth Conference on Satellite<br />
Meteorology and Oceanography, p. 455-459.<br />
Report 1995 on Environment. Dhaka, Bangladesh: United Nations Development<br />
Programme (UNDP).<br />
Ricardo Casale and Claudio Margottini, (Eds.). 1999. Floods and Landslides. Springer-<br />
Verlag, Berlin, Germany.<br />
Serageldin, I. 1995. Towards Sustainable Management of Water Resources. Washington,<br />
DC: The World Bank.<br />
Shuttleworth J. 1992. Evaporation. Chapter 4 of the Handbook of Hydrology, Maidment<br />
D (ed.). McGraw-Hill: New York; 4.1-4.53.<br />
Singh, A., Dieye, A. M., Finco, M., Chenoweth, M. S., Fosnight, E. A. and Allotey, A.<br />
1999. Early warning of selected emerging environmental issues in Africa: Change and<br />
Correlation from a geographic perspective. United Nations Environment Programme<br />
(<strong>UNEP</strong>), Nairobi, Kenya, pp 2, 9.<br />
164
Technical report of project (GT/1010-00-04)<br />
Singh, A., Shi, H., Foresman, T. and Fosnight, E. A. 2001. An Assessment of the Status<br />
of the World’s Remaining Closed Forests Using Satellite Data and Policy Options for<br />
Their Protection. Ambio 30, 67-69.<br />
Smith, Keith and Ward, Roy. 1998. Floods: Physical processes and human impacts. John<br />
Wiley & Sons Ltd, West Sussex, England, pp 3-33.<br />
Spalding, M. D., Blasco, F. and Field, C. D. 1997. World Mangrove Atlas. Okinawa,<br />
Japan: The International Society for Mangrove Ecosystems, 2000 pp.<br />
Stanley A. Changnon. 1996. The great flood of 1993. Westview Press, Oxford, UK<br />
T.T. MAPS, 1987. A Social and Economic Atlas of India. New Delhi, India: Oxford<br />
University Press.<br />
T.T. MAPS, 1987. A Social and Economic Atlas of India. New Delhi, India: Oxford<br />
University Press.<br />
UN 1992. Agenda 21: The United Nations Programme of Action from Rio. United<br />
Nations, New York, USA, pp 147.<br />
United Nations Development Programme (UNDP), 1995. The Human Development<br />
Report 1995 on Environment. Dhaka, Bangladesh: United Nations Development<br />
Programme.<br />
USGS. 1999. HYDRO1K: hydrologic derivatives from GTOPO30 global topography,<br />
United States Geological Survey (USGS,<br />
http://edcdaac.usgs.gov/gtopo30/hydro/index.html)<br />
Verdin, J., and R. Klaver. 2001. Grid cell based crop water accounting for the Famine<br />
Early Warning System. Hydrological Processes, in press. USGS. 1999. HYDRO1K:<br />
hydrologic derivatives from GTOPO30 global topography,<br />
http://edcdaac.usgs.gov/gtopo30/hydro/index.html.<br />
Verdin, K., and J. Verdin 1999. A topological system for delineation and codification of<br />
the Earth's river basins, Journal of Hydrology, v. 218, pp. 1-12.<br />
Verghese, B.G. 1990. Waters of Hope: Himalayas, Ganga, and Cooperation for One<br />
Billion People. Dhaka, Bangladesh: Academic Publishers.<br />
Vitousek P. M., Mooney H. A., Lubchenco J and Melillo J.M. 1997. Human Domination<br />
of Earth’s Ecosystems. Science 277, 494-499.<br />
Water Resource Cooperation Between Nepal, India and Bangladesh, edited by D. J.<br />
Eaton. Austin, TX: The University of Texas at Austin.<br />
Watson R. T., Zinyowera M. C., Moss R. H. and Dokken D. J. 2000. The Regional<br />
Impacts Climate Change: An Assessment of Vulnerability.<br />
.<br />
165
Technical report of project (GT/1010-00-04)<br />
WCMC 1992. Global Biodiversity: Status of the Earth’s living resources. World<br />
Conservation Monitoring Centre (WCMC), CHAPMAN & HALL, New York, USA, pp<br />
xiii.<br />
WCMC 2000. Protected Areas GIS Dataset. CD-ROM, World Conservation Monitoring<br />
Centre (WCMC), Cambridge, UK.<br />
Wohl, E. and Cenderelli, D. 1998. Flooding in the Himalaya Mountains, Memoir<br />
Geological Soc. Of India, No. 41, pp. 77-99.<br />
WRI 2000. World Resources 2000-2001: People and Ecosystems. World Resources<br />
Institute (WRI), Washington, D. C. 71 pp.<br />
Xie, P. and P. A. Arkin. 1997. A 17-year monthly analysis based on gauge observations,<br />
satellite estimates, and numerical model outputs. Bulletin of the American<br />
Meteorological Society 78(11): 2539-58.<br />
Yu, P-S, Chen, C-J, Chen, S-J and Lin, S-C. 2001. Application of Grey model toward<br />
runoff forecasting, J. Am. Water Resources Assn., v. 37, no. 1, p. 151- 165<br />
Yijin, Wu and Gough, W.A. 2001. Yangtze River Floods - Causes, Trends and<br />
Prediction.<br />
166
Technical report of project (GT/1010-00-04)<br />
Acronyms and Abbreviations<br />
AFP France-Press<br />
AVHRR Advanced Very High Resolution Radiometer<br />
CI Conservation International<br />
CLIFF Cluster Initiative for Flood and Fire emergencies<br />
CNIE Committee for the National Institute for the Environment<br />
CVI Coastal Vulnerability Index<br />
DEM Digital Elevation Model<br />
EDC EROS Data Center<br />
EFFS The European Flood Forecasting System<br />
ENVI The Environment for Visualization Images<br />
EPA U.S. Environmental Protection Agency<br />
EROS Earth Resources Observation Systems<br />
ERS Earth Resources Satellite<br />
ESA Earth Observation Applications<br />
ESRI Environmental Systems Research Institute, Inc.<br />
EVI Economic Vulnerability Index<br />
FEWS The Famine Early Warning System<br />
FAO Food and Agricultural Organization of the United Nations<br />
FFWC Flood Forecasting and Warning Centre<br />
FHI Food for the Hungry International<br />
GDP Gross Domestic Product<br />
GEF Global Environment Facility<br />
GIEWS Global Information and Early Warning System<br />
GIS Geographical Information Systems<br />
GIWA Global International Water Assessment<br />
GLOBEC Global Ocean Ecosystem Dynamics<br />
GPA Global Programme of Action<br />
GOB Government of Bangladesh<br />
GPS Global Positioning System<br />
<strong>GRID</strong> Global Resource Information Database<br />
HDI Human Development Index of UNDP<br />
HEC Hydrological Engineering Center (U.S. Corps of Engineers)<br />
HYRAD Hydrological Radar<br />
IDNDR International Decade for Natural Disaster Reduction<br />
IFPRI International Food Policy Research Institute<br />
IGBP International Geosphere-Biosphere Programme<br />
IMO International Meteorological Organization<br />
IPCC Intergovernmental Panel on Climate Change<br />
IRF Intermediate Regional Flood<br />
167
Technical report of project (GT/1010-00-04)<br />
IUCN World Conservation Union<br />
JGOFS Joint Global Ocean Flux Study<br />
LOICZ Land – Ocean Interactions in the Coastal Zone<br />
MRC Munich Reinsurance Company<br />
NAS The National Academy of Sciences<br />
NDVI Normalized Difference Vegetation Index<br />
NIMA US National Imagery and Mapping Agency's<br />
NOAA National Oceanic and Atmospheric Administration<br />
NWS National Weather Service (USA)<br />
OFDA/CREDThe Office of US Foreign Disaster Assistance/Center for Research on the<br />
Epidemiology of Disasters<br />
PAGE Pilot Analysis of Global Ecosystems<br />
RSI RADARSAT International<br />
REF Satellite Rainfalls Estimates<br />
REFS River Flow Forecasting System<br />
SFHA Special Flood Hazard Area<br />
SOFIA State of the World Fisheries and Aquaculture<br />
SOPAC South Pacific Applied Geoscience Commission<br />
SST Sea Surface Temperature<br />
UN United Nations<br />
UNA United Nations Association of Canada<br />
UNDP United Nations Development Programme<br />
UNDRO UN Disaster Relief Organization<br />
<strong>UNEP</strong> United Nations Environmental Programme<br />
UNICEF United Nations Children’s Fund<br />
USGS United States Geological Survey<br />
WCMC World Conservation and Monitoring Center<br />
WHYCOS The World Hydrological Cycle Observing System<br />
WMO World Meteorological Organization<br />
WRI World Resources Institute<br />
168