TOWN OF NATICK Housing Production Plan
TOWN OF NATICK Housing Production Plan
TOWN OF NATICK Housing Production Plan

Create successful ePaper yourself
Turn your PDF publications into a flip-book with our unique Google optimized e-Paper software.
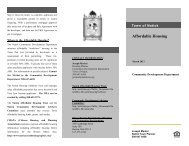
Figure 2<br />
Source: 2006-2010 ACS<br />
Unemployment<br />
As Figure 2 demonstrates, the annual unemployment rate in Natick (not seasonally adjusted)<br />
has remained lower than the Middlesex County and the Commonwealth of Massachusetts<br />
averages since at least 1990. It peaked at 6.1% in Natick in 1991, and approached that same level<br />
in 2009 and 2010 when the rate was 5.9%.<br />
Unemployment Rate (%)<br />
10<br />
9<br />
8<br />
7<br />
6<br />
5<br />
4<br />
3<br />
2<br />
1<br />
0<br />
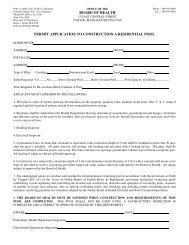
Percent of Households<br />
50.0%<br />
45.0%<br />
40.0%<br />
35.0%<br />
30.0%<br />
25.0%<br />
20.0%<br />
15.0%<br />
10.0%<br />
5.0%<br />
0.0%<br />
Vehicles Available<br />
None 1 2 3 or more<br />
Vehicles Available<br />
Figure 3<br />
Unemployment<br />
1990<br />
1991<br />
1992<br />
1993<br />
1994<br />
1995<br />
1996<br />
1997<br />
1998<br />
1999<br />
2000<br />
2001<br />
2002<br />
2003<br />
2004<br />
2005<br />
2006<br />
2007<br />
2008<br />
2009<br />
2010<br />
Source: Massachusetts Executive Office of Labor and Workforce Development<br />
Natick<br />
Middlesex<br />
The lowest the unemployment rate has been was 1.9% in 1999 and 2001. Table 19 below shows<br />
the unemployment rate of the surrounding areas in 2011. The unemployment rate in Natick has<br />
continued to decline over the course of 2011 to 4.0% in December 2011, as shown in Table 19.<br />
32 | P a g e L D S C o n s u l t i n g G r o u p , L L C<br />
MA<br />
Natick<br />
Middlesex County<br />
MA