Quantitative comparison of processes of oil- and water-based mud ...
Quantitative comparison of processes of oil- and water-based mud ...
Quantitative comparison of processes of oil- and water-based mud ...

Create successful ePaper yourself
Turn your PDF publications into a flip-book with our unique Google optimized e-Paper software.
E68 Salazar <strong>and</strong> Torres-Verdín<br />
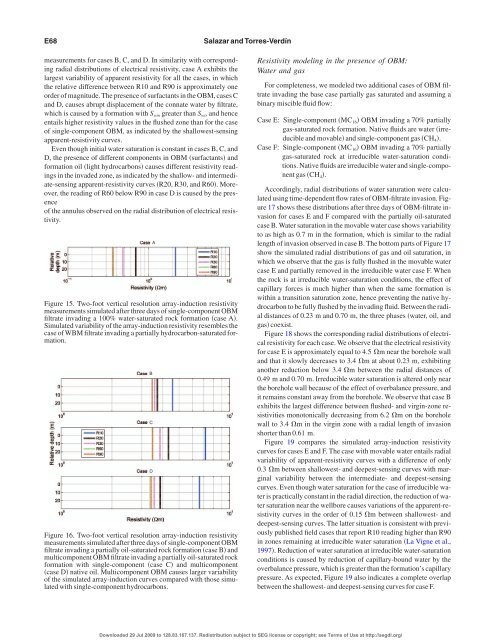
measurements for cases B, C, <strong>and</strong> D. In similarity with corresponding<br />
radial distributions <strong>of</strong> electrical resistivity, case A exhibits the<br />
largest variability <strong>of</strong> apparent resistivity for all the cases, in which<br />
the relative difference between R10 <strong>and</strong> R90 is approximately one<br />
order <strong>of</strong> magnitude. The presence <strong>of</strong> surfactants in the OBM, cases C<br />
<strong>and</strong> D, causes abrupt displacement <strong>of</strong> the connate <strong>water</strong> by filtrate,<br />
which is caused by a formation with S win greater than S wir <strong>and</strong> hence<br />
entails higher resistivity values in the flushed zone than for the case<br />
<strong>of</strong> single-component OBM, as indicated by the shallowest-sensing<br />
apparent-resistivity curves.<br />
Even though initial <strong>water</strong> saturation is constant in cases B, C, <strong>and</strong><br />
D, the presence <strong>of</strong> different components in OBM surfactants <strong>and</strong><br />
formation <strong>oil</strong> light hydrocarbons causes different resistivity readings<br />
in the invaded zone, as indicated by the shallow- <strong>and</strong> intermediate-sensing<br />
apparent-resistivity curves R20, R30, <strong>and</strong> R60. Moreover,<br />
the reading <strong>of</strong> R60 below R90 in case D is caused by the presence<br />
<strong>of</strong> the annulus observed on the radial distribution <strong>of</strong> electrical resistivity.<br />
Figure 15. Two-foot vertical resolution array-induction resistivity<br />
measurements simulated after three days <strong>of</strong> single-component OBM<br />
filtrate invading a 100% <strong>water</strong>-saturated rock formation case A.<br />
Simulated variability <strong>of</strong> the array-induction resistivity resembles the<br />
case <strong>of</strong> WBM filtrate invading a partially hydrocarbon-saturated formation.<br />
Figure 16. Two-foot vertical resolution array-induction resistivity<br />
measurements simulated after three days <strong>of</strong> single-component OBM<br />
filtrate invading a partially <strong>oil</strong>-saturated rock formation case B <strong>and</strong><br />
multicomponent OBM filtrate invading a partially <strong>oil</strong>-saturated rock<br />
formation with single-component case C <strong>and</strong> multicomponent<br />
case D native <strong>oil</strong>. Multicomponent OBM causes larger variability<br />
<strong>of</strong> the simulated array-induction curves compared with those simulated<br />
with single-component hydrocarbons.<br />
B<br />
C<br />
D<br />
A<br />
Resistivity modeling in the presence <strong>of</strong> OBM:<br />
Water <strong>and</strong> gas<br />
For completeness, we modeled two additional cases <strong>of</strong> OBM filtrate<br />
invading the base case partially gas saturated <strong>and</strong> assuming a<br />
binary miscible fluid flow:<br />
Case E: Single-component MC 16 OBM invading a 70% partially<br />
gas-saturated rock formation. Native fluids are <strong>water</strong> irreducible<br />
<strong>and</strong> movable <strong>and</strong> single-component gas CH 4.<br />
Case F: Single-component MC 16 OBM invading a 70% partially<br />
gas-saturated rock at irreducible <strong>water</strong>-saturation conditions.<br />
Native fluids are irreducible <strong>water</strong> <strong>and</strong> single-component<br />
gas CH 4.<br />
Accordingly, radial distributions <strong>of</strong> <strong>water</strong> saturation were calculated<br />
using time-dependent flow rates <strong>of</strong> OBM-filtrate invasion. Figure<br />
17 shows these distributions after three days <strong>of</strong> OBM-filtrate invasion<br />
for cases E <strong>and</strong> F compared with the partially <strong>oil</strong>-saturated<br />
case B. Water saturation in the movable <strong>water</strong> case shows variability<br />
to as high as 0.7 m in the formation, which is similar to the radial<br />
length <strong>of</strong> invasion observed in case B. The bottom parts <strong>of</strong> Figure 17<br />
show the simulated radial distributions <strong>of</strong> gas <strong>and</strong> <strong>oil</strong> saturation, in<br />
which we observe that the gas is fully flushed in the movable <strong>water</strong><br />
case E <strong>and</strong> partially removed in the irreducible <strong>water</strong> case F. When<br />
the rock is at irreducible <strong>water</strong>-saturation conditions, the effect <strong>of</strong><br />
capillary forces is much higher than when the same formation is<br />
within a transition saturation zone, hence preventing the native hydrocarbon<br />
to be fully flushed by the invading fluid. Between the radial<br />
distances <strong>of</strong> 0.23 m <strong>and</strong> 0.70 m, the three phases <strong>water</strong>, <strong>oil</strong>, <strong>and</strong><br />
gas coexist.<br />
Figure 18 shows the corresponding radial distributions <strong>of</strong> electrical<br />
resistivity for each case. We observe that the electrical resistivity<br />
for case E is approximately equal to 4.5 m near the borehole wall<br />
<strong>and</strong> that it slowly decreases to 3.4 m at about 0.23 m, exhibiting<br />
another reduction below 3.4 m between the radial distances <strong>of</strong><br />
0.49 m <strong>and</strong> 0.70 m. Irreducible <strong>water</strong> saturation is altered only near<br />
the borehole wall because <strong>of</strong> the effect <strong>of</strong> overbalance pressure, <strong>and</strong><br />
it remains constant away from the borehole. We observe that case B<br />
exhibits the largest difference between flushed- <strong>and</strong> virgin-zone resistivities<br />
monotonically decreasing from 6.2 m on the borehole<br />
wall to 3.4 m in the virgin zone with a radial length <strong>of</strong> invasion<br />
shorter than 0.61 m.<br />
Figure 19 compares the simulated array-induction resistivity<br />
curves for cases E <strong>and</strong> F. The case with movable <strong>water</strong> entails radial<br />
variability <strong>of</strong> apparent-resistivity curves with a difference <strong>of</strong> only<br />
0.3 m between shallowest- <strong>and</strong> deepest-sensing curves with marginal<br />
variability between the intermediate- <strong>and</strong> deepest-sensing<br />
curves. Even though <strong>water</strong> saturation for the case <strong>of</strong> irreducible <strong>water</strong><br />
is practically constant in the radial direction, the reduction <strong>of</strong> <strong>water</strong><br />
saturation near the wellbore causes variations <strong>of</strong> the apparent-resistivity<br />
curves in the order <strong>of</strong> 0.15 m between shallowest- <strong>and</strong><br />
deepest-sensing curves. The latter situation is consistent with previously<br />
published field cases that report R10 reading higher than R90<br />
in zones remaining at irreducible <strong>water</strong> saturation La Vigne et al.,<br />
1997. Reduction <strong>of</strong> <strong>water</strong> saturation at irreducible <strong>water</strong>-saturation<br />
conditions is caused by reduction <strong>of</strong> capillary-bound <strong>water</strong> by the<br />
overbalance pressure, which is greater than the formation’s capillary<br />
pressure. As expected, Figure 19 also indicates a complete overlap<br />
between the shallowest- <strong>and</strong> deepest-sensing curves for case F.<br />
Downloaded 29 Jul 2009 to 128.83.167.137. Redistribution subject to SEG license or copyright; see Terms <strong>of</strong> Use at http://segdl.org/