Quantitative comparison of processes of oil- and water-based mud ...
Quantitative comparison of processes of oil- and water-based mud ...
Quantitative comparison of processes of oil- and water-based mud ...

You also want an ePaper? Increase the reach of your titles
YUMPU automatically turns print PDFs into web optimized ePapers that Google loves.
a)<br />
b)<br />
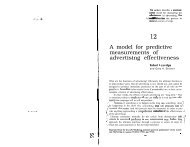
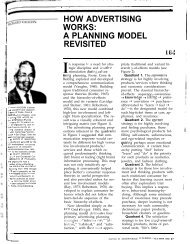
Figure 24. Two-foot vertical resolution array-induction resistivity<br />
measurements simulated after three days <strong>of</strong> WBM-filtrate invasion<br />
for gas- <strong>and</strong> <strong>oil</strong>-bearing formations represented by a <strong>and</strong> b, respectively.<br />
est-sensing curves in response to the large resistivity contrast between<br />
flushed <strong>and</strong> invaded zones. In addition, the presence <strong>of</strong> the resistivity<br />
annulus has a strong effect on the R20, R30, <strong>and</strong> R60 curves,<br />
which read lower resistivity values than R90 in cases <strong>of</strong> native gas<br />
<strong>and</strong> native <strong>oil</strong>. This behavior is emphasized more in the gas case than<br />
in the <strong>oil</strong> case.<br />
CONCLUSIONS<br />
We adapted the well-known physics <strong>of</strong> <strong>water</strong>-<strong>based</strong> <strong>mud</strong>-filtrate<br />
invasion to calculate the flow rate <strong>of</strong> <strong>oil</strong>-<strong>based</strong> <strong>mud</strong>-filtrate invasion<br />
using a commercial implicit compositional simulator. Our method<br />
considered the interplay between <strong>mud</strong> <strong>and</strong> formation properties to<br />
calculate a time-dependent flow rate that accounted for <strong>mud</strong>-cake<br />
buildup, capillary pressure, <strong>and</strong> relative permeability. From the various<br />
cases considered in the sensitivity analysis, we observed that<br />
flow rates associated with WBM-filtrate invasion are 20%–40%<br />
higher than those associated with OBM-filtrate invasion.<br />
We conclude that rock formations that exhibit large pore throats<br />
<strong>and</strong> low capillary pressure entail high flow rates <strong>and</strong> rapid spurt loss.<br />
On the other h<strong>and</strong>, rock formations that exhibit small pore throats<br />
<strong>and</strong> large capillary pressure entail instantaneous flow rates <strong>of</strong> invasion<br />
one to two order <strong>of</strong> magnitude smaller than those associated<br />
with best-quality rocks, thereby slowing down the process <strong>of</strong> <strong>mud</strong>cake<br />
buildup <strong>and</strong> entailing radially deeper invasion. Furthermore,<br />
<strong>mud</strong>-cake permeability remained as the main parameter controlling<br />
the process <strong>of</strong> <strong>mud</strong>-cake buildup <strong>and</strong> hence the total volume <strong>of</strong> fluid<br />
invading the formation. It was observed that the maximum flow rate<br />
<strong>of</strong> invasion was not affected by changes <strong>of</strong> <strong>mud</strong>-cake permeability.<br />
Simulations showed that using an integrated average flow rate <strong>of</strong><br />
invasion is equivalent to assuming an average step rate that accounts<br />
for fluid spurt losses. The high constant flow rate <strong>of</strong> invasion spurt<br />
loss observed at the onset <strong>of</strong> invasion lasted between 1/4 <strong>and</strong><br />
550 seconds, which was negligible compared with the total time <strong>of</strong><br />
invasion. Nonetheless, when using a time-dependent flow rate <strong>of</strong> invasion,<br />
we found a difference <strong>of</strong> 15% OBM <strong>and</strong> 8% WBM on the<br />
corresponding radial pr<strong>of</strong>iles <strong>of</strong> fluid saturation compared with assuming<br />
either constant or step rates. Radial distributions <strong>of</strong> fluid saturation<br />
indicated that WBM entailed radial lengths <strong>of</strong> invasion<br />
15%–20% early times larger <strong>and</strong> approximately 40% late times<br />
radially deeper than those associated with OBM-filtrate invasion.<br />
This behavior is the result <strong>of</strong> large flow rates <strong>of</strong> invasion associated<br />
with WBM compared with those associated with OBM <strong>and</strong> indicates<br />
Comparison <strong>of</strong> OBM- <strong>and</strong> WBM-filtrate invasion E71<br />
that miscibility between OBM filtrate <strong>and</strong> native <strong>oil</strong> slows down the<br />
process <strong>of</strong> invasion. The variability <strong>of</strong> fluid saturation in the invaded<br />
zone significantly affected the radial distribution <strong>of</strong> electrical resistivity.<br />
Array-induction resistivity measurements simulated from the radial<br />
distributions <strong>of</strong> electrical resistivity are affected largely by invading<br />
fluids near the wellbore. In the case <strong>of</strong> OBM filtrate invading<br />
a wet zone, we observed a large separation between apparent-resistivity<br />
curves, similar to that observed for the case <strong>of</strong> WBM filtrate invading<br />
a movable hydrocarbon-saturated zone.Alterations <strong>of</strong> wettability<br />
resulting from the presence <strong>of</strong> surfactants in the <strong>mud</strong> increased<br />
the contrast between flushed- <strong>and</strong> virgin-zone resistivities for the<br />
cases <strong>of</strong> OBM filtrate invading a partially <strong>oil</strong>-saturated rock formation.<br />
The presence <strong>of</strong> surfactants in the OBM altered the shape <strong>of</strong> the<br />
flow rate <strong>of</strong> invasion as well as radial distributions <strong>of</strong> electrical resistivity,<br />
thereby affecting the response <strong>of</strong> array-induction resistivity<br />
measurements.<br />
The large viscosity contrast between native <strong>oil</strong> <strong>and</strong> emulsified<br />
OBM resulted in a <strong>water</strong> bank, which formed a low-resistivity annulus<br />
in the invaded zone. Such an annulus arose when native <strong>oil</strong> consisted<br />
<strong>of</strong> very light liquid hydrocarbon components o0.25<br />
mPa.s. Capillary pressure <strong>and</strong> relative permeability governed the<br />
shape <strong>and</strong> contrast <strong>of</strong> the radial distribution <strong>of</strong> electrical resistivity in<br />
the invaded zone. Simulations <strong>of</strong> OBM- <strong>and</strong> WBM-filtrate invasion<br />
into gas-bearing formations indicated that the effect <strong>of</strong> capillary<br />
pressure on the radial distributions <strong>of</strong> electrical resistivity was more<br />
remarkable in <strong>oil</strong>-bearing than in gas-bearing formations.<br />
Sensitivity analyses to <strong>mud</strong> <strong>and</strong> rock properties described in this<br />
paper shed insight into the character <strong>of</strong> fluid distributions near the<br />
wellbore resulting from OBM- <strong>and</strong> WBM-filtrate invasion. Simulation<br />
<strong>of</strong> the process <strong>of</strong> invasion for three rock types confirmed the reliability<br />
<strong>of</strong> this simulation method to assess the effect <strong>of</strong> invasion on<br />
borehole resistivity measurements. These simulations can be used to<br />
improve the petrophysical interpretation <strong>of</strong> other logging measurements,<br />
including those acquired with nuclear <strong>and</strong> sonic tools.<br />
ACKNOWLEDGMENTS<br />
A note <strong>of</strong> sincere gratitude goes to Peter Day, John Rasmus, Tom<br />
Barber, <strong>and</strong> two anonymous reviewers for their constructive technical<br />
<strong>and</strong> editorial comments that improved the quality <strong>of</strong> the original<br />
manuscript. The work reported in this paper was funded by the University<br />
<strong>of</strong> Texas at Austin Research Consortium on Formation Evaluation,<br />
jointly sponsored by Anadarko, Aramco, Baker Atlas, BHP<br />
Billiton, BP, British Gas, ConocoPhillips, Chevron, ENI E&P, ExxonMobil,<br />
Halliburton Energy Services, Hydro, Marathon Oil Corporation,<br />
Mexican Institute for Petroleum, Occidental Petroleum Corporation,<br />
Petrobras, Schlumberger, Shell International E&P, Stat<strong>oil</strong>,<br />
TOTAL, <strong>and</strong> Weatherford.<br />
APPENDIX A<br />
BROOKS-COREY’S CAPILLARY PRESSURE AND<br />
RELATIVE PERMEABILITY EQUATIONS<br />
We assume the model proposed by Brooks <strong>and</strong> Corey 1966 to<br />
calculate the saturation-dependent relative permeability <strong>and</strong> capillary<br />
pressure curves. In this model, wetting-phase k rw <strong>and</strong> nonwetting<br />
phase k rnw parametric relative permeability curves Delshad<br />
<strong>and</strong> Pope, 1989 are respectively given by<br />
Downloaded 29 Jul 2009 to 128.83.167.137. Redistribution subject to SEG license or copyright; see Terms <strong>of</strong> Use at http://segdl.org/