Quantitative comparison of processes of oil- and water-based mud ...
Quantitative comparison of processes of oil- and water-based mud ...
Quantitative comparison of processes of oil- and water-based mud ...

Create successful ePaper yourself
Turn your PDF publications into a flip-book with our unique Google optimized e-Paper software.
E70 Salazar <strong>and</strong> Torres-Verdín<br />
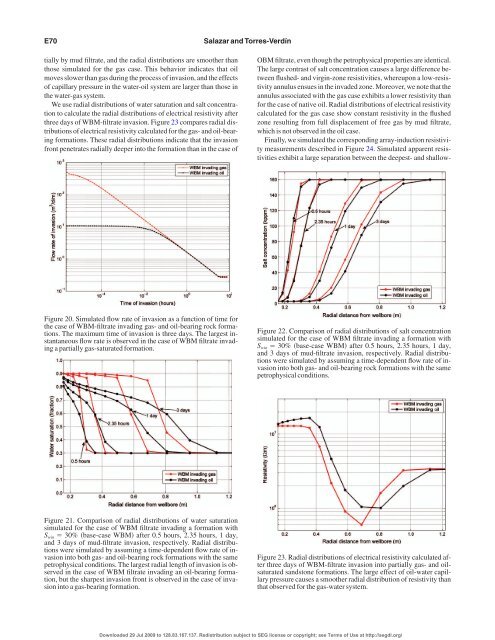
tially by <strong>mud</strong> filtrate, <strong>and</strong> the radial distributions are smoother than<br />
those simulated for the gas case. This behavior indicates that <strong>oil</strong><br />
moves slower than gas during the process <strong>of</strong> invasion, <strong>and</strong> the effects<br />
<strong>of</strong> capillary pressure in the <strong>water</strong>-<strong>oil</strong> system are larger than those in<br />
the <strong>water</strong>-gas system.<br />
We use radial distributions <strong>of</strong> <strong>water</strong> saturation <strong>and</strong> salt concentration<br />
to calculate the radial distributions <strong>of</strong> electrical resistivity after<br />
three days <strong>of</strong> WBM-filtrate invasion. Figure 23 compares radial distributions<br />
<strong>of</strong> electrical resistivity calculated for the gas- <strong>and</strong> <strong>oil</strong>-bearing<br />
formations. These radial distributions indicate that the invasion<br />
front penetrates radially deeper into the formation than in the case <strong>of</strong><br />
Figure 20. Simulated flow rate <strong>of</strong> invasion as a function <strong>of</strong> time for<br />
the case <strong>of</strong> WBM-filtrate invading gas- <strong>and</strong> <strong>oil</strong>-bearing rock formations.<br />
The maximum time <strong>of</strong> invasion is three days. The largest instantaneous<br />
flow rate is observed in the case <strong>of</strong> WBM filtrate invading<br />
a partially gas-saturated formation.<br />
Figure 21. Comparison <strong>of</strong> radial distributions <strong>of</strong> <strong>water</strong> saturation<br />
simulated for the case <strong>of</strong> WBM filtrate invading a formation with<br />
S win 30% base-case WBM after 0.5 hours, 2.35 hours, 1 day,<br />
<strong>and</strong> 3 days <strong>of</strong> <strong>mud</strong>-filtrate invasion, respectively. Radial distributions<br />
were simulated by assuming a time-dependent flow rate <strong>of</strong> invasion<br />
into both gas- <strong>and</strong> <strong>oil</strong>-bearing rock formations with the same<br />
petrophysical conditions. The largest radial length <strong>of</strong> invasion is observed<br />
in the case <strong>of</strong> WBM filtrate invading an <strong>oil</strong>-bearing formation,<br />
but the sharpest invasion front is observed in the case <strong>of</strong> invasion<br />
into a gas-bearing formation.<br />
OBM filtrate, even though the petrophysical properties are identical.<br />
The large contrast <strong>of</strong> salt concentration causes a large difference between<br />
flushed- <strong>and</strong> virgin-zone resistivities, whereupon a low-resistivity<br />
annulus ensues in the invaded zone. Moreover, we note that the<br />
annulus associated with the gas case exhibits a lower resistivity than<br />
for the case <strong>of</strong> native <strong>oil</strong>. Radial distributions <strong>of</strong> electrical resistivity<br />
calculated for the gas case show constant resistivity in the flushed<br />
zone resulting from full displacement <strong>of</strong> free gas by <strong>mud</strong> filtrate,<br />
which is not observed in the <strong>oil</strong> case.<br />
Finally, we simulated the corresponding array-induction resistivity<br />
measurements described in Figure 24. Simulated apparent resistivities<br />
exhibit a large separation between the deepest- <strong>and</strong> shallow-<br />
Figure 22. Comparison <strong>of</strong> radial distributions <strong>of</strong> salt concentration<br />
simulated for the case <strong>of</strong> WBM filtrate invading a formation with<br />
S win 30% base-case WBM after 0.5 hours, 2.35 hours, 1 day,<br />
<strong>and</strong> 3 days <strong>of</strong> <strong>mud</strong>-filtrate invasion, respectively. Radial distributions<br />
were simulated by assuming a time-dependent flow rate <strong>of</strong> invasion<br />
into both gas- <strong>and</strong> <strong>oil</strong>-bearing rock formations with the same<br />
petrophysical conditions.<br />
Figure 23. Radial distributions <strong>of</strong> electrical resistivity calculated after<br />
three days <strong>of</strong> WBM-filtrate invasion into partially gas- <strong>and</strong> <strong>oil</strong>saturated<br />
s<strong>and</strong>stone formations. The large effect <strong>of</strong> <strong>oil</strong>-<strong>water</strong> capillary<br />
pressure causes a smoother radial distribution <strong>of</strong> resistivity than<br />
that observed for the gas-<strong>water</strong> system.<br />
Downloaded 29 Jul 2009 to 128.83.167.137. Redistribution subject to SEG license or copyright; see Terms <strong>of</strong> Use at http://segdl.org/