Southwest Airlines
Southwest Airlines
Southwest Airlines

You also want an ePaper? Increase the reach of your titles
YUMPU automatically turns print PDFs into web optimized ePapers that Google loves.
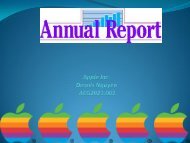
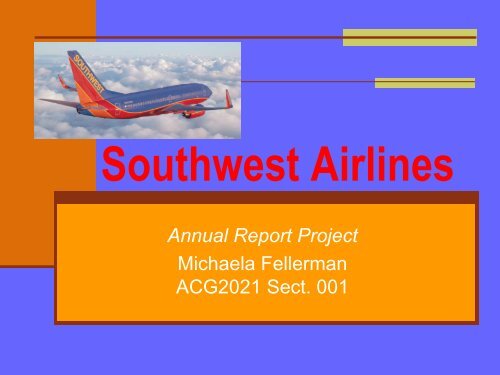
<strong>Southwest</strong> <strong>Airlines</strong><br />
Annual Report Project<br />
Michaela Fellerman<br />
ACG2021 Sect. 001
Executive Summary<br />
In today’s economy, less and less people are willing to<br />
spend money on air travel. <strong>Southwest</strong> <strong>Airlines</strong> is a low-cost<br />
airline that is profitable in this economic climate. They are one of<br />
the world’s most profitable airlines, posting profits for 35 years<br />
straight. It’s the largest airline in the United States and carries<br />
the most passengers of any airline in the world.<br />
With the economy in turmoil, <strong>Southwest</strong> is moving forward<br />
with caution. They are not increasing the size of their fleet or<br />
charging higher prices to offset higher energy costs, which puts<br />
them in high demand for American travelers. With their popular<br />
Web site and strong focus on convenience and customer<br />
service, <strong>Southwest</strong> may survive the turbulent times ahead.<br />
http://www.southwest.com/investor_relations/fs_financials.html
Introduction<br />
Chief Executive Officer: Gary Kelly<br />
Location of Home Office: Dallas, Texas<br />
Ending Date of Last Fiscal Year: December 31, 2007<br />
Principal Services: Low-fare, point-to-point airline carrier<br />
Main Geographic Area of Activity: <strong>Southwest</strong> provides domestic<br />
flights to 64 cities in 32 states.
Audit Report<br />
Company’s Independent Auditors: Ernst & Young LLP based in<br />
Dallas Texas<br />
The auditors though that <strong>Southwest</strong> <strong>Airlines</strong> Company’s<br />
financial statements, operations and cash flows, presented<br />
objectively their financial position in the year that ended<br />
December 31, 2007. They also believed that <strong>Southwest</strong><br />
maintained effective internal control over financial reporting.
Stock Market Information<br />
Most Recent Price of Stock: $13.44<br />
Twelve Month Trading Range: $11.02 – $16.77<br />
Dividends Per Share: $0.02<br />
Date of Above Information: October 3, 2008<br />
I would suggest to hold <strong>Southwest</strong> <strong>Airlines</strong> stock because they<br />
are in a better position than other airline companies in today’s<br />
economy.
Industry Situation and<br />
Company Plans<br />
In the airline industry, steeply rising energy prices continue<br />
to be a challenge. Spending on air travel has decreased<br />
relative to the nation’s economy. However, while crude oil<br />
prices are currently selling at $93.22, <strong>Southwest</strong> has locked<br />
in 70% of their oil for 2008 at a price of $51. This allows<br />
them to offer lower fares than their competitors and attract<br />
new customers. <strong>Southwest</strong> plans to meet this demand for<br />
low fares by offering more flights to more cities.<br />
www.airlines.org (2008 Economic Report by the Air Transport Association)<br />
http://www.oil-price.net/<br />
http://www.southwest.com/investor_relations/swaar07.pdf
Income Statement<br />
The format is similar to a single-step format.<br />
IN MILLIONS 2007 2006<br />
Gross Profit $2,506 $2,573<br />
Income from Operations $791 $934<br />
Net Income $645 $499<br />
The gross profit is decreasing while the net income is<br />
increasing. They’re making more revenue and less<br />
profit, which seems to indicate rising operation<br />
expenses.
Balance Sheet<br />
IN MILLIONS ASSETS = LIABILITIES + STOCK HOLDER’S<br />
EQUITY<br />
2007 16,772 = 9,831 + 6,941<br />
2006 13,460 = 7,011 + 6,449<br />
From 2006 to 2007, <strong>Southwest</strong> Airline Company increased<br />
their cash accounts, accounts receivable, inventory and<br />
equipment. The largest increase was in an account called fuel<br />
derivative contracts. Their accounts payable also increased,<br />
and their accrued expenses more than doubled. Their stock<br />
holder’s equity increased slightly. Their common stock stayed<br />
exactly the same.
Statement of Cash Flows<br />
Cash flows from operations is greater than net income for the<br />
past two years.<br />
In 2007, the company invested less in long-term assets, such as<br />
property and equipment, than in 2006. They spent more on<br />
short-term investments.<br />
Cash decreased significantly from 2005 to 2006, yet increased<br />
almost that same amount from 2006 to 2007.
Accounting Policies<br />
Revenue Recognition<br />
tickets sold are initially deferred as “Air traffic liability”. Passenger<br />
revenue is recognized when transportation is provided<br />
Cash and Cash Equivalents:<br />
short-term, highly liquid, income-producing investments with<br />
maturities of three months or less<br />
Short-term Investments:<br />
auction rate securities with auction reset periods of less than 12<br />
months, stated at fair value<br />
Inventories:<br />
flight equipment, expendable parts, materials, aircraft fuel, and<br />
supplies<br />
Property and Equipment<br />
Depreciation is over periods generally ranging from 23 to 25 years<br />
for flight equipment and 5 to 30 years for ground property and<br />
equipment once the asset is placed in service.
Topics of Notes to<br />
Financial Statements<br />
Summary of Significant<br />
Accounting Policies<br />
Recent Accounting<br />
Developments<br />
Acquisition of Certain Assets<br />
Commitments<br />
Accrued Liabilities<br />
Revolving Credit Facility<br />
Long-Term Debt<br />
Leases<br />
Project Early Departure<br />
Derivative and Financial<br />
Instruments<br />
Comprehensive Income<br />
Common Stock<br />
Stock Plans<br />
Employee Retirement Plans<br />
Income Taxes<br />
Net Income per Share<br />
Contingencies
Financial Analysis Liquidity Ratios<br />
IN MILLIONS 2007 2006 2007 2006<br />
Working Capital 4,443 -4,838 2,601-2,887 -395 -286<br />
Current Ratio 4,443<br />
Receivable<br />
Turnover<br />
Average Days’<br />
Sales Uncollected<br />
Inventory<br />
Turnover<br />
Average Days’<br />
Inventory on<br />
Hand<br />
4,838<br />
9,861<br />
279<br />
365<br />
35.34<br />
7,056<br />
259<br />
365<br />
27.24<br />
2,601<br />
2,887<br />
9,086<br />
241<br />
365<br />
37.70<br />
6,311<br />
181<br />
365<br />
34.87<br />
.918 .901<br />
35.34 37.70<br />
10.33 9.68<br />
27.24 34.87<br />
13.4 10.47<br />
<strong>Southwest</strong> has not been very liquid at all recently. They cannot<br />
pay their bills.
Financial Analysis Profitability Ratios<br />
IN<br />
MILLIONS<br />
Profit Margin 645<br />
2007 2006 2007 2006<br />
9,861<br />
Asset Turnover 9,861<br />
16,772<br />
Return on Assets 645<br />
16,772<br />
Return on Equity 645<br />
6,941<br />
499<br />
9086<br />
9,086<br />
13,460<br />
499<br />
13,460<br />
499<br />
6,449<br />
6.5% 5.5%<br />
.5879 times .6735 times<br />
3.85% 3.71%<br />
9.3% 7.7%<br />
Profitability seems to be increasing with the exception of<br />
asset turnover.
Financial Analysis Solvency Ratio<br />
IN MILLIONS 2007 2007 2006 2006<br />
Debt to Equity 9,831<br />
6,941<br />
1.42 7,011<br />
6,449<br />
For the past two years, the solvency ratio leads me to<br />
conclude that the creditors are in control of the company.<br />
The increase in debt to equity means they’re gaining even<br />
more control.<br />
1.09
Financial Analysis<br />
Market Strength Ratios<br />
IN MILLIONS 2007 2007 2006 2006<br />
Price/earnings per<br />
share<br />
13.44<br />
.85<br />
Dividend yield .02__<br />
13.44<br />
15.81 15.32<br />
.63<br />
.149% .02__<br />
15.32<br />
The price/earnings per share went down from 2006 to 2007<br />
because there is not a lot of confidence in the market, so<br />
investors were willing to pay less per share than they earn.<br />
The dividend yield went up, so investors can expect to<br />
receive more dividends in 2007 than they did in 2006.<br />
24.32<br />
.131%