Research In Motion Limited
Research In Motion Limited
Research In Motion Limited
You also want an ePaper? Increase the reach of your titles
YUMPU automatically turns print PDFs into web optimized ePapers that Google loves.
<strong>Research</strong> <strong>In</strong> <strong>Motion</strong> <strong>Limited</strong><br />
2009 Annual Report<br />
Nathalie Dos Santos Alves<br />
ACG2021-001
Executive Summary<br />
<strong>Research</strong> <strong>In</strong> <strong>Motion</strong>’s stock prices have suffered during the last couple of<br />
years, just as the economy did. However, prices have been recovering for the<br />
last couple of months, which could be a signal of slow recovery in this industry.<br />
RIM managed to increase sales significantly during 2009, but costs and<br />
expenses also increased throughout the year, leaving the company with a 2009<br />
Net <strong>In</strong>come that is in proportion smaller than the 2008 Net <strong>In</strong>come. Assets,<br />
Liabilities, and Stockholders’ Equity increased all by significant amounts, but<br />
cash decreased from 2008 to 2009. RIM’s liquidity did not present significant<br />
changes, but its profitability clearly decreased. Overall, the 2009 fiscal year<br />
was productive for <strong>Research</strong> <strong>In</strong> <strong>Motion</strong> taking into account that the whole<br />
economy was going through many difficulties during the year. 2009 was a<br />
productive year for RIM mainly because of its significant growth in Sales and a<br />
strong Balance Sheet.<br />
<strong>Research</strong> <strong>In</strong> <strong>Motion</strong>'s 2009 Annual Report<br />
2
<strong>In</strong>troduction<br />
Jim Balsillie Co-CEO<br />
Mike Lazaridis Co-CEO & President<br />
RIM’s Home Office is located in Waterloo,<br />
Ontario, Canada<br />
Fiscal year ended February 28 th , 2009<br />
3
<strong>Research</strong> <strong>In</strong> <strong>Motion</strong> <strong>Limited</strong> (RIM) is a designer, manufacturer<br />
and marketer of wireless solutions for the worldwide mobile<br />
communications market. RIM’s most successful services and<br />
technologies are the Blackberry Smartphones, the RIM<br />
Wireless Handheld product line, and Software for Enterprises<br />
and Small Business.<br />
<strong>Research</strong> <strong>In</strong> <strong>Motion</strong> operates offices in North America, Europe<br />
and Asia Pacific. The Blackberry Smartphones are sold<br />
worldwide in more than 160 countries. The greatest<br />
concentration of sales is in North America and the smallest<br />
concentration is in Africa.<br />
4
Audit Report<br />
Ernst & Young LLP were the auditors of RIM’s 2009<br />
Annual Report<br />
The auditors audited the consolidated balance<br />
sheets for the 2008 and 2009 fiscal years, and the<br />
statements of income, shareholders’ equity, and<br />
cash flows for the 2007, 2008, and 2009 fiscal<br />
years. They said these financial statements<br />
represent accurately all material aspects in<br />
accordance to United States generally accepted<br />
accounting principles.<br />
5
Stock Market <strong>In</strong>formation<br />
The price of RIM’s stock is NASDAQ $70.13 and Toronto<br />
Stock Exchange $74.20<br />
The 52-week trading range of RIM’s stock is NASDAQ<br />
$35.05 - $88.08 and Toronto Stock Exchange $44.23 –<br />
$135.55<br />
<strong>Research</strong> in <strong>Motion</strong> has not paid dividends since the 1998<br />
fiscal year.<br />
The above information is dated February 25 th , 2010.<br />
RIM’s stock prices seem to be rising, but not at a constant<br />
rate. It is hard to guess what to do, but I think that stock<br />
should be held but not bought until a tendency to a<br />
constant increase in value can be clearly identified.<br />
6
RIM’s <strong>In</strong>dustry<br />
Situation and Plans<br />
<strong>Research</strong> in <strong>Motion</strong> <strong>Limited</strong> has been growing significantly during the last few<br />
years; the company is now widely known and I believe its popularity will keep<br />
growing substantially. RIM’s 2009 profits came mainly from the sales of the<br />
Blackberry Smartphones. Blackberry was the number one selling smartphone brand<br />
in North America, and number two Worldwide.<br />
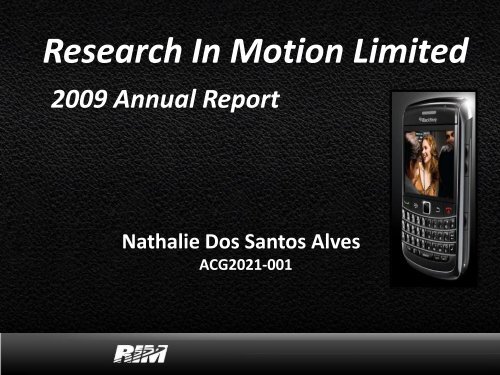
1 Qwerty Slider Blackberry Device<br />
1 During 2009 RIM launched many<br />
successful devices, such as the Blackberry Bold 9700, Blackberry Tour 9630,<br />
Blackberry Storm 9550, and Blackberry Curve 8500. RIM is already working in two<br />
more devices: the Blackberry Tour 9650 (which would be launched very soon) and<br />
the first Blackberry Slider. 2 The company is constantly upgrading the Blackberry<br />
Software and the number of available applications in the Blackberry Application<br />
World has been increasing at a very fast rate. RIM is also opened to new partnerships<br />
that could enhance the company and bring benefits and prosperity.<br />
2 Blackberry Smartphones were #2 Most sold in 2009<br />
7
<strong>In</strong>come Statement<br />
RIM’s accountants use a Multistep <strong>In</strong>come Statement.<br />
2009<br />
(in thousands of US $)<br />
2008<br />
(in thousands of US $)<br />
% Change<br />
2008-2009<br />
Gross Profit 5,097,298 3,080,581 65%<br />
<strong>In</strong>come from Operations 2,722,096 1,731,159 57%<br />
Net <strong>In</strong>come 1,892,616 1,293,867 46%<br />
Gross Profit, <strong>In</strong>come from Operations, and Net <strong>In</strong>come increased by 65,<br />
57 and 46% respectively from 2008 to 2009. These increases are evidences<br />
of the growth of <strong>Research</strong> <strong>In</strong> <strong>Motion</strong>. However, the 2009 Net <strong>In</strong>come<br />
constitutes less than 40% of the Gross profit, whereas the 2008 Net<br />
<strong>In</strong>come was over 45% of the Gross Profit. This tells us that the expenses<br />
increased significantly over the year.<br />
8
Balance Sheet<br />
Assets =<br />
(in thousands of US $)<br />
= Liabilities<br />
(in thousands of US $)<br />
+ Stockholders’ Equity<br />
(in thousands of US $)<br />
2009 8,101,372 = 2,227,244 + 5,874,128<br />
2008 5,511,187 = 1,577,621 + 3,933,566<br />
% Change<br />
2008-2009<br />
47% 41% 49%<br />
There was a clear increase in the three accounts. Stockholders’<br />
Equity leads with an increase of 49% from 2008 to 2009 fiscal year,<br />
which means that more common stock was sold and/or earnings<br />
retained than liabilities incurred during 2009.<br />
9
Statement of Cash Flows<br />
(<strong>In</strong> thousands of Unites States dollars)<br />
2009 2008<br />
Cash Flows from Operations 1,451,845 1,576,759<br />
Net <strong>In</strong>come 1,892,616 1,293,867<br />
Cash Flows from Operations was less than Net <strong>In</strong>come in the 2009 fiscal<br />
year. The difference between both numbers amounts to almost $450<br />
billion. <strong>In</strong> the 2008 fiscal year Cash Flows from Operations surpassed Net<br />
<strong>In</strong>come by almost $200 billion.<br />
<strong>In</strong> 2009 RIM increased the acquisition of capital and intangible assets and<br />
decreased the acquisition of long-term investments with respect to 2008.<br />
RIM’s primary source of financing are stock sales.<br />
Cash increased over the 2008 fiscal year from $677,144 to $1,184,398.<br />
Over the 2009 fiscal year cash decreased from $1,184,398 to $835,546.<br />
10
Accounting Policies<br />
Revenue Recognition: “The Company recognizes revenue when it is<br />
realized or realizable and earned. The Company considers revenue realized<br />
or realizable and earned when it has persuasive evidence of an<br />
arrangement, the product has been delivered or the services have been<br />
provided to the customer, the sales price is fixed or determinable and<br />
collectability is reasonably assured.”<br />
Cash and cash equivalents: “Cash and cash equivalents consist of balances<br />
with banks and liquid investments with maturities of three months or less<br />
at the date of acquisition and are carried on the consolidated balance<br />
sheets at fair value.”<br />
Short-term investments: “<strong>In</strong>vestments with maturities of less than one<br />
year, as well as any investments that management intends to hold for less<br />
than one year, are classified as Short-term investments.”<br />
11
Accounting Policies<br />
<strong>In</strong>ventories: “Raw materials are stated at the lower of cost and replacement<br />
cost. Work in process and finished goods inventories are stated at the lower<br />
of cost and net realizable value. Cost includes the cost of materials plus<br />
direct labor applied to the product and the applicable share of<br />
manufacturing overhead. Cost is determined on a first-in-first-out basis.”<br />
Capital assets: “Capital assets are stated at cost less accumulated<br />
amortization. No amortization is provided for construction in progress until<br />
the assets are ready for use. Amortization is provided using the following<br />
rates and methods:<br />
- Buildings, leaseholds and other<br />
- Blackberry operations and other information technology<br />
- Manufacturing equipment, research and development equipment and tooling<br />
- Furniture and fixtures<br />
- Straight-line over terms between 5 and 40 years<br />
- Straight-line over terms between 3 and 5 years<br />
- Straight-line over terms between 2 and 8 years<br />
- Declining balance at 20% per annum.”<br />
12
Topics of the Notes to<br />
The Financial Statements<br />
Summary of Significant Accounting Policies<br />
Adoption of Accounting Policies<br />
Recently Issued Pronouncements<br />
Cash and Cash Equivalents and<br />
<strong>In</strong>vestments<br />
<strong>In</strong>ventory<br />
Capital Assets<br />
<strong>In</strong>tangible Assets<br />
Business Acquisitions<br />
<strong>In</strong>come Taxes<br />
Long-Term Debt<br />
Capital Stock<br />
Commitments and Contingencies<br />
Product Warranty<br />
Earnings Per Share<br />
Comprehensive <strong>In</strong>come (Loss)<br />
Supplemental <strong>In</strong>formation<br />
Financial <strong>In</strong>struments<br />
Segment Disclosures<br />
Subsequent Events<br />
13
Financial Analysis<br />
Liquidity Ratios<br />
(<strong>In</strong> times, unless otherwise indicated)<br />
2009 2008<br />
Working Capital $2,726,235,000 $2,002,923,000<br />
Current Ratio 2.29 2.36<br />
Receivable Turnover 6.73 6.88<br />
Average Days’ Sales Uncollected 54.21 53.07<br />
<strong>In</strong>ventory Turnover 11.07 8.98<br />
Average Days’ <strong>In</strong>ventory on Hand 32.99 40.64<br />
Even though Working Capital increased about 35% from 2008 to 2009, the Current Ratio decreased<br />
from 2.36 to 2.29 times. This indicates that Current Liabilities increased proportionally more than<br />
Current Assets. Receivable Turnover also decreased from 6.88 to 6.73 times, and consequently<br />
Average Days’ Sales Uncollected increased. <strong>In</strong>ventory Turnover increased from 11.07 to 8.98 times;<br />
therefore, Average Days’ <strong>In</strong>ventory on Hand decreased from 40.64 to 32.99 times. Overall, these ratios<br />
tell us that <strong>Research</strong> <strong>In</strong> <strong>Motion</strong> is selling its inventory faster, but the company is taking more time to<br />
collect the receivables. Therefore, RIM’s liquidity stayed relatively the same.<br />
14
Financial Analysis<br />
Profitability Ratios<br />
(<strong>In</strong> percentages, unless otherwise indicated)<br />
2009 2008<br />
Profit Margin 17.10 21.53<br />
Asset Turnover 1.63 times 1.40 times<br />
Return on Assets 27.81 30.09<br />
Return on Equity 38.59 40.33<br />
Profit Margin decreased by around 20%; this tells us that the cost of goods sold and/or expenses<br />
increased at a greater rate than net sales. The Asset Turnover, which increased from 1.63 to 1.40 times,<br />
tells us that RIM used its assets to produce sales more efficiently during 2009 than during 2008.<br />
However, Return on Assets decreased by around 8%. This confirms the profit margin results: Sales<br />
increased, but Net <strong>In</strong>come constitutes a smaller part of Sales in 2009 than in 2008. This explains a<br />
decrease in both, Profit Margin and Return on Assets. Return on Equity also decreased from 40.33 to<br />
38.59 times. Overall, RIM’s profitability decreased during 2009.<br />
15
Financial Analysis<br />
Solvency Ratio<br />
2009 2008<br />
(<strong>In</strong> percentages)<br />
Debt to Equity 37.92 40.11<br />
Debt to Equity decreased by around 5%. This is a good<br />
signal because it indicates that in 2009, Stockholders’<br />
Equity increased at a greater rate than Liabilities.<br />
Therefore, <strong>Research</strong> in <strong>Motion</strong> is mainly being controlled<br />
by its stockholders instead of by its creditors.<br />
16
Financial Analysis<br />
Market Strength Ratios<br />
2009 2008<br />
Price/Earnings per Share Basic Diluted Basic Diluted<br />
NASDAQ 26.26 26.66 35.45 36.24<br />
Toronto Stock Exchange 28.10 28.52 36.35 37.15<br />
On average, <strong>Research</strong> <strong>In</strong> <strong>Motion</strong>’s 2009 Stock Prices were higher than<br />
its 2008 Stock Prices, in both the NASDAQ and Toronto Stock Exchange.<br />
The decrease in Price/Earnings per Share in 2009 was mainly because<br />
Earnings per Share increased significantly from 2008 to 2009. This is<br />
definitely good news to RIM’s stockholders.<br />
<strong>Research</strong> in <strong>Motion</strong> has not paid dividends since the 1998 fiscal year.<br />
RIM has retained all the earnings and reinvested them because its current<br />
main purpose is to stimulate the growth of the Company.<br />
17


