1 MAC1105, College Algebra Study Questions for Common Final ...
1 MAC1105, College Algebra Study Questions for Common Final ...
1 MAC1105, College Algebra Study Questions for Common Final ...

Create successful ePaper yourself
Turn your PDF publications into a flip-book with our unique Google optimized e-Paper software.
c The average rate of change <strong>for</strong> the given line is -600 dollars per mpg. As the mpg rating<br />
increases, the tax paid goes down by $600 per mpg.<br />
20. y = -x -2 and y = 2x – 8 is the system, and the solution is (2, -4). Check: -2 – 2 = -4 and 2 ∙ 2 – 8 =<br />
-4, and thus the claimed solution works.<br />
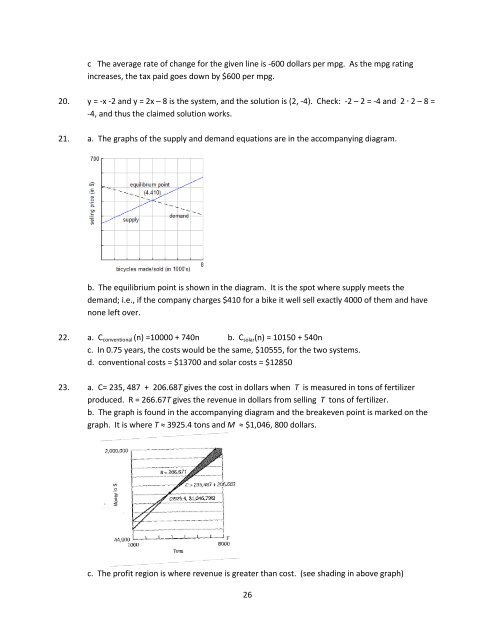
21. a. The graphs of the supply and demand equations are in the accompanying diagram.<br />
b. The equilibrium point is shown in the diagram. It is the spot where supply meets the<br />
demand; i.e., if the company charges $410 <strong>for</strong> a bike it well sell exactly 4000 of them and have<br />
none left over.<br />
22. a. Cconventional (n) =10000 + 740n b. Csolar(n) = 10150 + 540n<br />
c. In 0.75 years, the costs would be the same, $10555, <strong>for</strong> the two systems.<br />
d. conventional costs = $13700 and solar costs = $12850<br />
23. a. C= 235, 487 + 206.68T gives the cost in dollars when T is measured in tons of fertilizer<br />
produced. R = 266.67T gives the revenue in dollars from selling T tons of fertilizer.<br />
b. The graph is found in the accompanying diagram and the breakeven point is marked on the<br />
graph. It is where T ≈ 3925.4 tons and M ≈ $1,046, 800 dollars.<br />
c. The profit region is where revenue is greater than cost. (see shading in above graph)<br />
26