Market Share Leaders - Advertising Age
Market Share Leaders - Advertising Age
Market Share Leaders - Advertising Age

Create successful ePaper yourself
Turn your PDF publications into a flip-book with our unique Google optimized e-Paper software.
1 June 25, 2012 | <strong>Advertising</strong> <strong>Age</strong><br />
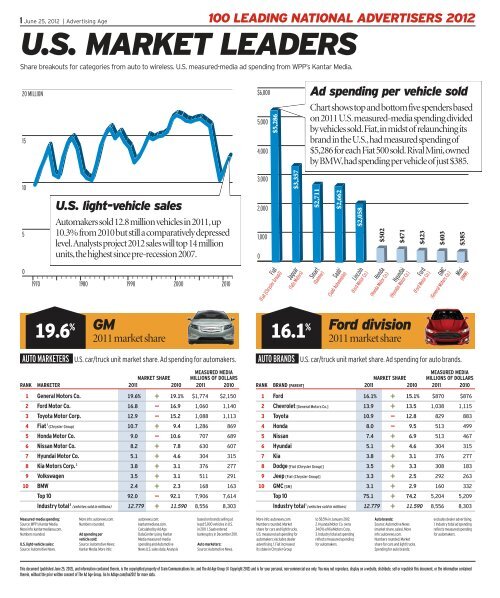
U.S. MARKET LEADERS<br />
<strong>Share</strong> breakouts for categories from auto to wireless. U.S. measured-media ad spending from WPP’s Kantar Media.<br />
20 MILLION<br />
15<br />
10<br />
5<br />
0<br />
1970<br />
AUTO MARKETERSN U.S. car/truck unit market share. Ad spending for automakers.<br />
MARKET SHARE<br />
MEASURED MEDIA<br />
MILLIONS OF DOLLARS<br />
RANK MARKETER 2011 2010 2011 2010<br />
1<br />
2<br />
General Motors Co.<br />
Ford Motor Co.<br />
19.6%<br />
16.8<br />
+<br />
-<br />
19.1%<br />
16.9<br />
$1,774<br />
1,060<br />
$2,150<br />
1,140<br />
3 Toyota Motor Corp. 12.9 - 15.2 1,088 1,113<br />
4 Fiat 1 (Chrysler Group) 10.7 + 9.4 1,286 869<br />
5 Honda Motor Co. 9.0 - 10.6 707 689<br />
6 Nissan Motor Co. 8.2 + 7.8 630 607<br />
7 Hyundai Motor Co. 5.1 + 4.6 304 315<br />
8 Kia Motors Corp. 2<br />
3.8 + 3.1 376 277<br />
9 Volkswagen 3.5 + 3.1 511 291<br />
10 BMW 2.4 + 2.3 168 163<br />
Top 10 92.0 - 92.1 7,906 7,614<br />
Industry total 3 (vehicles sold in millions) 12.779 + 11.590 8,556 8,303<br />
Measured-media spending:<br />
Source: WPP’s Kantar Media.<br />
More info: kantarmediana.com.<br />
Numbers rounded.<br />
U.S. light-vehicle sales:<br />
Source: Automotive News.<br />
U.S. light-vehicle sales<br />
Automakers sold 12.8 million vehicles in 2011,up<br />
10.3% from 2010 but still a comparatively depressed<br />
level.Analysts project 2012 sales will top 14 million<br />
units,the highest since pre-recession 2007.<br />
1980<br />
More info: autonews.com.<br />
Numbers rounded.<br />
Ad spending per<br />
vehicle sold:<br />
Source: Automotive News;<br />
Kantar Media. More info:<br />
1990<br />
2000<br />
autonews.com;<br />
kantarmediana.com.<br />
Calculated by Ad <strong>Age</strong><br />
DataCenter using Kantar<br />
Media measured-media<br />
spending and Automotive<br />
News U.S. sales data. Analysis<br />
100 LEADING NATIONAL ADVERTISERS 2012<br />
2010<br />
based on brands selling at<br />
least 5,000 vehicles in U.S.<br />
in 2011. 1. Saab entered<br />
bankruptcy in December 2011.<br />
Auto marketers:<br />
Source: Automotive News.<br />
Fiat<br />
(Fiat [Chrysler Group])<br />
19.6 % Ford division<br />
16.1 %<br />
GM<br />
2011 market share<br />
$6,000<br />
5,000<br />
4,000<br />
3,000<br />
2,000<br />
1,000<br />
0<br />
$5,286<br />
Jaguar<br />
$3,357<br />
(Tata Motors)<br />
AUTO BRANDSN U.S. car/truck unit market share. Ad spending for auto brands.<br />
MARKET SHARE<br />
MEASURED MEDIA<br />
MILLIONS OF DOLLARS<br />
RANK BRAND [PARENT] 2011 2010 2011 2010<br />
1<br />
2<br />
Ford<br />
Chevrolet [General Motors Co.]<br />
16.1%<br />
13.9<br />
+<br />
+<br />
15.1%<br />
13.5<br />
$870<br />
1,038<br />
$876<br />
1,115<br />
3 Toyota 10.9 - 12.8 829 883<br />
4 Honda 8.0 - 9.5 513 499<br />
5 Nissan 7.4 + 6.9 513 467<br />
6 Hyundai 5.1 + 4.6 304 315<br />
7 Kia 3.8 + 3.1 376 277<br />
8 Dodge [Fiat (Chrysler Group)] 3.5 + 3.3 308 183<br />
9 Jeep [Fiat (Chrysler Group)] 3.3 + 2.5 292 263<br />
10 GMC [GM] 3.1 + 2.9 160 332<br />
Top 10 75.1 + 74.2 5,204 5,209<br />
Industry total 1 (vehicles sold in millions) 12.779 + 11.590 8,556 8,303<br />
More info: autonews.com.<br />
Numbers rounded. <strong>Market</strong><br />
share for cars and light trucks.<br />
U.S. measured ad spending for<br />
automakers; excludes dealer<br />
advertising. 1. Fiat increased<br />
its stake in Chrysler Group<br />
Ad spending per vehicle sold<br />
Chart shows top and bottom five spenders based<br />
on 2011 U.S.measured-media spending divided<br />
by vehicles sold.Fiat,in midst of relaunching its<br />
brand in the U.S.,had measured spending of<br />
$5,286 for each Fiat 500 sold.Rival Mini,owned<br />
by BMW,had spending per vehicle of just $385.<br />
Smart<br />
$2,711<br />
(Daimler)<br />
$2,662<br />
Saab 1<br />
(Saab Automobile)<br />
Lincoln<br />
to 58.5% in January 2012.<br />
2. Hyundai Motor Co. owns<br />
34.0% of Kia Motors Corp.<br />
3. Industry total ad spending<br />
reflects measured spending<br />
for automakers.<br />
$2,058<br />
(Ford Motor Co.)<br />
Honda<br />
$502<br />
(Honda Motor Co.)<br />
$471<br />
2011 market share<br />
Hyundai<br />
(Hyundai Motor Co.)<br />
Auto brands:<br />
Source: Automotive News<br />
(market share, sales). More<br />
info: autonews.com.<br />
Numbers rounded. <strong>Market</strong><br />
share for cars and light trucks.<br />
Spending for auto brands;<br />
$423<br />
Ford<br />
(Ford Motor Co.)<br />
$403<br />
GMC<br />
(General Motors Co.)<br />
$385<br />
Mini<br />
(BMW)<br />
excludes dealer advertising.<br />
1. Industry total ad spending<br />
reflects measured spending<br />
for automakers.<br />
This document (published June 25, 2012), and information contained therein, is the copyrighted property of Crain Communications Inc. and The Ad <strong>Age</strong> Group (© Copyright 2012) and is for your personal, non-commercial use only. You may not reproduce, display on a website, distribute, sell or republish this document, or the information contained<br />
therein, without the prior written consent of The Ad <strong>Age</strong> Group. Go to Ad<strong>Age</strong>.com/lna2012 for more data.
2 June 25, 2012 | <strong>Advertising</strong> <strong>Age</strong><br />
Largest personal-care advertisers<br />
Based on 2011 U.S.measured-media ad spending.Total U.S.<br />
personal-care ad spending: $6.5 billion.Procter & Gamble,the<br />
nation’s (and world’s) top advertiser,accounted for 27.6% of that.<br />
U.S. AD SPENDING ($ MILLIONS)<br />
All other $1,339<br />
Kao Corp. $129<br />
GlaxoSmithKline<br />
$137<br />
Kimberly-Clark<br />
Corp. $151<br />
Revlon $159<br />
Coty $258<br />
Estée Lauder Cos. $271<br />
Unilever $462<br />
2.0%<br />
2.1%<br />
2.3%<br />
2.4%<br />
4.0%<br />
4.2%<br />
20.5% 27.6%<br />
Total<br />
$6,527<br />
7.1% 7.5%<br />
20.4%<br />
PERSONAL-CARE BRANDSN Most-advertised personal-care brands.<br />
Procter & Gamble Co. $1,798<br />
L’Oréal $1,330<br />
Johnson & Johnson $492<br />
MEASURED MEDIA<br />
SHARE OF ADVERTISING MILLIONS OF DOLLARS<br />
RANK BRAND [PARENT] 2011 2010 2011 2010<br />
1 L’Oréal Paris [L’Oréal] 7.6% + 7.1% $496 $439<br />
2 Olay [Procter & Gamble Co.] 4.8 - 5.0 313 306<br />
3 CoverGirl [P&G] 4.7 + 3.9 305 242<br />
4 Maybelline New York [L’Oréal] 4.6 + 4.1 300 256<br />
5 Garnier [L’Oréal] 4.0 + 3.7 263 228<br />
6 Crest [P&G] 3.5 + 2.8 229 173<br />
7 Dove [Unilever] 2.9 - 3.4 187 209<br />
8 Gillette [P&G] 2.8 - 3.2 186 196<br />
9 Pantene [P&G] 2.1 - 2.4 140 147<br />
10 Neutrogena [Johnson & Johnson] 2.0 = 2.0 133 124<br />
Top 10 39.1 + 37.6 2,551 2,320<br />
Total category ad spending 100.0 = 100.0 6,527 6,173<br />
U.S. AD SPENDING ($ MILLIONS)<br />
Henkel $13<br />
Sun Products Corp. $41<br />
Energizer Holdings $65<br />
Koch Industries $125<br />
Kimberly-Clark<br />
Corp. $129<br />
Church & Dwight Co.<br />
$151<br />
Reckitt Benckiser $181<br />
6.6%<br />
6.8%<br />
7.9%<br />
All other $131<br />
0.7%<br />
2.2%<br />
3.4%<br />
9.6%<br />
6.9%<br />
Total<br />
$1,897<br />
10.2%<br />
11.2%<br />
34.5%<br />
Procter & Gamble Co. $655<br />
L'Oréal Paris<br />
7.6 Brand’s share of ad spending<br />
% Clorox<br />
6.2 Brand’s share of ad spending<br />
%<br />
Measured-media spending:<br />
Source: WPP’s Kantar Media.<br />
More info: kantarmediana.com.<br />
Numbers rounded.<br />
Personal-care advertisers:<br />
Source: Ad <strong>Age</strong> DataCenter<br />
analysis of Kantar Media U.S.<br />
measured-media spending.<br />
Numbers rounded. <strong>Share</strong><br />
shown is company’s share of<br />
U.S. personal-care measuredmedia<br />
spending. Total<br />
spending and share<br />
calculations based on ad<br />
spending for Kantar Media’s<br />
industry classifications for<br />
Cosmetics & Beauty Aids<br />
(D100); Personal Hygiene &<br />
Health (D200); Hair Products &<br />
Accessories (D300); and Men’s<br />
Toiletries, Hygienic Goods &<br />
Skin Care (D400).<br />
Personal-care brands:<br />
Source: Ad <strong>Age</strong> DataCenter<br />
analysis of Kantar Media U.S.<br />
measured-media spending.<br />
Numbers rounded. <strong>Share</strong> of<br />
advertising and industry total<br />
100 LEADING NATIONAL ADVERTISERS 2012<br />
category ad spending based<br />
on Kantar Media’s industry<br />
classifications for Cosmetics &<br />
Beauty Aids (D100); Personal<br />
Hygiene & Health (D200); Hair<br />
Products & Accessories (D300);<br />
and Men’s Toiletries, Hygienic<br />
Goods & Skin Care (D400).<br />
Largest household-product advertisers<br />
Based on 2011 U.S.measured-media ad spending.Total U.S.<br />
household-product ad spending:$1.9 billion.P&G accounted<br />
for more than one-third of total spending.<br />
HOUSEHOLD-PRODUCT BRANDSN Most-advertised household products.<br />
SC Johnson $213<br />
Clorox Co. $193<br />
MEASURED MEDIA<br />
SHARE OF ADVERTISING MILLIONS OF DOLLARS<br />
RANK BRAND [PARENT] 2011 2010 2011 2010<br />
1 Clorox [Clorox Co.] 6.2% + 6.0% $117 $141<br />
2 Febreze [Procter & Gamble Co.] 6.0 + 5.6 114 131<br />
3 Tide [P&G] 5.3 - 7.5 100 177<br />
4 Glade [SC Johnson] 5.0 - 5.7 94 133<br />
5 Charmin [P&G] 4.2 + 3.0 80 71<br />
6 OxiClean [Church & Dwight Co.] 4.0 + 2.9 76 67<br />
7 Bounty [P&G] 3.9 + 3.3 73 77<br />
8 Energizer [Energizer Holdings] 3.4 + 2.5 65 60<br />
9 Lysol [Reckitt Benckiser] 3.1 - 3.2 59 75<br />
10 Arm & Hammer [Church & Dwight] 2.7 + 2.3 52 54<br />
Top 10 43.7 + 41.8 830 985<br />
Total category ad spending 100.0 = 100.0 1,897 2,356<br />
Household-product<br />
advertisers:<br />
Source: Ad <strong>Age</strong> DataCenter<br />
analysis of Kantar Media U.S.<br />
measured-media spending.<br />
Numbers rounded. <strong>Share</strong><br />
shown is company’s share of<br />
U.S. personal-care measuredmedia<br />
spending. Total<br />
spending and share<br />
calculations based on ad<br />
spending for Kantar Media’s<br />
industry classifications for<br />
Household Supplies (H300);<br />
and Household Soaps,<br />
Cleansers & Polishes (H400).<br />
Household-product brands:<br />
Source: Ad <strong>Age</strong> DataCenter<br />
analysis of Kantar Media U.S.<br />
measured-media spending.<br />
Numbers rounded. <strong>Share</strong> of<br />
advertising and industry total<br />
category ad spending based<br />
on Kantar Media’s industry<br />
classifications for Household<br />
Supplies (H300); and<br />
Household Soaps, Cleansers<br />
& Polishes (H400).
3 June 25, 2012 | <strong>Advertising</strong> <strong>Age</strong><br />
2.0<br />
1.0<br />
0.5<br />
0<br />
U.S. box office<br />
The number of movie tickets sold in the U.S.last year slumped<br />
to the lowest level seen since 1995.This marked the second<br />
consecutive year of declining ticket sales and box-office gross.<br />
Number of tickets sold (billions)<br />
No. 1 film:<br />
“Toy Story”<br />
1995<br />
MOVIE STUDIOSN <strong>Share</strong> of U.S. box-office gross sales for movie-studio companies.<br />
MEASURED MEDIA<br />
MARKET SHARE MILLIONS OF DOLLARS<br />
RANK MARKETER (SELECTED STUDIOS) 2011 2010 2011 2010<br />
1 Viacom (Paramount, MTV, Nickelodeon) 19.3% + 16.4% $484 $453<br />
2 Time Warner (Warner Bros., New Line) 17.9 - 18.2 741 693<br />
3<br />
4<br />
Sony Corp. (Columbia, Sony, TriStar)<br />
Walt Disney Co. (Disney, Marvel, Pixar)<br />
13.4<br />
12.2<br />
+<br />
-<br />
12.7<br />
14.0<br />
546<br />
363<br />
467<br />
342<br />
5 Comcast Corp. 1 (Universal, Focus Features) 11.5 + 9.1 586 492<br />
6<br />
7<br />
News Corp. (Twentieth Century Fox)<br />
Summit Entertainment<br />
11.1 - 15.5 362 441<br />
2<br />
4.0 - 5.0 144 127<br />
8 Weinstein Co. 2.9 + 0.8 152 32<br />
9 Relativity Media 2.2 + 0.1 132 26<br />
10 Lions Gate Entertainment 3 (Lionsgate) 1.8 - 4.9 93 199<br />
Top 10 96.4 - 96.6 3,603 3,272<br />
Industry total (box office, $ in billions) $10.174 - $10.565 3,812 3,562<br />
100 LEADING NATIONAL ADVERTISERS 2012<br />
Viacom<br />
19.3 2011 market share<br />
% Lipitor<br />
2.4 2011 market share<br />
%<br />
Measured-media spending:<br />
Source: WPP’s Kantar Media.<br />
More info: kantarmediana.com.<br />
Numbers rounded.<br />
U.S. box office:<br />
Source: Box Office Mojo. More<br />
info: boxofficemojo.com.<br />
2000<br />
No. 1 film:<br />
“Spider-Man”<br />
Movie studios:<br />
Source: Box Office Mojo. More<br />
info: boxofficemojo.com.<br />
Measured-media spending for<br />
movies excludes spending for<br />
DVDs. Numbers rounded.<br />
1. Comcast in January 2011<br />
bought 51% stake in<br />
2005<br />
Box-office gross sales ($ in billions)<br />
NBC Universal. 2. Lions Gate<br />
in January 2012 bought<br />
Summit Entertainment, known<br />
for its “Twilight Saga” series.<br />
3. Excluding Summit<br />
Entertainment.<br />
$12<br />
No. 1 film: “Harry Potter and<br />
the Deathly Hollows - Part 2” 6<br />
2010<br />
9<br />
3<br />
0<br />
World’s largest<br />
pharmaceutical marketers:<br />
Source: IMS Health. More info:<br />
imshealth.com.<br />
Numbers rounded. World<br />
figures include prescription<br />
and certain over-the-counter<br />
sales. U.S. figures are<br />
World’s largest pharma marketers<br />
Based on worldwide dollar sales.The United States,home<br />
to 4.5% of the world’s population,last year accounted for<br />
37.4% of the industry’s worldwide drug sales.<br />
SALES IN $ BILLIONS U.S.<br />
WORLD<br />
Pfizer, USA $25.1<br />
$56.4<br />
Novartis, Switzerland $19.2<br />
$51.6<br />
Merck & Co., USA $19.3<br />
$40.1<br />
Sanofi, France $11.8<br />
$39.5<br />
AstraZeneca, U.K. $19.9<br />
$37.0<br />
Roche, Switzerland $14.5<br />
$34.9<br />
GlaxoSmithKline, U.K. $14.2<br />
$34.5<br />
Johnson & Johnson, USA $12.1<br />
$27.7<br />
Abbott Laboratories, USA $11.5<br />
$25.9<br />
Teva, Israel $15.1<br />
$23.9<br />
PRESCRIPTION DRUGSN Best-selling drugs. <strong>Market</strong> share based on U.S. dollar sales.<br />
MEASURED MEDIA<br />
MARKET SHARE MILLIONS OF DOLLARS<br />
RANK BRAND [PARENT, POTENTIAL GENERIC COMPETITION] 2011 2010 2011 2010<br />
1 Lipitor [Pfizer, Nov. 2011] 2.41% + 2.37% $244 $272<br />
2 Plavix [Bristol-Myers Squibb/Sanofi, May 2012] 2.13 + 1.98 51 127<br />
3 Nexium [AstraZeneca, May 2014] 1.94 - 2.04 18 17<br />
4 Abilify [Bristol-Myers Squibb/Otsuka, April 2015] 1.63 + 1.49 126 156<br />
5 Advair Diskus [GlaxoSmithKline, NA] 1.44 - 1.52 137 200<br />
5 Seroquel [AstraZeneca, March 2012] 1.44 + 1.43 81 80<br />
5 Singulair [Merck, Aug. 2012] 1.44 + 1.33 73 95<br />
8 Crestor [AstraZeneca, July 2016] 1.38 + 1.23 1 70<br />
9 Cymbalta [Eli Lilly & Co., Dec. 2013] 1.16 + 1.04 100 152<br />
10 Humira 1 [Abbott Laboratories, Dec. 2016] 1.09 + 0.94 94 34<br />
Top 10 16.04 + 15.36 923 1,204<br />
Industry total (U.S. drug sales, $ in billions) $319.9 + $308.6 4,339 4,450<br />
prescription drugs including<br />
insulin.<br />
Prescription drugs:<br />
Source: IMS Health (market<br />
share); Medco Health<br />
Solutions (estimated dates for<br />
potential generic competition;<br />
data as of January 2012).<br />
More info: imshealth.com;<br />
medcohealth.com.<br />
Numbers rounded. 1. Tied for<br />
10th place with Enbrel<br />
(Amgen/Pfizer) and Remicade<br />
(Johnson & Johnson).
4 June 25, 2012 | <strong>Advertising</strong> <strong>Age</strong><br />
Verizon<br />
31.6 2011 market share<br />
% Coke<br />
14.7 2011 market share<br />
%<br />
WIRELESSN U.S. market share for wireless-service providers.<br />
MARKET SHARE<br />
MEASURED MEDIA<br />
MILLIONS OF DOLLARS<br />
RANK CARRIER [PARENT] 2011 2010 2011 2010<br />
1 Verizon Wireless 1<br />
2 AT&T<br />
31.6% + 31.3% $1,327 $1,553<br />
2<br />
26.3 - 26.6 1,410 1,562<br />
3 Sprint Nextel 3<br />
15.6 - 16.1 881 973<br />
4 T-Mobile 2 5<br />
[Deutsche Telekom]<br />
TracFone [America Movil]<br />
9.5 - 12.2 517 582<br />
4<br />
7.1 + 6.0 99 50<br />
6 MetroPCS Communications 3.2 + 2.8 117 104<br />
7 U.S. Cellular [Telephone and Data Systems] 2.1 - 2.2 92 98<br />
8 Cricket [Leap Wireless International] 1.9 + 1.8 67 86<br />
Top 8 97.3 - 99.0 4,510 5,008<br />
All other 2.8 + 0.9 506 448<br />
Industry total (subscribers in millions) 331.6 + 311.0 5,016 5,456<br />
100 LEADING NATIONAL ADVERTISERS 2012<br />
46.9 % 25.3 % A-B InBev<br />
AmEx<br />
2011 market share<br />
2011 market share<br />
BEER MARKETERSN <strong>Market</strong> share based on U.S. shipment volume (barrels).<br />
MARKET SHARE<br />
MEASURED MEDIA<br />
MILLIONS OF DOLLARS<br />
RANK MARKETER [PARENT] (DIVISION) 2011 2010 2011 2010<br />
1 Anheuser-Busch InBev 46.9% - 47.7% $513 $558<br />
2 MillerCoors 1 [SABMiller] 28.4 - 28.8 402 396<br />
3 Crown Imports 2<br />
5.7 + 5.3 94 78<br />
4 Heineken 3.8 - 3.9 125 123<br />
5 Pabst Brewing Co. 2.7 = 2.7 2 3<br />
6 North American Breweries 1.3 + 1.2 3 3<br />
7 Diageo (Guinness) 1.2 = 1.2 26 27<br />
8 D.G. Yuengling & Son 1.2 + 1.0 4 2<br />
9 Boston Beer Co. 1.2 + 1.1 31 33<br />
10 Mark Anthony Group (Mike’s Hard Lemonade) 0.7 + 0.6 12 10<br />
Top 10 93.0 - 93.5 1,210 1,235<br />
Industry total(barrels in millions 3 ) 210.2 - 213.2 1,220 1,242<br />
Measured-media spending:<br />
Source: WPP’s Kantar Media.<br />
More info: kantarmediana.com.<br />
Numbers rounded.<br />
Beer marketers:<br />
Source: Beer <strong>Market</strong>er’s<br />
Insights (U.S. market share,<br />
U.S. industry sales). More info:<br />
beerinsights.com.<br />
Numbers rounded. Measured<br />
spending for marketers’ beer<br />
brands. 1. Joint venture.<br />
SABMiller has 58% stake;<br />
Molson Coors has 42%.<br />
2. Grupo Modelo and<br />
Constellation Brands<br />
joint venture; A-B InBev as of<br />
year-end 2011 owned 50.35%<br />
direct and indirect equity<br />
interest in Modelo.<br />
3. Beer barrel = 31 gallons.<br />
Wireless:<br />
Source: ComScore MobiLens<br />
(market share); CTIA (year-end<br />
subscribers in millions). More<br />
info: comscore.com; ctia.org.<br />
Numbers rounded. U.S. network<br />
operator market share based<br />
on subscribers (age 13+) for<br />
three months ended December<br />
2011 and three months ended<br />
December 2010 from<br />
ComScore. 1. Verizon<br />
Communications owns 55%;<br />
Vodafone Group owns 45%.<br />
2. AT&T in March 2011 agreed to<br />
buy T-Mobile USA from<br />
Deutsche Telekom; AT&T in<br />
December 2011 terminated the<br />
deal. 3. Includes prepaid brands<br />
(Boost, Virgin Mobile USA);<br />
excludes Clearwire, in which<br />
Sprint Nextel has a minority<br />
economic interest. 4. Ad<br />
spending for America Movil;<br />
bulk of spending for TracFone<br />
and Straight Talk (TracFone’s<br />
Walmart offering).<br />
CREDIT CARDSN <strong>Share</strong> of general-purpose cards based on purchase volume.<br />
MARKET SHARE<br />
MEASURED MEDIA<br />
MILLIONS OF DOLLARS<br />
RANK MARKETER [PARENT] 2011 2010 2011 2010<br />
1 American Express 1<br />
25.3% + 24.6% $316 $521<br />
2<br />
3<br />
Chase [JPMorgan Chase]<br />
Bank of America<br />
18.1 + 17.7 424 359<br />
1<br />
12.1 - 12.7 138 89<br />
4 Citigroup 1<br />
9.5 - 10.3 228 37<br />
5 Capital One 5.6 + 5.3 261 200<br />
6 Discover 1<br />
4.9 = 4.9 142 155<br />
7 U.S. Bank [U.S. Bancorp] 4.0 + 3.9 5 7<br />
8 Wells Fargo 2.7 + 2.6 0 0<br />
9 HSBC 1<br />
1.6 = 1.6 8 16<br />
10 USAA 1<br />
1.5 = 1.5 1 0<br />
Top 10 85.4 + 85.2 1,522 1,386<br />
Industry total (purchase volume, $ in trillions) $2.050 + $1.870 2,196 1,761<br />
BEVERAGESN <strong>Share</strong> based on U.S. sales volume for nonalcoholic beverages.<br />
MARKET SHARE<br />
MEASURED MEDIA<br />
MILLIONS OF DOLLARS<br />
RANK BRAND [PARENT] 2011 2010 2011 2010<br />
1<br />
2<br />
Coke [Coca-Cola Co.]<br />
Pepsi [PepsiCo]<br />
14.7%<br />
7.8<br />
-<br />
-<br />
15.0%<br />
8.3<br />
$232<br />
196<br />
$265<br />
148<br />
3 Mountain Dew [PepsiCo] 4.6 = 4.6 24 21<br />
4 Dr Pepper [Dr Pepper Snapple Group] 4.1 = 4.1 88 103<br />
5 Gatorade 1 [PepsiCo] 3.5 + 3.2 106 112<br />
6 Sprite [Coca-Cola Co.] 2.9 - 3.0 9 17<br />
7 Nestlé Pure Life [Nestlé] 2.8 = 2.8 19 15<br />
8 Poland Spring [Nestlé] 2.2 = 2.2 6 5<br />
9 Tropicana [PepsiCo] 2.0 - 2.1 48 31<br />
10 Dasani [Coca-Cola Co.] 1.7 + 1.6 6 4<br />
Top 10 46.1 - 47.0 735 722<br />
Industry total (gallons in billions) 29.542 + 29.280 1,639 1,526<br />
Credit cards:<br />
Source: The Nilson Report.<br />
More info: nilsonreport.com.<br />
<strong>Market</strong> share of generalpurpose<br />
credit cards based on<br />
total purchase volume in<br />
dollars for U.S. credit-card<br />
issuers. Numbers rounded.<br />
Excludes cash advances.<br />
Industry total measuredmedia<br />
spending on credit<br />
cards for credit-card issuers;<br />
excludes MasterCard Inc. and<br />
Visa Inc., whose customers<br />
are banks that issue cards.<br />
Measured-media spending<br />
shown is for companies’ credit<br />
cards. (Spending shown does<br />
not include direct mail, a key<br />
discipline for this category.)<br />
Visa had U.S. measured-media<br />
spending of $150.7 million in<br />
2011 and $204.7 million in 2010.<br />
MasterCard had U.S.<br />
measured-media spending<br />
of $118.7 million in 2011 and<br />
$124.6 million in 2010.<br />
1. American Express market<br />
share excludes AmEx cards<br />
issued by third parties.<br />
Discover market share<br />
excludes Discover cards<br />
issued by third parties. BofA,<br />
Citi, HSBC and USAA include<br />
their AmEx-branded cards.<br />
HSBC includes its Discoverbranded<br />
cards.<br />
Beverages:<br />
Source: Beverage <strong>Market</strong>ing<br />
Corp. More info:<br />
beveragemarketing.com.<br />
Numbers rounded. <strong>Market</strong><br />
share data for refreshment<br />
beverages based on U.S. sales<br />
volume in gallons. Brand<br />
includes all trademark volume<br />
(Coke, for example, includes<br />
Coca-Cola, Diet Coke and<br />
caffeine-free Coca-Cola).<br />
1. Includes G2.
5 June 25, 2012 | <strong>Advertising</strong> <strong>Age</strong><br />
RETAILN Nation’s 10 largest retail advertisers, with share of total U.S. retail sales.<br />
MEASURED MEDIA<br />
SHARE OF U.S. RETAIL SALES MILLIONS OF DOLLARS<br />
RANK MARKETER 2011 2010 2011 2010<br />
1 Macy’s 1.0% = 1.0% $835 $888<br />
2 Target Corp. 2.5 - 2.6 694 649<br />
3 Sears Holdings Corp. 1.3 - 1.5 677 700<br />
4 Walmart Stores 11.6 - 11.9 673 902<br />
5 Home Depot 2.3 = 2.3 487 447<br />
6 J.C. Penney Co. 0.6 - 0.7 444 413<br />
7 Best Buy Co. 1.4 = 1.4 371 282<br />
8 Lowe’s Cos. 1.8 = 1.8 344 389<br />
9 Kohl’s Corp. 0.7 = 0.7 331 340<br />
10 Gap Inc. 0.4 = 0.4 300 322<br />
Top 10 23.9 - 24.4 5,156 5,332<br />
Industry total (U.S. sales, $ in trillions 1 ) $2.759 + $2.611 15,849 15,577<br />
100 LEADING NATIONAL ADVERTISERS 2012<br />
Macy’s<br />
1.0 <strong>Share</strong> of U.S.retail sales<br />
% McDonald’s<br />
9.2 2011 market share<br />
%<br />
Measured-media spending:<br />
Source: WPP’s Kantar Media.<br />
More info: kantarmediana.com.<br />
Numbers rounded.<br />
Retail:<br />
Source: Census Bureau<br />
(U.S. retail sales).<br />
More info: census.gov.<br />
Numbers rounded. 1. Industry<br />
total (U.S. sales) is U.S. retail<br />
sales excluding motor-vehicle<br />
and parts dealers, gas stations<br />
and fuel dealers.<br />
Restaurants:<br />
Source: 2012 Technomic Top<br />
500 Chain Restaurant Report<br />
(sales used to calculate<br />
market share). More info:<br />
technomic.com.<br />
Numbers rounded.<br />
Systemwide sales is<br />
franchised plus companyowned<br />
restaurants. 1. <strong>Share</strong><br />
based on estimated sales.<br />
RESTAURANTSN <strong>Market</strong> share based on U.S. systemwide sales.<br />
MEASURED MEDIA<br />
MARKET SHARE MILLIONS OF DOLLARS<br />
RANK CHAIN [PARENT] 2011 2010 2011 2010<br />
1 McDonald’s [McDonald’s Corp.] 9.23% + 8.97% $963 $886<br />
2 Subway [Doctor’s Associates] 3.08 + 2.94 475 429<br />
3 Starbucks 1 [Starbucks Corp.] 2.63 + 2.51 98 94<br />
4 Wendy’s 1 [Wendy’s Co.] 2.30 - 2.31 273 281<br />
5 Burger King 1 [Burger King Holdings] 2.27 - 2.41 300 300<br />
6 Taco Bell 1 [Yum Brands] 1.84 - 1.91 251 275<br />
7 Dunkin’ Donuts[Dunkin’ Brands] 1.60 + 1.56 120 115<br />
8 Pizza Hut 1 [Yum] 1.46 - 1.50 220 217<br />
9 KFC 1 [Yum] 1.22 - 1.30 200 206<br />
10 Applebee’s[DineEquity] 1.19 - 1.20 156 146<br />
Top 10 26.81 + 26.60 3,055 2,950<br />
Industry total (sales, $ in billions) $370.2 + $361.1 5,795 5,548