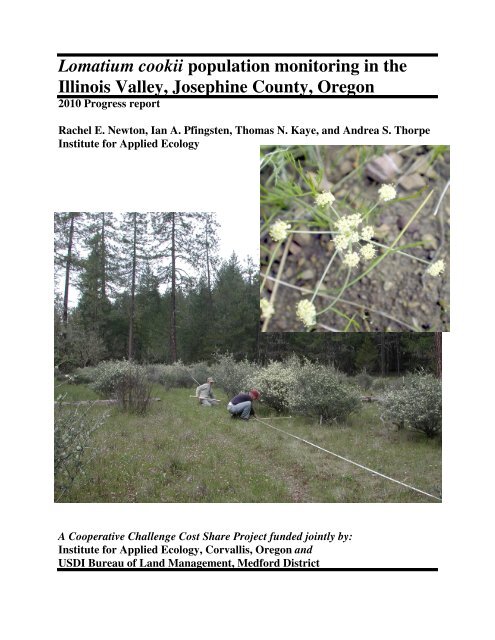
Lomatium cookii population monitoring in the Illinois Valley ...
Lomatium cookii population monitoring in the Illinois Valley ...
Lomatium cookii population monitoring in the Illinois Valley ...

You also want an ePaper? Increase the reach of your titles
YUMPU automatically turns print PDFs into web optimized ePapers that Google loves.
<strong>Lomatium</strong> <strong>cookii</strong> <strong>population</strong> <strong>monitor<strong>in</strong>g</strong> <strong>in</strong> <strong>the</strong><br />
Ill<strong>in</strong>ois <strong>Valley</strong>, Joseph<strong>in</strong>e County, Oregon<br />
2010 Progress report<br />
Rachel E. Newton, Ian A. Pf<strong>in</strong>gsten, Thomas N. Kaye, and Andrea S. Thorpe<br />
Institute for Applied Ecology<br />
A Cooperative Challenge Cost Share Project funded jo<strong>in</strong>tly by:<br />
Institute for Applied Ecology, Corvallis, Oregon and<br />
USDI Bureau of Land Management, Medford District
PREFACE<br />
This report is <strong>the</strong> result of a cooperative Challenge Cost Share project between <strong>the</strong> Institute for<br />
Applied Ecology (IAE) and <strong>the</strong> Bureau of Land Management. IAE is a non-profit organization<br />
dedicated to natural resource conservation, research, and education. Our aim is to provide a<br />
service to public and private agencies and <strong>in</strong>dividuals by develop<strong>in</strong>g and communicat<strong>in</strong>g<br />
<strong>in</strong>formation on ecosystems, species, and effective management strategies and by conduct<strong>in</strong>g<br />
research, <strong>monitor<strong>in</strong>g</strong>, and experiments. IAE offers educational opportunities through 3-4 month<br />
<strong>in</strong>ternships. Our current activities are concentrated on rare and endangered plants and <strong>in</strong>vasive<br />
species.<br />
Questions regard<strong>in</strong>g this report or IAE should be directed to:<br />
Thomas N. Kaye or Andrea Thorpe<br />
Institute for Applied Ecology<br />
PO Box 2855<br />
Corvallis, Oregon 97339-2855<br />
phone: 541-753-3099<br />
fax: 541-753-3098<br />
email: tom@appliedeco.org, andrea@appliedeco.org<br />
web: www.appliedeco.org<br />
ACKNOWLEDGEMENTS<br />
The authors thank <strong>the</strong> Medford BLM, particularly Susan Fritts, L<strong>in</strong>da Mazzu, Mark Mousseaux,<br />
and Brad Tong for <strong>the</strong>ir assistance with this study. The follow<strong>in</strong>g IAE <strong>in</strong>terns and staff<br />
contributed to <strong>the</strong> 2010 field season: Michelle Allen, Alexis Brickner, Andrew Dempsey-Karp,<br />
Kristen Emmett, Geoff Gardner, Katie Jones, Rob Massatti and Shell Whitt<strong>in</strong>gton.<br />
Please cite this report as:<br />
Newton, R.E., I.A. Pf<strong>in</strong>gsten, T.N. Kaye, and A.S. Thorpe. 2010. <strong>Lomatium</strong> <strong>cookii</strong> <strong>monitor<strong>in</strong>g</strong> <strong>in</strong><br />
<strong>the</strong> Ill<strong>in</strong>ois <strong>Valley</strong>, Joseph<strong>in</strong>e County, Oregon. Institute for Applied Ecology, Corvallis,<br />
Oregon and USDI Bureau of Land Management, Medford District. vi + 37 pp.<br />
<strong>Lomatium</strong> <strong>cookii</strong> <strong>population</strong> <strong>monitor<strong>in</strong>g</strong> progress report, 2010 ii
EXECUTIVE SUMMARY<br />
<strong>Lomatium</strong> <strong>cookii</strong> is endemic to southwestern Oregon, and is listed as endangered by <strong>the</strong> State of<br />
Oregon and by <strong>the</strong> U.S. Fish and Wildlife Service (USFWS). Populations discussed <strong>in</strong> this<br />
report are conf<strong>in</strong>ed to <strong>the</strong> Ill<strong>in</strong>ois <strong>Valley</strong> <strong>in</strong> Joseph<strong>in</strong>e County. Long-term <strong>monitor<strong>in</strong>g</strong> has<br />
occurred at French Flat s<strong>in</strong>ce 1990, at Rough and Ready s<strong>in</strong>ce 1994 and at Indian Hill s<strong>in</strong>ce 1997.<br />
Data from <strong>the</strong>se efforts are used to track <strong>population</strong> dynamics and create a <strong>population</strong> viability<br />
analysis (PVA).<br />
French Flat South<br />
• Plants <strong>in</strong> <strong>the</strong> density plots numbered 64,326 <strong>in</strong>dividuals, a 5.9% <strong>in</strong>crease over last year,<br />
and had a density of 17 plants m -2 . The proportion of reproductive plants to <strong>the</strong> overall<br />
<strong>population</strong> was 27%, a 2% decrease over 2009.<br />
• Despite recent <strong>in</strong>creases <strong>in</strong> <strong>population</strong> size, <strong>the</strong> PVA <strong>in</strong>dicates a 97.5% probability this<br />
<strong>population</strong> will decrease 50% <strong>in</strong> <strong>the</strong> next 20 years. A catastrophic loss (99%) over <strong>the</strong><br />
same period has a 0.19% likelihood of occurr<strong>in</strong>g.<br />
French Flat Middle<br />
• Plants <strong>in</strong> <strong>the</strong> density plots numbered 90,825, a 20% decrease s<strong>in</strong>ce 2009. Density was<br />
16.4 plants m -2 . Reproductive plants composed 27% of <strong>the</strong> overall <strong>population</strong>, a 4%<br />
decrease over 2009.<br />
• The PVA <strong>in</strong>dicates a 17.8% probability this <strong>population</strong> will decrease 50% <strong>in</strong> <strong>the</strong> next 20<br />
years. A catastrophic loss (99%) over <strong>the</strong> same period is not likely to occur (0%).<br />
Rough and Ready<br />
• Although this <strong>population</strong> decreased 8% to 2557 plants, this is <strong>the</strong> second highest<br />
<strong>population</strong> size s<strong>in</strong>ce <strong>monitor<strong>in</strong>g</strong> began <strong>in</strong> 1994. Reproductive adults comprised 40% of<br />
<strong>the</strong> <strong>population</strong>, a 1.5% decrease over last year.<br />
Indian Hill<br />
• This <strong>population</strong> <strong>in</strong>creased 9.8% to 10,948, <strong>the</strong> third highest count s<strong>in</strong>ce 1997.<br />
Reproductive adults composed 32% of <strong>the</strong> <strong>population</strong>, a 1% decrease s<strong>in</strong>ce 2009.<br />
Overall, <strong>population</strong>s of <strong>Lomatium</strong> <strong>cookii</strong> <strong>in</strong> Joseph<strong>in</strong>e County have shown <strong>in</strong>creased recruitment<br />
of seedl<strong>in</strong>gs and <strong>population</strong> sizes have rema<strong>in</strong>ed relatively stable to <strong>in</strong>creased. This is likely due<br />
to active management of <strong>the</strong>se <strong>population</strong>s by <strong>the</strong> Medford BLM, <strong>in</strong>clud<strong>in</strong>g prevent<strong>in</strong>g use by off<br />
road vehicles. However, <strong>population</strong> viability analyses <strong>in</strong>dicate <strong>the</strong>re is still risk of serious<br />
<strong>population</strong> decl<strong>in</strong>es. Proposed m<strong>in</strong><strong>in</strong>g activities may have fur<strong>the</strong>r detrimental impacts on <strong>the</strong>se<br />
<strong>population</strong>s. We recommend cont<strong>in</strong>ued <strong>monitor<strong>in</strong>g</strong> of <strong>the</strong>se <strong>population</strong>s to assess <strong>population</strong><br />
trends, trespass by ORVs, and provide data to assess impacts to <strong>population</strong>s from future impacts<br />
that may <strong>in</strong>clude climate change, m<strong>in</strong><strong>in</strong>g, or o<strong>the</strong>r human recreation.<br />
<strong>Lomatium</strong> <strong>cookii</strong> <strong>population</strong> <strong>monitor<strong>in</strong>g</strong> progress report, 2010 iii
TABLE OF CONTENTS<br />
Preface. ............................................................................................................................................ ii<br />
Acknowledgements ......................................................................................................................... ii<br />
Executive Summary ....................................................................................................................... iii<br />
Table of Contents ........................................................................................................................... iv<br />
List of Tables .................................................................................................................................. v<br />
List of Figures ............................................................................................................................... vii<br />
Introduction ..................................................................................................................................... 1<br />
Review of past <strong>monitor<strong>in</strong>g</strong> ........................................................................................................ 1<br />
Description ................................................................................................................................ 1<br />
Geographic range ...................................................................................................................... 2<br />
Habitat ....................................................................................................................................... 2<br />
Reproductive biology ................................................................................................................ 2<br />
Concerns ................................................................................................................................... 2<br />
Objectives ................................................................................................................................. 4<br />
Methods........................................................................................................................................... 4<br />
Review of <strong>population</strong>s .............................................................................................................. 4<br />
French Flat North ...................................................................................................................... 6<br />
French Flat Middle and South sub<strong>population</strong>s ......................................................................... 6<br />
Density plots ........................................................................................................... 8<br />
Demographic plots and analysis.............................................................................. 9<br />
Rough and Ready Creek.......................................................................................................... 12<br />
Indian Hill ............................................................................................................................... 14<br />
Results. .......................................................................................................................................... 16<br />
French Flat .............................................................................................................................. 16<br />
Population size and density ................................................................................... 16<br />
Population structure .............................................................................................. 20<br />
Demography and Population Viability Analysis ................................................... 20<br />
Environmental factors affect<strong>in</strong>g <strong>Lomatium</strong> <strong>cookii</strong> at French Flat ........................ 21<br />
Rough and Ready Creek.......................................................................................................... 27<br />
Indian Hill ............................................................................................................................... 29<br />
Herbivory on <strong>Lomatium</strong> <strong>cookii</strong> ............................................................................................... 30<br />
Discussion ................................................................................................................................... 333<br />
Current <strong>population</strong> status ........................................................................................................ 33<br />
French Flat .......................................................................................................... 333<br />
Rough and Ready Creek........................................................................................ 33<br />
Indian Hill ............................................................................................................. 34<br />
Management recommendations .............................................................................................. 35<br />
French Flat ............................................................................................................ 35<br />
Rough and Ready Creek........................................................................................ 35<br />
Indian Hill ............................................................................................................. 35<br />
Literature cited ............................................................................................................................ 366<br />
Appendix A. Gear list. ............................................................................................................... 377<br />
<strong>Lomatium</strong> <strong>cookii</strong> <strong>population</strong> <strong>monitor<strong>in</strong>g</strong> progress report, 2010 iv
LIST OF TABLES<br />
Table 1. Orientation of <strong>population</strong>-boundary transects at <strong>the</strong> French Flat Middle and South<br />
sub<strong>population</strong>s.<br />
Table 2. Summary of <strong>Lomatium</strong> <strong>cookii</strong> <strong>population</strong> data for French Flat Middle and South<br />
sub<strong>population</strong>s, 1993-2010.<br />
Table 3. Average transition matrices used <strong>in</strong> <strong>the</strong> stochastic analyses for L. <strong>cookii</strong> at French Flat.<br />
Table 4. Transition matrices for <strong>Lomatium</strong> <strong>cookii</strong> at <strong>the</strong> South and Middle sub<strong>population</strong>s of<br />
French Flat.<br />
Table 5. Elasticity matrices of <strong>the</strong> South and Middle <strong>Lomatium</strong> <strong>cookii</strong> sub<strong>population</strong>s derived<br />
from <strong>the</strong> average transition matrices.<br />
Table 6. Number of <strong>Lomatium</strong> <strong>cookii</strong> <strong>in</strong>dividuals <strong>in</strong> each patch at Rough and Ready Creek.<br />
Table 7. Summary of <strong>population</strong> density and size for <strong>the</strong> Indian Hill <strong>population</strong>.<br />
<strong>Lomatium</strong> <strong>cookii</strong> <strong>population</strong> <strong>monitor<strong>in</strong>g</strong> progress report, 2010 v
LIST OF FIGURES<br />
Figure 1. L<strong>in</strong>e draw<strong>in</strong>g of <strong>Lomatium</strong> <strong>cookii</strong> from Kagan (1986).<br />
Figure 2. Locations of <strong>the</strong> <strong>Lomatium</strong> <strong>cookii</strong> study sites <strong>in</strong>cluded <strong>in</strong> this report.<br />
Figure 3. Sketch diagram of three French Flat sub<strong>population</strong>s of <strong>Lomatium</strong> <strong>cookii</strong>.<br />
Figure 4. Sketch diagram of transects at <strong>the</strong> North sub<strong>population</strong>.<br />
Figure 5. Layout of plots <strong>in</strong> <strong>the</strong> Middle sub<strong>population</strong> at French Flat.<br />
Figure 6. Layout of plots <strong>in</strong> <strong>the</strong> South sub<strong>population</strong> at French Flat.<br />
Figure 7. Sketch diagram of <strong>the</strong> orientation of <strong>the</strong> <strong>Lomatium</strong> <strong>cookii</strong> sampl<strong>in</strong>g and demographic<br />
subplots at <strong>the</strong> Middle and South sub<strong>population</strong>s at French Flat.<br />
Figure 8. Sketch map of <strong>the</strong> L. <strong>cookii</strong> patches located at Rough and Ready Botanical Wayside.<br />
Figure 9. Orientation of <strong>the</strong> sampl<strong>in</strong>g plots around transects 1, 2 and 3 at <strong>the</strong> Rough and Ready<br />
Botanical Wayside <strong>population</strong>.<br />
Figure 10. Plot layout of <strong>the</strong> <strong>Lomatium</strong> <strong>cookii</strong> <strong>population</strong> at Indian Hill.<br />
Figure 11. <strong>Lomatium</strong> triternatum (left), L. <strong>cookii</strong> (center), and L. utriculatum (right).<br />
Figure 12. The total number of reproductive <strong>Lomatium</strong> <strong>cookii</strong> at Middle and South French Flat.<br />
Figure 13. The number of reproductive <strong>Lomatium</strong> <strong>cookii</strong> relative to <strong>the</strong> total sub<strong>population</strong> at<br />
Middle and South French Flat.<br />
Figure 14. <strong>Lomatium</strong> <strong>cookii</strong> <strong>population</strong> structure <strong>in</strong> 2010 and averaged over <strong>the</strong> course of <strong>the</strong><br />
study for <strong>the</strong> Middle French Flat sub<strong>population</strong>, South French Flat sub<strong>population</strong>, Rough<br />
and Ready Creek, and Indian Hill.<br />
Figure 15. Relationship between <strong>population</strong> growth rate at <strong>the</strong> South sub<strong>population</strong> and graz<strong>in</strong>g<br />
frequency of plants <strong>in</strong> <strong>the</strong> previous year (top) and fall precipitation <strong>in</strong> <strong>the</strong> previous year<br />
(bottom).<br />
Figure 16. Relationship between seedl<strong>in</strong>g production per reproductive plant present <strong>the</strong> previous<br />
year at <strong>the</strong> South sub<strong>population</strong> and graz<strong>in</strong>g frequency of <strong>the</strong> previous year (top) and fall<br />
precipitation of <strong>the</strong> previous year (bottom).<br />
Figure 17. Population trends for reproductive plants and <strong>the</strong> total number of plants<br />
(reproductive and vegetative) at Rough and Ready Creek, 1994 - 2010.<br />
Figure 18. Population fluctuations <strong>in</strong> <strong>Lomatium</strong> <strong>cookii</strong> patches A - H at Rough and Ready<br />
Creek, 1994 – 2010.<br />
Figure 19. The number of vegetative and reproductive plants at Indian Hill, 1997- 2010.<br />
Figure 20. Frequency of herbivory on <strong>Lomatium</strong> <strong>cookii</strong> at four <strong>population</strong>s, 1994 - 2010.<br />
Figure 21. ORV damage <strong>in</strong> <strong>the</strong> <strong>Lomatium</strong> <strong>cookii</strong> <strong>population</strong> at French Flat.<br />
<strong>Lomatium</strong> <strong>cookii</strong> <strong>population</strong> <strong>monitor<strong>in</strong>g</strong> progress report, 2010 vi
<strong>Lomatium</strong> <strong>cookii</strong> (cover photo, Figure 1),<br />
Cook's desert-parsley, is listed as endangered by<br />
<strong>the</strong> State of Oregon and by <strong>the</strong> U.S. Fish and<br />
Wildlife Service (USFWS). It is closely related<br />
to L. bradshawii (Rose) Math. & Const., an<br />
endangered species found <strong>in</strong> <strong>the</strong> Willamette<br />
<strong>Valley</strong> of western Oregon. Several significant<br />
<strong>population</strong>s of L. <strong>cookii</strong> occur on land managed<br />
by <strong>the</strong> Bureau of Land Management (BLM)<br />
Medford District. This progress report<br />
documents <strong>monitor<strong>in</strong>g</strong> methods and results on<br />
<strong>the</strong> BLM Medford District through 2010 and is<br />
<strong>the</strong> product of a cooperative effort between <strong>the</strong><br />
BLM and <strong>the</strong> Institute for Applied Ecology.<br />
Review of past <strong>monitor<strong>in</strong>g</strong><br />
The largest federally-owned <strong>population</strong><br />
of L. <strong>cookii</strong> was discovered <strong>in</strong> 1992 at French<br />
Flat on <strong>the</strong> BLM Medford District. Areas<br />
around this <strong>population</strong> were placer-m<strong>in</strong>ed for<br />
many years. Dur<strong>in</strong>g <strong>the</strong> 1993 field season, staff<br />
INTRODUCTION<br />
from <strong>the</strong> BLM Medford District established long-term <strong>monitor<strong>in</strong>g</strong> plots and transects <strong>in</strong> <strong>the</strong> three<br />
largest sub<strong>population</strong>s of L. <strong>cookii</strong> <strong>in</strong> this area (Tong 1993). Additional plots and documentation<br />
of <strong>the</strong> <strong>monitor<strong>in</strong>g</strong> protocol were added <strong>in</strong> 1994 (Kaye and Kirkland 1995). A long-term<br />
<strong>monitor<strong>in</strong>g</strong> transect located sou<strong>the</strong>ast of <strong>the</strong>se sub<strong>population</strong>s was established by BLM Medford<br />
District botanists <strong>in</strong> 1990 (Knight 1992) and was monitored through 1994 (Kaye and Kirkland<br />
1995), but has not been relocated <strong>in</strong> recent years and is not discussed <strong>in</strong> this report. Annual<br />
<strong>monitor<strong>in</strong>g</strong> plots were established on BLM land near Rough and Ready Creek <strong>in</strong> 1994 and at<br />
Indian Hill <strong>in</strong> 1997. Monitor<strong>in</strong>g between 1994 and 1999 was conducted by <strong>the</strong> Oregon<br />
Department of Agriculture Plant Conservation Biology Program. S<strong>in</strong>ce 2000, <strong>population</strong>s have<br />
been monitored by <strong>the</strong> Institute for Applied Ecology.<br />
Description<br />
Figure 1. L<strong>in</strong>e draw<strong>in</strong>g of <strong>Lomatium</strong> <strong>cookii</strong><br />
from Kagan (1986).<br />
<strong>Lomatium</strong> <strong>cookii</strong> is a member of <strong>the</strong> Apiaceae (parsley family). The plants are usually<br />
less than 3 dm tall and <strong>in</strong>conspicuous except when <strong>in</strong> flower. Ternately divided leaves feature<br />
many narrow leaflets and creamy yellow flowers are produced <strong>in</strong> compound umbels on leafless<br />
stems (Figure 1). Fruits are flat and oblong. The species was orig<strong>in</strong>ally described by Kagan <strong>in</strong><br />
1986 from specimens collected <strong>in</strong> <strong>the</strong> Medford area.<br />
<strong>Lomatium</strong> <strong>cookii</strong> <strong>population</strong> <strong>monitor<strong>in</strong>g</strong> progress report, 2010 1
Geographic range<br />
<strong>Lomatium</strong> <strong>cookii</strong> is endemic to southwestern Oregon. Two <strong>population</strong> centers are known,<br />
<strong>the</strong> Ill<strong>in</strong>ois <strong>Valley</strong> <strong>in</strong> Joseph<strong>in</strong>e County and <strong>the</strong> Agate Desert north of <strong>the</strong> Medford Pla<strong>in</strong>s <strong>in</strong><br />
Jackson County (Kagan 1994). This report focuses on <strong>population</strong> <strong>monitor<strong>in</strong>g</strong> on BLM land <strong>in</strong><br />
<strong>the</strong> Ill<strong>in</strong>ois <strong>Valley</strong> at French Flat, Indian Hill, and Rough and Ready Creek (Figure 2). The<br />
Nature Conservancy currently monitors <strong>population</strong>s on <strong>the</strong>ir lands <strong>in</strong> Jackson County.<br />
Habitat<br />
The <strong>population</strong>s of L. <strong>cookii</strong> studied <strong>in</strong> <strong>the</strong> Ill<strong>in</strong>ois <strong>Valley</strong> are found <strong>in</strong> moist, grassy<br />
meadows dom<strong>in</strong>ated by Danthonia californica (Kaye and Blakeley-Smith 2002). O<strong>the</strong>r<br />
associated species <strong>in</strong>clude Deschampsia cespitosa, Festuca roemeri ssp. klama<strong>the</strong>nse, Stipa<br />
lemmonii, Camassia quamash, Ranunculus occidentalis, Hesperochiron occidentalis, Down<strong>in</strong>gia<br />
y<strong>in</strong>a, Horkelia daucifolia, Isoetes nuttallii, Calochortus nudus, and Viola hallii. One patch of L.<br />
<strong>cookii</strong> <strong>in</strong>dividuals at <strong>the</strong> Rough and Ready Botanical Wayside was observed grow<strong>in</strong>g up through<br />
a dense ground-cover of Rhus diversiloba. Trees and shrubs, such as P<strong>in</strong>us ponderosa, P.<br />
jeffreyi, Arctostaphylos spp., and Ceanothus cuneatus border <strong>the</strong>se grassy meadows.<br />
Reproductive biology<br />
Flower<strong>in</strong>g stems beg<strong>in</strong> to emerge from a rosette of leaves <strong>in</strong> late February and flowers<br />
usually bloom around mid-March and cont<strong>in</strong>ue <strong>in</strong>to May. As with some o<strong>the</strong>r <strong>Lomatium</strong> species,<br />
<strong>the</strong> earliest umbels are predom<strong>in</strong>ately stam<strong>in</strong>ate, while later umbels have both stam<strong>in</strong>ate and<br />
hermaphroditic flowers. Plants that produce only one umbel produce very few, if any, fruits<br />
(Kaye and Kirkland 1994). Several poll<strong>in</strong>ators have been observed visit<strong>in</strong>g L. <strong>cookii</strong> <strong>in</strong>clud<strong>in</strong>g a<br />
small bee <strong>in</strong> <strong>the</strong> Andrenae family (Brock 1987) and a small black moth (Kagan 1986). Dur<strong>in</strong>g<br />
1994 and 1995, we observed large numbers of bumblebees (Bombus spp.) regularly visit<strong>in</strong>g <strong>the</strong><br />
flowers at French Flat <strong>in</strong> <strong>the</strong> Ill<strong>in</strong>ois <strong>Valley</strong>.<br />
Concerns<br />
<strong>Lomatium</strong> <strong>cookii</strong> habitat <strong>in</strong> <strong>the</strong> Ill<strong>in</strong>ois <strong>Valley</strong> is threatened by rural development and<br />
abuse by recreational users <strong>in</strong> <strong>the</strong> area. Both <strong>the</strong> French Flat and Rough and Ready Creek sites<br />
cont<strong>in</strong>ue to be severely damaged by ORV use, where we observed fresh vehicle tracks <strong>in</strong> 2002 -<br />
2007. At both sites, damage was severe <strong>in</strong> <strong>the</strong> L. <strong>cookii</strong> <strong>population</strong>, even disturb<strong>in</strong>g <strong>population</strong><br />
<strong>monitor<strong>in</strong>g</strong> plot markers. A trash pile, complete with old appliances and deep tire ruts, was found<br />
at <strong>the</strong> Rough and Ready Creek <strong>population</strong> <strong>in</strong> 2003. Tire ruts were found aga<strong>in</strong> at site <strong>in</strong> 2007.<br />
M<strong>in</strong><strong>in</strong>g activities are also a concern. Placer gold m<strong>in</strong><strong>in</strong>g has restricted <strong>the</strong> <strong>population</strong> at<br />
French Flat and permanently altered much of <strong>the</strong> natural hydrologic patterns through <strong>the</strong><br />
meadows. Hydrology at <strong>the</strong> Rough and Ready Creek <strong>population</strong> is affected by a nearby irrigation<br />
ditch and by roads that pass through and divide <strong>the</strong> <strong>population</strong>. Some of <strong>the</strong> French Flat<br />
sub<strong>population</strong>s monitored and discussed <strong>in</strong> this report are located on BLM managed lands<br />
adjacent to <strong>the</strong> Hillside Placer No. 1 and No. 3 M<strong>in</strong>es owned and operated by a local resident. A<br />
proposed m<strong>in</strong><strong>in</strong>g plan filed <strong>in</strong> 1993 would <strong>in</strong>volve destruction of a significant portion of this<br />
sub<strong>population</strong>.<br />
<strong>Lomatium</strong> <strong>cookii</strong> <strong>population</strong> <strong>monitor<strong>in</strong>g</strong> progress report, 2010 2
Figure 2. Locations of <strong>the</strong> <strong>Lomatium</strong> <strong>cookii</strong> study sites <strong>in</strong>cluded <strong>in</strong> this report. Note:<br />
o<strong>the</strong>r L. <strong>cookii</strong> sub<strong>population</strong>s occur <strong>in</strong> this general area but are not shown.<br />
<strong>Lomatium</strong> <strong>cookii</strong> <strong>population</strong> <strong>monitor<strong>in</strong>g</strong> progress report, 2010 3
Objectives<br />
The purpose of this cooperative project is to assist <strong>in</strong> recovery efforts for L. <strong>cookii</strong><br />
through <strong>the</strong> follow<strong>in</strong>g <strong>population</strong> <strong>monitor<strong>in</strong>g</strong> tasks:<br />
• Resample exist<strong>in</strong>g <strong>monitor<strong>in</strong>g</strong> plots on BLM land near French Flat to monitor changes <strong>in</strong><br />
<strong>population</strong> size or density.<br />
• Resample exist<strong>in</strong>g <strong>monitor<strong>in</strong>g</strong> plots at <strong>the</strong> Rough and Ready Creek Botanical Wayside to<br />
monitor changes <strong>in</strong> <strong>population</strong> size.<br />
• Resample permanent <strong>monitor<strong>in</strong>g</strong> plots at <strong>the</strong> Indian Hill <strong>population</strong>.<br />
• Summarize <strong>monitor<strong>in</strong>g</strong> data from 1993 through 2010.<br />
• Summarize <strong>in</strong>formation from long-term demographic plots with<strong>in</strong> <strong>the</strong> French Flat<br />
sub<strong>population</strong> to provide <strong>in</strong>formation on <strong>the</strong> mortality and survival of plants <strong>in</strong> six lifehistory<br />
stages, and develop a <strong>population</strong> viability model based on <strong>in</strong>formation from 1994-<br />
2010.<br />
Review of <strong>population</strong>s<br />
METHODS<br />
Study <strong>population</strong>s <strong>in</strong>cluded <strong>in</strong> this report are French Flat, Rough and Ready Creek, and<br />
Indian Hill. Monitor<strong>in</strong>g has been conducted at four sub<strong>population</strong>s, North, Middle, South, and<br />
P<strong>in</strong>ey Woods (Figure 2), <strong>in</strong> or near French Flat s<strong>in</strong>ce 1990. Currently, only <strong>the</strong> middle and south<br />
sub<strong>population</strong>s (Figure 3) are monitored annually. Monitor<strong>in</strong>g at P<strong>in</strong>ey Woods was <strong>in</strong>itiated <strong>in</strong><br />
1990 (Knight 1992). Monitor<strong>in</strong>g at this site was conducted <strong>in</strong> 1994, but is not discussed here.<br />
Transects and <strong>monitor<strong>in</strong>g</strong> at French Flat North was <strong>in</strong>itiated by BLM staff <strong>in</strong> 1993 and was<br />
repeated <strong>in</strong> 1994 (Tong 1993). Transect and <strong>monitor<strong>in</strong>g</strong> plots were also <strong>in</strong>itiated by BLM staff at<br />
French Flat South and Middle <strong>in</strong> 1993 (Tong 1993). Sample plot numbers and sizes were<br />
modified <strong>in</strong> 1994 and <strong>the</strong> updated protocols are described below. These sub<strong>population</strong>s cont<strong>in</strong>ue<br />
to be monitored annually. Monitor<strong>in</strong>g plots at Rough and Ready Creek were <strong>in</strong>itiated <strong>in</strong> 1994.<br />
At Indian Hill, plots were established and sampled <strong>in</strong> 1997. The <strong>monitor<strong>in</strong>g</strong> and sampl<strong>in</strong>g<br />
methods for each study site differ significantly, and are described separately. Units of measure<br />
(meters or feet) differ because different people <strong>in</strong>itiated <strong>the</strong> <strong>monitor<strong>in</strong>g</strong> plots at specific sites.<br />
<strong>Lomatium</strong> <strong>cookii</strong> <strong>population</strong> <strong>monitor<strong>in</strong>g</strong> progress report, 2010 4
Figure 3. Sketch diagram of three French Flat sub<strong>population</strong>s of <strong>Lomatium</strong> <strong>cookii</strong>. The Middle and<br />
South sub<strong>population</strong>s <strong>in</strong>clude long-term <strong>monitor<strong>in</strong>g</strong> subplots and transects, while <strong>the</strong> smaller North<br />
sub<strong>population</strong> is sampled with radially arranged transects only.<br />
<strong>Lomatium</strong> <strong>cookii</strong> <strong>population</strong> <strong>monitor<strong>in</strong>g</strong> progress report, 2010 5
French Flat North<br />
At <strong>the</strong> French Flat North<br />
sub<strong>population</strong>, seven<br />
radially arranged transects<br />
were centered on a flagged<br />
rebar post located roughly<br />
at <strong>the</strong> center of <strong>the</strong> patch of<br />
plants (Figure 4). The<br />
endpo<strong>in</strong>ts of each transect<br />
were marked with flagged<br />
rebar. A foot/meter tape<br />
was stretched from <strong>the</strong><br />
center post to <strong>the</strong> endpo<strong>in</strong>t<br />
rebar. The presence of L.<br />
<strong>cookii</strong> was recorded along<br />
each foot and with<strong>in</strong> 6<br />
<strong>in</strong>ches of ei<strong>the</strong>r side of <strong>the</strong><br />
tape (Tong 1993). This<br />
<strong>population</strong> is not currently<br />
monitored.<br />
French Flat Middle and<br />
South sub<strong>population</strong>s<br />
Figure 4. Sketch diagram of transects at <strong>the</strong> North sub<strong>population</strong>.<br />
Bear<strong>in</strong>gs and lengths (<strong>in</strong> feet) are <strong>in</strong>dicated.<br />
Long-term <strong>monitor<strong>in</strong>g</strong> plots were established at <strong>the</strong> Middle and South sub<strong>population</strong>s <strong>in</strong><br />
1993. Density <strong>monitor<strong>in</strong>g</strong> plots (1 foot x 10 feet and 1 foot x 20 feet) were located randomly<br />
with<strong>in</strong> x, y coord<strong>in</strong>ate grids positioned to cover <strong>the</strong> entire area of each sub<strong>population</strong> (Figures 5<br />
& 6). The orig<strong>in</strong>s of <strong>the</strong> grid basel<strong>in</strong>es were permanently marked with rebar. Dur<strong>in</strong>g <strong>the</strong> 1994<br />
season, we recorded x, y coord<strong>in</strong>ates for each of <strong>the</strong> plots at <strong>the</strong>se sub<strong>population</strong>s, measured<br />
locations and bear<strong>in</strong>gs of reference transects, added additional sampl<strong>in</strong>g plots, and adjusted <strong>the</strong><br />
plot sizes [see discussions for each sub<strong>population</strong> below, and Kaye and Kirkland (1995)]. Two<br />
corners of each plot were permanently marked with rebar and metal p<strong>in</strong>s were temporarily used<br />
for <strong>the</strong> o<strong>the</strong>r two corners of <strong>the</strong> rectangular plots dur<strong>in</strong>g sampl<strong>in</strong>g.<br />
Middle sub<strong>population</strong><br />
To locate <strong>the</strong> basel<strong>in</strong>e grid <strong>in</strong> <strong>the</strong> Middle sub<strong>population</strong>, a tape represent<strong>in</strong>g <strong>the</strong> y-axis<br />
was stretched at a bear<strong>in</strong>g of 35˚ east from <strong>the</strong> orig<strong>in</strong> rebar (marked with a numbered copper tag<br />
and flagged) to a rebar post at 165 feet marked with a BLM "vegetation study" sign. Forty plots<br />
were established at random locations with<strong>in</strong> <strong>the</strong> grid system. Demographic plots were<br />
established at sampl<strong>in</strong>g plots numbered 1, 3, 6, 7, 8, 10, 13, 16, 17, 18, 23, 25, 28, 29, 30, 31, 33,<br />
37, 38, and 39.<br />
<strong>Lomatium</strong> <strong>cookii</strong> <strong>population</strong> <strong>monitor<strong>in</strong>g</strong> progress report, 2010 6
T2<br />
T1<br />
T4<br />
T3<br />
Figure 5. Layout of plots <strong>in</strong> <strong>the</strong> Middle sub<strong>population</strong> at French Flat. The plot numbers<br />
represent <strong>the</strong> relative location of <strong>the</strong> north corner of each plot. L<strong>in</strong>es with arrowheads are<br />
sub<strong>population</strong> boundary transects.<br />
T4<br />
T3<br />
T1<br />
T10<br />
T6 T7<br />
Figure 6. Layout of plots <strong>in</strong> <strong>the</strong> South sub<strong>population</strong> at French Flat. The plot numbers represent <strong>the</strong><br />
relative location of <strong>the</strong> north corner of each plot. L<strong>in</strong>es with arrowheads are sub<strong>population</strong> boundary<br />
transects.<br />
<strong>Lomatium</strong> <strong>cookii</strong> <strong>population</strong> <strong>monitor<strong>in</strong>g</strong> progress report, 2010 7<br />
T8
South sub<strong>population</strong><br />
Foot/meter tapes attached end-to-end represent<strong>in</strong>g <strong>the</strong> y-axis were stretched at a bear<strong>in</strong>g<br />
of 190˚ east from <strong>the</strong> orig<strong>in</strong> rebar to a rebar post approximately 400 feet away. A numbered<br />
copper tag was attached to <strong>the</strong> nor<strong>the</strong>ast corner rebar post of each plot for identification. Four<br />
new plots were established at random locations with<strong>in</strong> <strong>the</strong> grid system, br<strong>in</strong>g<strong>in</strong>g <strong>the</strong> total number<br />
of sampl<strong>in</strong>g plots to 44. In addition, exist<strong>in</strong>g plots were enlarged by mov<strong>in</strong>g <strong>the</strong> northwest corner<br />
rebar of each plot ten feet west, mak<strong>in</strong>g all plot dimensions 1 foot x 20 feet.<br />
Demographic plots were established at twenty-two sampl<strong>in</strong>g plots numbered 1, 2, 3, 4, 7,<br />
8, 13, 15, 16, 19, 21, 23, 24, 25, 26, 33, 35, 38, 39, 40, 42, and 43. Due to <strong>in</strong>tense ORV<br />
disturbance <strong>in</strong> 2003, several rebar posts were miss<strong>in</strong>g, <strong>in</strong>clud<strong>in</strong>g one or both corner rebar posts<br />
for plots 5, 28, 34, 38, and 39. Plots were reconstructed us<strong>in</strong>g <strong>the</strong> appropriate compass bear<strong>in</strong>gs<br />
and coord<strong>in</strong>ates, and <strong>the</strong> rebar pieces were replaced.<br />
As at <strong>the</strong> North sub<strong>population</strong>, several transects cross <strong>the</strong> boundaries of <strong>the</strong> Middle and<br />
South sub<strong>population</strong>s (Table 1). The presence of <strong>Lomatium</strong> <strong>cookii</strong> along <strong>the</strong>se transects was<br />
recorded <strong>in</strong> 1994 us<strong>in</strong>g <strong>the</strong> same method as described for <strong>the</strong> North sub<strong>population</strong>.<br />
Density plots<br />
We del<strong>in</strong>eated plot boundaries with a meter tape and all plants with<strong>in</strong> <strong>the</strong> plots were<br />
counted and assigned to a specific life-history category, as follows:<br />
S seedl<strong>in</strong>g<br />
V1/2 vegetative with 1 or 2 leaves<br />
V3 vegetative with 3 or more leaves<br />
R-1 reproductive with 1 umbel<br />
R-2 reproductive with 2 umbels<br />
R-3 reproductive with 3 or more umbels<br />
Table 1. Orientation of <strong>population</strong>-boundary transects at <strong>the</strong> French Flat Middle and South<br />
sub<strong>population</strong>s. Values under 'orig<strong>in</strong>' represent x-y coord<strong>in</strong>ates of tagged rebar posts.<br />
Sub<strong>population</strong> Transect Orig<strong>in</strong> (x, y; feet) Bear<strong>in</strong>g (degrees) Length (feet)<br />
Middle 1 -43, 0 120 297<br />
“ 2 -43, 72 124 345<br />
“ 3 -43, 134 120 345<br />
“ 4 -43, 134 86 199<br />
South 1 -56, 90 280 235<br />
“ 2 unable to locate orig<strong>in</strong><br />
“ 3 -43, 230 280 223<br />
“ 4 -43, 300 280 223<br />
“ 5 unknown (endpo<strong>in</strong>t 14, 314)<br />
“ 6 unknown 10 151.5<br />
“ 7 111,451.5 10 135.5<br />
“ 8 146, 70 10 157<br />
“ 9 101,72 10? unknown<br />
“ 10 50, 74 10 57<br />
<strong>Lomatium</strong> <strong>cookii</strong> <strong>population</strong> <strong>monitor<strong>in</strong>g</strong> progress report, 2010 8
Life-history categories were orig<strong>in</strong>ally developed for <strong>Lomatium</strong> bradshawii <strong>monitor<strong>in</strong>g</strong> <strong>in</strong><br />
<strong>the</strong> Willamette <strong>Valley</strong> (Kaye et al. 2001). The similarities of <strong>the</strong> life-history characteristics of<br />
<strong>the</strong>se species cause <strong>the</strong> categories to be applicable to L. <strong>cookii</strong> as well. Reproductive plants were<br />
segregated by umbel number because studies of L. bradshawii have shown that one-umbel plants<br />
rarely produce seed, while two-umbel plants produce seed on <strong>the</strong> second umbel, and three umbel<br />
plants may produce many seeds (Kaye 1992, Kaye and Kirkland 1994).<br />
Demographic plots and analysis<br />
Demographic plots were established at <strong>the</strong> Middle and South sub<strong>population</strong>s <strong>in</strong> 1994.<br />
Sampl<strong>in</strong>g was suspended from 2000 through 2007 at <strong>the</strong> Middle sub<strong>population</strong> because sufficient<br />
<strong>in</strong>formation on <strong>population</strong> dynamics could be obta<strong>in</strong>ed from long-term study of one<br />
sub<strong>population</strong> to understand <strong>the</strong> basic life-history of <strong>the</strong> species and prepare a transition matrix<br />
model. In 2008 - 2010, <strong>the</strong> Middle sub<strong>population</strong> was resampled and <strong>the</strong> updated <strong>in</strong>formation is<br />
presented below. Demographic <strong>monitor<strong>in</strong>g</strong> at <strong>the</strong> South sub<strong>population</strong> has been consistent<br />
through <strong>the</strong> present year.<br />
Plot sampl<strong>in</strong>g: At each sub<strong>population</strong> (Middle and South), 20 exist<strong>in</strong>g density plots<br />
were randomly selected as locations for 0.5 meter x 0.5 meter demographic plots (Figure 7).<br />
With<strong>in</strong> each demographic plot, all L. <strong>cookii</strong> plants were mapped, given unique numbers<br />
(beg<strong>in</strong>n<strong>in</strong>g with #1), assigned to <strong>the</strong> life history categories discussed earlier, and <strong>the</strong> presence or<br />
absence of graz<strong>in</strong>g was recorded. To sample, a 0.5 meter x 0.5 meter frame was placed over <strong>the</strong><br />
left rebar post, with <strong>the</strong> post positioned <strong>in</strong> <strong>the</strong> lower left corner of <strong>the</strong> frame.<br />
Calculation of survival rates and estimates of fertility: All first year vegetative plants<br />
with one or two leaves (and occasionally cotyledons) were considered seedl<strong>in</strong>gs; larger plants<br />
that appeared without previous observation were considered seedl<strong>in</strong>gs <strong>the</strong> previous year. We<br />
used spreadsheet and database computer software to calculate <strong>the</strong> proportion of each stage that<br />
entered ano<strong>the</strong>r stage (or rema<strong>in</strong>ed <strong>the</strong> same) between consecutive years, and <strong>the</strong> proportion of<br />
<strong>in</strong>dividuals <strong>in</strong> each stage <strong>in</strong> each year. To estimate <strong>the</strong> number of seedl<strong>in</strong>gs produced by an<br />
<strong>in</strong>dividual <strong>in</strong> each reproductive stage (i.e., <strong>the</strong> fecundity of each stage), we used data on seed<br />
production from L. <strong>cookii</strong> sampled <strong>in</strong> 1996, <strong>the</strong> number of plants <strong>in</strong> each reproductive stage <strong>in</strong><br />
<strong>the</strong> density plots, and <strong>the</strong> number of seedl<strong>in</strong>gs observed <strong>the</strong> follow<strong>in</strong>g year <strong>in</strong> <strong>the</strong> density plots.<br />
These survival rates and estimates of fertility for each stage were arranged <strong>in</strong> 'transition matrices'<br />
for each pair of years from 1994 through 1999 and 2008 through 2010 for <strong>the</strong> Middle<br />
sub<strong>population</strong> and from 1994 through 2010 for <strong>the</strong> South sub<strong>population</strong>. See Kaye and Pyke<br />
(2003), Kaye et al. (2001), Caswell and Kaye (2001), or Menges (1986) for complete discussions<br />
of transition matrix models for plant <strong>population</strong> dynamics and viability analyses.<br />
Population Viability Analysis, determ<strong>in</strong>istic and stochastic model<strong>in</strong>g: We evaluated<br />
<strong>population</strong> growth rate and viability with <strong>the</strong> transition matrices us<strong>in</strong>g data from <strong>the</strong> South<br />
sub<strong>population</strong> from 1994-2010, and for <strong>the</strong> Middle sub<strong>population</strong> from 1994-1999 and 2008-<br />
2010. For this analysis, we calculated both determ<strong>in</strong>istic and stochastic measures of <strong>population</strong><br />
growth [lambda (λ), and stochastic lambda (λs)] for each sub<strong>population</strong>. Lambda is <strong>the</strong><br />
equilibrium <strong>population</strong> growth rate (and <strong>the</strong> dom<strong>in</strong>ant eigenvalue of <strong>the</strong> transition matrix), and<br />
can be used as a s<strong>in</strong>gle measure of <strong>population</strong> viability to compare sites. Stochastic lambda (λs)<br />
<strong>Lomatium</strong> <strong>cookii</strong> <strong>population</strong> <strong>monitor<strong>in</strong>g</strong> progress report, 2010 9
Figure 7. Sketch diagram of <strong>the</strong> orientation of <strong>the</strong> <strong>Lomatium</strong> <strong>cookii</strong> sampl<strong>in</strong>g and demographic<br />
subplots at <strong>the</strong> Middle (top) and South (bottom) sub<strong>population</strong>s at French Flat.<br />
<strong>Lomatium</strong> <strong>cookii</strong> <strong>population</strong> <strong>monitor<strong>in</strong>g</strong> progress report, 2010 10
does not assume equilibrium <strong>population</strong> dynamics and <strong>in</strong>corporates observed environmental<br />
variability. If ei<strong>the</strong>r type of growth rate is less than 1.0, <strong>the</strong> <strong>population</strong> will be projected to<br />
decrease <strong>in</strong> size, and eventually become ext<strong>in</strong>ct (a non-viable <strong>population</strong>). If lambda is greater<br />
than 1.0, <strong>the</strong> <strong>population</strong> will grow (a viable <strong>population</strong>), given that current conditions rema<strong>in</strong><br />
constant. For each site, we calculated lambda for each year of observation (i.e., 1994-99 and<br />
2008-2010 at Middle, and 1994-2010 at South). In addition, we used <strong>the</strong> average matrices from<br />
<strong>the</strong>se available matrices to calculate an average <strong>population</strong> growth rate.<br />
Assumptions of <strong>the</strong> model: Our use of <strong>the</strong> transition matrix model assumed that fertility<br />
and transition rates were <strong>in</strong>dependent of plant density. This is an acceptable assumption for<br />
many species with <strong>population</strong> densities below <strong>the</strong> density-dependent threshold (density-vague<br />
<strong>population</strong>s). However, density dependence eventually limits growth of <strong>population</strong>s with lambda<br />
greater than one. Demographic stochasticity was also ignored by our models, but it usually<br />
generates little variation <strong>in</strong> <strong>population</strong> dynamics relative to environmental stochasticity, except at<br />
very low <strong>population</strong> sizes (Menges 1992). Our model assumed that <strong>population</strong> growth is a firstorder<br />
Markov process, <strong>in</strong> which <strong>the</strong> probability that a plant will make a transition is <strong>in</strong>dependent<br />
of its stage <strong>in</strong> <strong>the</strong> previous year. In addition, we assumed that plants that first appeared <strong>in</strong> <strong>the</strong> V2<br />
stage were seedl<strong>in</strong>gs <strong>in</strong> <strong>the</strong> previous year, and that plants did not exhibit dormancy; years <strong>in</strong><br />
which plants were skipped were considered miss<strong>in</strong>g data. We tested <strong>the</strong>se assumptions with data<br />
collected through 2003, and <strong>the</strong>y were found to have little effect on <strong>population</strong> growth rate<br />
compared to alternative assumptions (e.g., that new V2 and V3 plants were seedl<strong>in</strong>gs <strong>in</strong> <strong>the</strong><br />
previous year, and that dormancy can occur).<br />
Analysis: We conducted a <strong>population</strong> viability analysis <strong>in</strong>corporat<strong>in</strong>g environmental<br />
stochasticity. Population viability was evaluated <strong>in</strong> two different ways, stochastic <strong>population</strong><br />
growth rate and ext<strong>in</strong>ction probability. This <strong>in</strong>volved project<strong>in</strong>g future <strong>population</strong> dynamics by<br />
randomly select<strong>in</strong>g survival and fecundity measures from past years. We <strong>in</strong>cluded environmental<br />
variability <strong>in</strong> our model through <strong>the</strong> matrix selection method. Matrix selection was accomplished<br />
by select<strong>in</strong>g a whole matrix at each time step, selected at random and with equal probability from<br />
<strong>the</strong> matrices available s<strong>in</strong>ce demographic <strong>monitor<strong>in</strong>g</strong> began <strong>in</strong> 1994. The matrices represent each<br />
year of <strong>the</strong> study, and <strong>the</strong> variation among <strong>the</strong>m is considered to be environmental stochasticity.<br />
To calculate stochastic <strong>population</strong> growth rate, we used <strong>the</strong> program LAMS (Kaye 2001) with<br />
100,000 iterations.<br />
We also calculated ext<strong>in</strong>ction probabilities for each sub<strong>population</strong> as a second measure of<br />
<strong>population</strong> viability. This k<strong>in</strong>d of model<strong>in</strong>g <strong>in</strong>volved project<strong>in</strong>g future <strong>population</strong> dynamics by<br />
randomly select<strong>in</strong>g survival and fecundity measures from past years with <strong>the</strong> matrix selection<br />
method. More detailed descriptions of this method can be found elsewhere (e.g., Burgman et al.<br />
1993, Kaye and Pyke 2002). These simulations ran for 20 years and consisted of 10,000<br />
iterations. The start<strong>in</strong>g <strong>population</strong> size for each simulation was 90,825 for <strong>the</strong> Middle<br />
sub<strong>population</strong> and 64,326 for <strong>the</strong> South sub<strong>population</strong> (<strong>the</strong> 2010 sizes), distributed among <strong>the</strong> six<br />
stages as follows: S=11%, V2=24%, V3=37%, R1=14%, R2=12%, and R3=2%. These<br />
proportions represent <strong>the</strong> average <strong>population</strong> structure. The simulations stopped at <strong>the</strong><br />
quasi-ext<strong>in</strong>ction threshold of 50% decl<strong>in</strong>e or 99% decl<strong>in</strong>e; this provided a conservative estimate<br />
of ext<strong>in</strong>ction dynamics. We used <strong>the</strong> program SHUFFLE (Kaye, unpublished program) written<br />
for MATLAB to evaluate ext<strong>in</strong>ction probability with matrix selection methods.<br />
In addition, we calculated elasticities of <strong>the</strong> mean matrix for both sites. Elasticities are<br />
<strong>Lomatium</strong> <strong>cookii</strong> <strong>population</strong> <strong>monitor<strong>in</strong>g</strong> progress report, 2010 11
<strong>the</strong> sensitivity of lambda to small changes <strong>in</strong> <strong>the</strong> transition probabilities. Elasticities provide<br />
valuable <strong>in</strong>formation about <strong>the</strong> extent to which <strong>population</strong> growth depends on survival, growth,<br />
and reproduction at different stages <strong>in</strong> <strong>the</strong> life-cycle (Caswell 1989). We used <strong>the</strong> commercially<br />
available computer software, MATLAB 6.1, to calculate elasticities.<br />
Environmental factors affect<strong>in</strong>g <strong>population</strong> dynamics: We also exam<strong>in</strong>ed correlations<br />
of environmental variables and <strong>population</strong> growth rate at <strong>the</strong> South sub<strong>population</strong>. Stepwise<br />
multiple regression was used to build models with data from 1994 - 2003 and <strong>the</strong> models were<br />
validated with data obta<strong>in</strong>ed from <strong>the</strong> Middle sub<strong>population</strong>. Seasonal precipitation and<br />
herbivory by voles were <strong>the</strong> environmental variables exam<strong>in</strong>ed. We obta<strong>in</strong>ed precipitation<br />
records from <strong>the</strong> Oregon Climate Service website for <strong>the</strong> Cave Junction wea<strong>the</strong>r station.<br />
Monthly precipitation amounts for each year of <strong>the</strong> study were comb<strong>in</strong>ed <strong>in</strong>to functionally<br />
seasonal precipitation measures as follows: fall (September through November), w<strong>in</strong>ter<br />
(December through February), spr<strong>in</strong>g (March through April), and summer (May through August).<br />
Vole herbivory, or graz<strong>in</strong>g, was measured as frequency of damage to plants by voles as recorded<br />
on our field data sheets. This type of damage was encountered as eaten leaf stems or flower<br />
clusters.<br />
Rough and Ready Creek<br />
The <strong>population</strong> at Rough and Ready Creek was documented <strong>in</strong> 1993 (Kagan 1994). One<br />
patch of plants at this location is on BLM-managed land and was identified as a potential site for<br />
long-term <strong>monitor<strong>in</strong>g</strong>.<br />
In 1994, we established three transects for long-term <strong>monitor<strong>in</strong>g</strong> of <strong>the</strong> two densest<br />
patches of L. <strong>cookii</strong> (plants <strong>in</strong> <strong>the</strong> rema<strong>in</strong><strong>in</strong>g patches were simply counted and <strong>the</strong> patches were<br />
mapped; Figure 8). To sample <strong>the</strong>se transects, a 1 meter x 1 meter quadrat frame (constructed<br />
from light-weight ¾ <strong>in</strong>ch PVC pipe) was placed on <strong>the</strong> ground at each meter mark along a<br />
measur<strong>in</strong>g-tape stretched between rebar posts (Figure 9). The <strong>in</strong>dividuals rooted with<strong>in</strong> <strong>the</strong><br />
frame were counted and assigned to <strong>the</strong> same stage categories used at French Flat.<br />
Transects 1 and 2 are positioned with<strong>in</strong> patch A (Figure 8). The orig<strong>in</strong> for transect 1 was<br />
a rebar post set about 1 meter south of a flagged conifer and <strong>the</strong> endpo<strong>in</strong>t was a rebar post set 15<br />
meters away at a bear<strong>in</strong>g of 130º east. The orig<strong>in</strong> for transect 2 was a rebar post set 2 meters east<br />
of <strong>the</strong> orig<strong>in</strong>-post for transect 1 and <strong>the</strong> endpo<strong>in</strong>t was a rebar post set 15 meters away at a bear<strong>in</strong>g<br />
of 130º east. Thus, transect 2 is adjacent and parallel to transect 1. [Note: In 1994, <strong>the</strong> orig<strong>in</strong> for<br />
transect 2 was <strong>the</strong> same as used for <strong>the</strong> orig<strong>in</strong> of transect 1; however, <strong>the</strong> plots along transect 2<br />
began at <strong>the</strong> 3 meter mark to prevent overlap of plots 1, 2, and 3 along transect 1. The endpo<strong>in</strong>t<br />
for transect 2 was a rebar post set 15 meters away at a bear<strong>in</strong>g of 110º east from <strong>the</strong> orig<strong>in</strong> post.<br />
This arrangement was altered <strong>in</strong> 1995 to reduce confusion.] Transect 3 (patch G) was located<br />
along <strong>the</strong> shoulder of <strong>the</strong> south side of <strong>the</strong> road across from transects 1 and 2. The orig<strong>in</strong> rebar<br />
was located just above <strong>the</strong> shoulder of <strong>the</strong> road at a bear<strong>in</strong>g of 150º east from <strong>the</strong> flagged conifer.<br />
This transect changed bear<strong>in</strong>g at <strong>the</strong> 4.5 meter mark to accommodate <strong>the</strong> curve of <strong>the</strong> road. A<br />
second rebar post was set at 4.5 meters at a bear<strong>in</strong>g of 120º east and <strong>the</strong> endpo<strong>in</strong>t rebar was set at<br />
a bear<strong>in</strong>g of 134º east and a distance of 7.8 meters from <strong>the</strong> second rebar post. Transect 3<br />
parallels <strong>the</strong> shoulder of <strong>the</strong> road and passes through very dense patches of poison oak. In 2010<br />
transect tapes were laid out along wheel ruts to def<strong>in</strong>e patches B, C, D, E and F.<br />
<strong>Lomatium</strong> <strong>cookii</strong> <strong>population</strong> <strong>monitor<strong>in</strong>g</strong> progress report, 2010 12
Figure 8. Sketch map of <strong>the</strong> L. <strong>cookii</strong> patches located at Rough and Ready Botanical<br />
Wayside. Cross-hatch<strong>in</strong>g <strong>in</strong>dicates patches of plants. The long-term <strong>monitor<strong>in</strong>g</strong> transects are<br />
also <strong>in</strong>dicated <strong>in</strong> <strong>the</strong> draw<strong>in</strong>g. Note that <strong>the</strong> patches are dist<strong>in</strong>guished by <strong>the</strong> letters A-H.<br />
<strong>Lomatium</strong> <strong>cookii</strong> <strong>population</strong> <strong>monitor<strong>in</strong>g</strong> progress report, 2010 13
Transects 1 and 2:<br />
Transect l<strong>in</strong>e; plots oriented to ei<strong>the</strong>r side of tape.<br />
1 2 3 4 5 6 7 8 9 10 11 12 13 14 15<br />
16 17 18 19 20 21 22 23 24 25 26 27 28 29 30<br />
Transect 3:<br />
Figure 9. Orientation of <strong>the</strong> sampl<strong>in</strong>g plots around transects 1, 2 and 3 at <strong>the</strong> Rough and<br />
Ready Botanical Wayside <strong>population</strong>.<br />
Indian Hill<br />
The <strong>population</strong> of L. <strong>cookii</strong> at Indian Hill was first documented <strong>in</strong> 1996, and <strong>monitor<strong>in</strong>g</strong><br />
was <strong>in</strong>itiated <strong>in</strong> 1997. The <strong>population</strong> occurs on BLM managed land, but access is through<br />
private land. The <strong>population</strong> occupies a long str<strong>in</strong>ger of open vegetation surrounded by dense<br />
forest, and extends to near <strong>the</strong> banks of <strong>the</strong> West Fork Ill<strong>in</strong>ois River.<br />
In 1997, we established a grid system over <strong>the</strong> <strong>population</strong>. The perimeter of <strong>the</strong><br />
<strong>population</strong> was carefully outl<strong>in</strong>ed to determ<strong>in</strong>e <strong>the</strong> extent of <strong>the</strong> plants and available habitat. The<br />
grid system had a bear<strong>in</strong>g of 30º along its long axis for <strong>the</strong> first 100 meters, <strong>the</strong>n shifted<br />
westward to 5º for ano<strong>the</strong>r 100 meters <strong>in</strong> order to conform to <strong>the</strong> shape of <strong>the</strong> habitat. Ten plots<br />
were sampled out of a total of 184 possible sample plot locations with<strong>in</strong> <strong>the</strong> overall grid (Figure<br />
10). All plots were 50 meters x 0.5 meters and were permanently marked at each end with rebar<br />
posts marked with flagg<strong>in</strong>g and copper tags with <strong>the</strong> plot number scratched onto <strong>the</strong> surface. To<br />
sample <strong>the</strong>se plots, a 50 meter measur<strong>in</strong>g tape was extended between rebar posts. The tape<br />
represented <strong>the</strong> west edge of <strong>the</strong> plot. Individual L. <strong>cookii</strong> plants that occurred with<strong>in</strong> <strong>the</strong> plots<br />
(between <strong>the</strong> tape and 0.5 meter east) were counted and assigned to <strong>the</strong> same stage categories<br />
used at French Flat. Poison oak is patchy <strong>in</strong> this area, especially along <strong>the</strong> forest edges, so care<br />
should be exercised to m<strong>in</strong>imize exposure. Also, <strong>Lomatium</strong> utriculatum and <strong>Lomatium</strong><br />
triternatum, which may resemble L. <strong>cookii</strong>, occur <strong>in</strong> this area and were encountered <strong>in</strong> <strong>the</strong><br />
sampl<strong>in</strong>g plots (Figure 11).<br />
<strong>Lomatium</strong> <strong>cookii</strong> <strong>population</strong> <strong>monitor<strong>in</strong>g</strong> progress report, 2010 14
Figure 10. Plot layout of <strong>the</strong> <strong>Lomatium</strong> <strong>cookii</strong> <strong>population</strong> at Indian Hill. Sample plots are<br />
50 meters x 0.5 meters, marked at ei<strong>the</strong>r end by a rebar post (with a copper tag and<br />
flagg<strong>in</strong>g). The plots are monitored on <strong>the</strong> east side of <strong>the</strong> tape.<br />
<strong>Lomatium</strong> <strong>cookii</strong> <strong>population</strong> <strong>monitor<strong>in</strong>g</strong> progress report, 2010 15
Figure 11. <strong>Lomatium</strong> triternatum (left), L. <strong>cookii</strong> (center), and L. utriculatum (right). These<br />
species can co-occur <strong>in</strong> sampl<strong>in</strong>g plots.<br />
French Flat<br />
RESULTS<br />
Population size and density<br />
In general, <strong>population</strong> size at <strong>the</strong> South sub<strong>population</strong> <strong>in</strong>creased steadily from 25,538<br />
(90% C.I.: 17,398 – 33,677) <strong>in</strong> 1993 to a peak of 124,890 (90% C.I.: 100,680 - 149,100) <strong>in</strong> 1998<br />
(Figure 12, Table 2). This <strong>in</strong>crease was due to several years of high seedl<strong>in</strong>g recruitment. From<br />
1999 - 2007, with <strong>the</strong> exception of 2005, total <strong>population</strong> size decl<strong>in</strong>ed to 37,531 (90% C.I.:<br />
30,600 - 44,462). The <strong>population</strong> size has <strong>in</strong>creased s<strong>in</strong>ce 2007 by approximately 71% to 64,326<br />
(90% C.I.: 51,083 – 77,569). The proportion of reproductive plants <strong>in</strong> <strong>the</strong> <strong>population</strong> decl<strong>in</strong>ed<br />
from 1995 to 1997, reflect<strong>in</strong>g <strong>the</strong> <strong>in</strong>creased recruitment of seedl<strong>in</strong>gs that led to <strong>the</strong> total<br />
<strong>population</strong> <strong>in</strong>creases observed <strong>in</strong> that time period (Figure 12 & 13). In general, <strong>the</strong> proportion of<br />
reproductive plants relative to <strong>the</strong> total <strong>population</strong> has <strong>in</strong>creased, though <strong>in</strong> 2010 <strong>the</strong> proportion<br />
dropped an additional 2% to 27%, aga<strong>in</strong> reflect<strong>in</strong>g <strong>in</strong>creased recruitment <strong>in</strong> recent years. In<br />
2010, <strong>the</strong> density at <strong>the</strong> South sub<strong>population</strong> was 17 ± 2.2 (±1 S.E.) plants/m 2 , approximately ⅔<br />
of <strong>the</strong> long-term average. Density <strong>in</strong> this sub<strong>population</strong> has ranged from a low of 7 plants/m 2 <strong>in</strong><br />
1993 to a high of 33 plants/m 2 <strong>in</strong> 1997 and 1998 (Table 2).<br />
The Middle sub<strong>population</strong> has been mirror<strong>in</strong>g <strong>the</strong> trends of <strong>the</strong> South sub<strong>population</strong><br />
(Figure 12). Population size grew from 88,688 (90% C.I: 68,062 - 109,313) <strong>in</strong> 1993 to a high of<br />
231,600 (90% C.I.: 191,710 - 271,490) <strong>in</strong> 2003. Although <strong>the</strong> <strong>population</strong> <strong>in</strong>creased <strong>in</strong> 2009,<br />
numbers decl<strong>in</strong>ed 20% <strong>in</strong> 2010 to 90,825 (70,271 – 111,379). After reach<strong>in</strong>g a high of 41% <strong>in</strong><br />
2008, <strong>the</strong> proportion of reproductive plants cont<strong>in</strong>ued a downward trend, fall<strong>in</strong>g an additional 4%<br />
to 27% <strong>in</strong> 2010 (Figure 13). In 2010, <strong>the</strong> density at <strong>the</strong> middle sub<strong>population</strong> was 16.4 ± 2.3 (±1<br />
S.E.) plants/m 2 , 65% of <strong>the</strong> long-term average. Density <strong>in</strong> this sub<strong>population</strong> has ranged from a<br />
low of 14.2 plants/m 2 <strong>in</strong> 1994 to a high of 41.7 plants/m 2 <strong>in</strong> 1998 (Table 2).<br />
<strong>Lomatium</strong> <strong>cookii</strong> <strong>population</strong> <strong>monitor<strong>in</strong>g</strong> progress report, 2010 16
Figure 12. The total number of reproductive <strong>Lomatium</strong> <strong>cookii</strong> at Middle and South<br />
French Flat. Error bars represent a 90% confidence <strong>in</strong>terval.<br />
Figure 13. The number of reproductive <strong>Lomatium</strong> <strong>cookii</strong> relative to <strong>the</strong> total<br />
sub<strong>population</strong> at Middle and South French Flat.<br />
<strong>Lomatium</strong> <strong>cookii</strong> <strong>population</strong> <strong>monitor<strong>in</strong>g</strong> progress report, 2010 17
Table 2. Summary of <strong>Lomatium</strong> <strong>cookii</strong> <strong>population</strong> data for <strong>the</strong> Middle and South French Flat<br />
sub<strong>population</strong>s, 1993-2009. Population size and density estimates <strong>in</strong>clude all life-history stages<br />
from seedl<strong>in</strong>gs to large reproductive plants.<br />
Year Population Size (90% CI) Density (plant m -2 ) ± 1 SE<br />
French Flat Middle<br />
1993 88,688 (68,062 – 109,314) 16.0 ± 2.3<br />
1994 95,250 (71,556 – 118,944) 14.2 ± 2.6<br />
1995 100,575 (77,611 – 123,539) 18.1 ± 2.5<br />
1996 92,850 (75,120 – 110,580) 16.7 ± 2.0<br />
1997 217,050 (178,785 – 255,315) 39.1 ± 4.2<br />
1998 231,600 (191,710 – 271,490) 41.7 ± 4.4<br />
1999 217,200 (179,683 – 254,717) 39.1 ± 4.1<br />
2000 167,250 (138,630 – 195,870) 30.1 ± 3.2<br />
2001 173,100 (143,123 – 20,3077) 31.2 ± 3.3<br />
2002 180,000 (150,522 – 209,478) 32.4 ± 3.3<br />
2003 163,575 (132,505 – 194,645) 29.5 ± 3.4<br />
2004 125,175 (99,990 – 150,360) 22.6 ± 2.8<br />
2005 137,550 (110,795 – 164,305) 24.8 ± 3.0<br />
2006 111,000 (85,810 – 136,190) 20.0 ± 2.8<br />
2007 108,825 (83,640 – 134,010) 19.6 ± 2.8<br />
2008 107,325 (87,378 – 127,272) 19.3 ± 2.2<br />
2009 113,775 (90,453 – 137,097) 20.5 ± 2.6<br />
2010 90,825 (70,271 – 111,379) 16.4 ± 2.3<br />
French Flat South<br />
1993 25,538 (17,398 – 33,677) 6.8 ± 1.3<br />
1994 77,081 (56,365 – 97,797) 20.6 ± 3.4<br />
1995 79,192 (61,580 – 96,804) 21.2 ± 2.9<br />
1996 115,714 (92,114 – 139,314) 31.0 ± 3.9<br />
1997 123,697 (96,985 – 150,409) 33.1 ± 4.4<br />
1998 124,890 (100,680 – 149,100) 33.4 ± 4.0<br />
1999 111,786 (87,872 – 135,664) 29.9 ± 3.9<br />
2000 94,517 (76,737 – 112,572) 25.3 ± 3.0<br />
2001 81,807 (65,258 – 98,356) 21.9 ± 2.7<br />
2002 81,624 (64,970 – 98,278) 21.8 ± 2.7<br />
2003 72,402 (57,286 – 87,518) 19.4 ± 2.5<br />
2004 52,948 (44,380 – 61,515) 14.2 ± 1.4<br />
2005 57,719 (46,697 – 68,741) 15.4 ± 1.8<br />
2006 45,928 (37,388 – 54,467) 12.3 ± 1.4<br />
2007 37,531 (30,600 – 44,462) 10.0 ± 1.1<br />
2008 50,975 (42,527 – 59,423) 13.6 ± 1.4<br />
2009 60,748 (47,545 – 73,951) 16.3 ± 2.2<br />
2010 64,326 (51,083 – 77,569) 17.2± 2.2<br />
<strong>Lomatium</strong> <strong>cookii</strong> <strong>population</strong> <strong>monitor<strong>in</strong>g</strong> progress report, 2010 18
Figure 14. <strong>Lomatium</strong> <strong>cookii</strong> <strong>population</strong> structure <strong>in</strong> 2010 (top) and averaged over <strong>the</strong> course of <strong>the</strong> study<br />
(bottom) for <strong>the</strong> Middle French Flat sub<strong>population</strong> (1994 - 2010), South French Flat sub<strong>population</strong> (1994 -<br />
2010), Rough and Ready Creek (1995 - 2010), and Indian Hill (1997 - 2010). Bars <strong>in</strong>dicate <strong>the</strong> mean<br />
percentage of plants <strong>in</strong> each stage. See text for explanation of life-history stages. Error bars <strong>in</strong> <strong>the</strong> lower<br />
graph represent +1 SE.<br />
<strong>Lomatium</strong> <strong>cookii</strong> <strong>population</strong> <strong>monitor<strong>in</strong>g</strong> progress report, 2010 19
Population structure<br />
In 2010, <strong>the</strong> Middle and South sub<strong>population</strong>s at French Flat were dom<strong>in</strong>ated by vegetative<br />
(V1-3) and small reproductive (R1) <strong>in</strong>dividuals (Figure 14). Previously, only <strong>the</strong> vegetative classes<br />
were dom<strong>in</strong>ant.<br />
Demography and Population Viability Analysis<br />
A total of 960 plants were mapped and categorized at <strong>the</strong> Middle sub<strong>population</strong> from 1994<br />
through 1999 and 2008 through 2010 and 814 at <strong>the</strong> South sub<strong>population</strong> from 1994 through 2010.<br />
Data from <strong>the</strong>se 0.5 meter x 0.5 meter demographic plots were analyzed to construct transition<br />
matrices for Middle and South sub<strong>population</strong>s (Table 3).<br />
Determ<strong>in</strong>istic growth rates at Middle and South have fluctuated s<strong>in</strong>ce <strong>monitor<strong>in</strong>g</strong> began,<br />
<strong>in</strong>dicat<strong>in</strong>g that <strong>the</strong> French Flat L. <strong>cookii</strong> <strong>population</strong>s vary <strong>in</strong> <strong>population</strong> dynamics over time (Table<br />
4). Growth rates were at or above 1.0 at Middle from 1994 through 1998 but fell to 0.892 <strong>in</strong> 1998<br />
– 1999. In 2008 – 2010, growth rates were also low at 0.854 and 0.831. Growth rates at South<br />
have experienced a downward trend s<strong>in</strong>ce 1995 - 1996, when <strong>the</strong> <strong>population</strong> grew at its highest<br />
recorded rate of 1.475. Except for 2001 – 2002 and 2006 – 2007, growth rates at South have<br />
rema<strong>in</strong>ed below 1.0 s<strong>in</strong>ce <strong>the</strong>n. The lowest <strong>population</strong> growth rate, 0.647, was observed <strong>in</strong> 1998 –<br />
1999, reflect<strong>in</strong>g <strong>the</strong> low retention of large reproductive plants <strong>in</strong> 1999.<br />
In stochastic simulations <strong>in</strong>corporat<strong>in</strong>g environmental variability, South was projected to<br />
decl<strong>in</strong>e at an overall rate of 0.902. This reflects <strong>the</strong> overall poor annual growth rates at this site<br />
s<strong>in</strong>ce <strong>monitor<strong>in</strong>g</strong> began <strong>in</strong> 1994. At Middle, stochastic growth rate was much higher, 1.024, but<br />
this value represents observations from 1994-1999 and 2008-10 only. The risk of sharp decl<strong>in</strong>e<br />
(50% drop) <strong>in</strong> 20 years was 97.5% at South and less than 17.8% at Middle. At <strong>the</strong> South<br />
sub<strong>population</strong>, <strong>the</strong> risk of 99% decl<strong>in</strong>e <strong>in</strong> 20 years was 0.1% and 0% at Middle.<br />
Thus, both determ<strong>in</strong>istic and stochastic growth rates project that <strong>the</strong> South sub<strong>population</strong><br />
will decl<strong>in</strong>e rapidly and substantially <strong>in</strong> <strong>the</strong> next two decades. These results are speculative,<br />
however, and additional years of data may show different trends if conditions at <strong>the</strong>se locations<br />
change. The <strong>population</strong> growth rates and probabilities of decl<strong>in</strong>e reported here are best <strong>in</strong>terpreted<br />
as comparisons of <strong>the</strong> performance of <strong>the</strong>se two sub<strong>population</strong>s ra<strong>the</strong>r than accurate predictions of<br />
future trends.<br />
The elasticity analysis shows that small changes <strong>in</strong> <strong>the</strong> probability of V3 plants rema<strong>in</strong><strong>in</strong>g<br />
<strong>in</strong> <strong>the</strong> V3 stage (0.161 at South and 0.155 at Middle) would have <strong>the</strong> s<strong>in</strong>gle greatest effect on <strong>the</strong><br />
<strong>population</strong> growth rate <strong>in</strong> Middle (Table 5). The probability of R3 plants rema<strong>in</strong><strong>in</strong>g at <strong>the</strong> R3 stage<br />
had <strong>the</strong> greatest effect at South (0.165) while <strong>the</strong> probability of R1 plants rema<strong>in</strong><strong>in</strong>g at <strong>the</strong> R1 stage<br />
had <strong>the</strong> second greatest effect at Middle (0.112). Overall, V3 plants had <strong>the</strong> highest cumulative<br />
elasticity (0.294 at South and 0.275 at Middle). The second highest elasticity was for <strong>the</strong> R3 stage<br />
(0.218) at South and R1 plants (0.220) at Middle. The seedl<strong>in</strong>g and V2 stages had <strong>the</strong> lowest<br />
cumulative elasticities (Table 5).<br />
Annual mortality was generally lower <strong>in</strong> <strong>the</strong> Middle sub<strong>population</strong> than <strong>the</strong> South (Table<br />
4). These mortality rates <strong>in</strong> <strong>the</strong> face of variable (sometimes positive) <strong>population</strong> growth over <strong>the</strong><br />
same period <strong>in</strong>dicate that <strong>the</strong> <strong>population</strong>s experience substantial dynamics, with <strong>in</strong>dividuals<br />
frequently chang<strong>in</strong>g size or dy<strong>in</strong>g with a variable <strong>in</strong>flux of new plants. Complete <strong>in</strong>formation has<br />
not been tabulated on <strong>the</strong> life span of L. <strong>cookii</strong> <strong>in</strong>dividuals, but <strong>the</strong> <strong>in</strong>formation collected from <strong>the</strong><br />
<strong>Lomatium</strong> <strong>cookii</strong> <strong>population</strong> <strong>monitor<strong>in</strong>g</strong> progress report, 2010 20
demographic plots can be used to determ<strong>in</strong>e or estimate how long <strong>in</strong>dividual plants live, if <strong>the</strong> plots<br />
are sampled annually for several years. Of 65 seedl<strong>in</strong>gs mapped at South <strong>in</strong> 1994, 3 were still<br />
present <strong>in</strong> 2010 and 1 of <strong>the</strong>m was reproductive. On average, less than half (45.7%) of seedl<strong>in</strong>gs<br />
survive for two years. Only 29 observed seedl<strong>in</strong>gs became reproductive after one year <strong>in</strong> <strong>the</strong> South<br />
sub<strong>population</strong> dur<strong>in</strong>g this entire study. We found that 6.0% of seedl<strong>in</strong>gs became reproductive <strong>in</strong> 2<br />
years, 9.2% <strong>in</strong> 3 years, and 8.9% <strong>in</strong> 4 years.<br />
Environmental factors affect<strong>in</strong>g <strong>Lomatium</strong> <strong>cookii</strong> at French Flat<br />
Herbivory by voles dur<strong>in</strong>g <strong>the</strong> previous year and fall precipitation were identified by<br />
stepwise multiple regression as <strong>the</strong> best explanatory variables of <strong>population</strong> growth rate of <strong>the</strong><br />
South sub<strong>population</strong> (Figure 15). A total of 75% of <strong>the</strong> annual variation <strong>in</strong> <strong>population</strong> growth rate<br />
was expla<strong>in</strong>ed by frequency of herbivory (P = 0.004) and fall precipitation (September through<br />
November, P = 0.015). Both variables had a negative effect on <strong>population</strong> growth rate. When this<br />
model was applied to <strong>the</strong> <strong>population</strong> growth rate of <strong>the</strong> Middle sub<strong>population</strong>, it expla<strong>in</strong>ed 77% of<br />
<strong>the</strong> annual variation, but <strong>the</strong> variables were not significant at <strong>the</strong> 0.05 level (herbivory: P = 0.093,<br />
fall precipitation: P = 0.061). Both variables had a negative effect on <strong>population</strong> growth rate at <strong>the</strong><br />
Middle sub<strong>population</strong> as well.<br />
In an effort to understand how herbivory and precipitation were <strong>in</strong>fluenc<strong>in</strong>g <strong>population</strong><br />
growth rate, <strong>the</strong> variables were correlated with seedl<strong>in</strong>g production per reproductive plant (R2 and<br />
R3 plants comb<strong>in</strong>ed) present <strong>the</strong> previous year. Vole herbivory may damage plants by remov<strong>in</strong>g<br />
photosyn<strong>the</strong>tic tissue (leaves and stems) as well as reduce or elim<strong>in</strong>ate seed production if flower<br />
stalks are consumed. At <strong>the</strong> South sub<strong>population</strong>, herbivory <strong>in</strong> <strong>the</strong> previous year and fall<br />
precipitation were <strong>the</strong> only variables significant at <strong>the</strong> 0.1 level, expla<strong>in</strong><strong>in</strong>g 65% of <strong>the</strong> annual<br />
variation <strong>in</strong> seedl<strong>in</strong>g production (Figure 16). Herbivory frequency (P = 0.008) and fall precipitation<br />
(P = 0.057) were both negatively correlated with seedl<strong>in</strong>g production. This model was also applied<br />
to <strong>the</strong> Middle sub<strong>population</strong>, where graz<strong>in</strong>g (P = 0.105) and fall precipitation (P = 0.040) were<br />
found to expla<strong>in</strong> 43% of <strong>the</strong> annual variation. Both were negatively correlated with seedl<strong>in</strong>g<br />
production.<br />
From <strong>the</strong> elasticity analysis, changes <strong>in</strong> <strong>the</strong> probability of seedl<strong>in</strong>g production from both R2<br />
and R3 plants is expected to have some effect on <strong>population</strong> growth rate (0.067 at South and 0.081<br />
at Middle, Table 5) but this number is lower than <strong>the</strong> effect expected from changes <strong>in</strong> <strong>the</strong> V3 to V3<br />
transition (i.e. that large vegetative <strong>in</strong>dividuals rema<strong>in</strong> large; 0.161 and 0.155 for <strong>the</strong> South and<br />
Middle sub<strong>population</strong>s, respectively). Thus, some of <strong>the</strong> variability <strong>in</strong> <strong>population</strong> growth rate<br />
expla<strong>in</strong>ed by <strong>the</strong> regression model is likely due to changes <strong>in</strong> probabilities of transition<strong>in</strong>g between<br />
o<strong>the</strong>r growth stages that correlate with changes <strong>in</strong> graz<strong>in</strong>g frequency and fall precipitation. For<br />
example, an R3 or V3 plant that is heavily grazed <strong>in</strong> one year may be more likely to return <strong>the</strong><br />
follow<strong>in</strong>g year at a smaller stage than to rema<strong>in</strong> at its current stage. Because of <strong>the</strong> high sensitivity<br />
of <strong>the</strong> <strong>population</strong> growth rate to changes <strong>in</strong> <strong>the</strong>se transition probabilities, this could have a<br />
substantial effect on <strong>population</strong> growth rate.<br />
<strong>Lomatium</strong> <strong>cookii</strong> <strong>population</strong> <strong>monitor<strong>in</strong>g</strong> progress report, 2010 21
Table 3. Average transition matrices used <strong>in</strong> <strong>the</strong> stochastic analyses for L. <strong>cookii</strong> at French Flat.<br />
The top row of each matrix represents <strong>the</strong> number of seedl<strong>in</strong>gs produced per reproductive plant<br />
(fecundity). Lower rows represent <strong>the</strong> probability of an <strong>in</strong>dividual <strong>in</strong> a given stage chang<strong>in</strong>g to<br />
ano<strong>the</strong>r stage <strong>the</strong> follow<strong>in</strong>g year. Stage-specific mortality is provided <strong>in</strong> <strong>the</strong> bottom row. The<br />
elements <strong>in</strong> <strong>the</strong> matrices are averaged from <strong>the</strong> transition data collected <strong>in</strong> 1994 through 2009 for<br />
<strong>the</strong> South sub<strong>population</strong> and 1994 through 1999 and 2008 through 2009 for <strong>the</strong> Middle<br />
sub<strong>population</strong>.<br />
South, average matrix (1994-2010), lambda = 0.924<br />
S V2 V3 R1 R2 R3<br />
S 0.000 0.000 0.000 0.000 0.543 3.378<br />
V2 0.417 0.267 0.107 0.036 0.033 0.026<br />
V3 0.262 0.361 0.442 0.213 0.090 0.000<br />
R1 0.029 0.022 0.139 0.241 0.227 0.181<br />
R2 0.025 0.002 0.076 0.220 0.253 0.167<br />
R3 0.004 0.000 0.010 0.033 0.119 0.429<br />
Mortality 0.264 0.347 0.227 0.257 0.279 0.197<br />
Middle, average matrix (1994-1999 & 2008-2010), lambda = 1.042<br />
S V2 V3 R1 R2 R3<br />
S 0.000 0.000 0.000 0.000 0.819 2.419<br />
V2 0.525 0.415 0.101 0.034 0.043 0.000<br />
V3 0.210 0.321 0.526 0.158 0.086 0.007<br />
R1 0.030 0.023 0.164 0.422 0.253 0.351<br />
R2 0.015 0.010 0.064 0.231 0.331 0.205<br />
R3 0.006 0.006 0.015 0.061 0.172 0.362<br />
Mortality 0.214 0.225 0.129 0.094 0.115 0.075<br />
<strong>Lomatium</strong> <strong>cookii</strong> <strong>population</strong> <strong>monitor<strong>in</strong>g</strong> progress report, 2010 22
Table 4. Population growth and mortality rates at <strong>the</strong> French Flat Middle and South sub<strong>population</strong>s<br />
from 1994 - 2010. [Note: Demographic data was not collected at <strong>the</strong> Middle<br />
sub<strong>population</strong> from 2000 through 2007.]<br />
Lambda Mortality (%)<br />
year Middle South Middle South<br />
1994-1995 1.193 1.159 17 36<br />
1995-1996 1.422 1.475 19 14<br />
1996-1997 1.015 0.812 11 32<br />
1997-1998 1.135 0.938 10 25<br />
1998-1999 0.892 0.647 12 31<br />
1999-2000 N/A 0.789 N/A 19<br />
2000-2001 N/A 0.764 N/A 26<br />
2001-2002 N/A 1.119 N/A 25<br />
2002-2003 N/A 0.701 N/A 33<br />
2003-2004 N/A 0.826 N/A 28<br />
2004-2005 N/A 0.808 N/A 36<br />
2005-2006 N/A 0.948 N/A 18<br />
2006-2007 N/A 1.013 N/A 30<br />
2007-2008 N/A 0.883 N/A 22<br />
2008-2009 0.854 0.854 21 29<br />
2009-2010 0.831 0.983 26 24<br />
<strong>Lomatium</strong> <strong>cookii</strong> <strong>population</strong> <strong>monitor<strong>in</strong>g</strong> progress report, 2010 23
Table 5. Elasticity matrices of <strong>the</strong> South and Middle <strong>Lomatium</strong> <strong>cookii</strong> sub<strong>population</strong>s derived<br />
from <strong>the</strong> average transition matrices. Elasticities represent <strong>the</strong> relative sensitivity of <strong>the</strong> <strong>population</strong><br />
growth rate (lambda) to small changes <strong>in</strong> <strong>the</strong> transition probabilities. The sum of all elasticities is<br />
1.0, and <strong>the</strong> sum of each column is <strong>the</strong> total proportional sensitivity of lambda to changes <strong>in</strong><br />
transition probabilities <strong>in</strong> that stage. The top two <strong>in</strong>dividual elasticities are shown <strong>in</strong> bold.<br />
South sub<strong>population</strong><br />
S V2 V3 R1 R2 R3<br />
S 0.0000 0.0000 0.0000 0.0000 0.0267 0.0403<br />
V2 0.0297 0.0447 0.0333 0.0048 0.0008 0.0002<br />
V3 0.0257 0.0627 0.1613 0.0375 0.0063 0.0000<br />
R1 0.0026 0.0048 0.0525 0.0568 0.0356 0.0065<br />
R2 0.0066 0.0014 0.0353 0.0493 0.0500 0.0062<br />
R3 0.0024 0.0000 0.0112 0.0105 0.0292 0.1650<br />
sum 0.0670 0.1137 0.2936 0.1588 0.1487 0.2182<br />
Middle sub<strong>population</strong><br />
S V2 V3 R1 R2 R3<br />
S 0.0000 0.0000 0.0000 0.0000 0.0295 0.0516<br />
V2 0.0327 0.0509 0.0211 0.0062 0.0026 0.0000<br />
V3 0.0267 0.0487 0.1547 0.0367 0.0080 0.0001<br />
R1 0.0038 0.0052 0.0608 0.1116 0.0289 0.0096<br />
R2 0.0111 0.0025 0.0307 0.0515 0.0549 0.0155<br />
R3 0.0068 0.0060 0.0077 0.0138 0.0425 0.0677<br />
sum 0.0810 0.1134 0.2750 0.2199 0.1663 0.1445<br />
<strong>Lomatium</strong> <strong>cookii</strong> <strong>population</strong> <strong>monitor<strong>in</strong>g</strong> progress report, 2010 24
<strong>population</strong> growth rate<br />
<strong>population</strong> growth rate<br />
1.6<br />
1.4<br />
1.2<br />
1<br />
0.8<br />
0.6<br />
0.4<br />
0.2<br />
0<br />
1.6<br />
1.4<br />
1.2<br />
1<br />
0.8<br />
0.6<br />
0.4<br />
0.2<br />
0<br />
0 5 10 15 20 25 30<br />
fall precipitation (<strong>in</strong>.)<br />
0 0.05 0.1 0.15 0.2 0.25 0.3<br />
graz<strong>in</strong>g frequency<br />
Figure 15. Relationship between <strong>population</strong> growth rate at <strong>the</strong> South sub<strong>population</strong> and fall<br />
precipitation <strong>in</strong> <strong>the</strong> previous year (top, R 2 = 0.3509, P = 0.015) and graz<strong>in</strong>g frequency of plants<br />
<strong>in</strong> <strong>the</strong> previous year (bottom, R 2 = 0.6664, P = 0.0004).<br />
<strong>Lomatium</strong> <strong>cookii</strong> <strong>population</strong> <strong>monitor<strong>in</strong>g</strong> progress report, 2010 25
seedl<strong>in</strong>gs/reproductive plant<br />
seedl<strong>in</strong>gs/reproductive plant<br />
5<br />
4<br />
3<br />
2<br />
1<br />
0<br />
5<br />
4<br />
3<br />
2<br />
1<br />
0<br />
0 5 10 15 20 25 30<br />
fall precipitation (<strong>in</strong>)<br />
0 0.05 0.1 0.15 0.2 0.25 0.3<br />
graz<strong>in</strong>g frequency<br />
Figure 16. Relationship between seedl<strong>in</strong>g production per reproductive plant present <strong>the</strong><br />
previous year at <strong>the</strong> South sub<strong>population</strong> and fall precipitation of <strong>the</strong> previous year (top, R 2 =<br />
0.2426, P = 0.057) and graz<strong>in</strong>g frequency of <strong>the</strong> previous year (bottom, R 2 = 0.6591, P = 0.008).<br />
<strong>Lomatium</strong> <strong>cookii</strong> <strong>population</strong> <strong>monitor<strong>in</strong>g</strong> progress report, 2010 26
Rough and Ready Creek<br />
Due to its relatively small size, we are able to census <strong>the</strong> entire <strong>Lomatium</strong> <strong>cookii</strong> <strong>population</strong><br />
at Rough and Ready Creek. In 2010, we counted 2,557 L. <strong>cookii</strong> plants <strong>in</strong> eight patches on BLM<br />
land at <strong>the</strong> Rough and Ready Creek site (Table 6, Figures 17 & 18). Although this is an 8%<br />
decrease s<strong>in</strong>ce 2009, this is <strong>the</strong> second highest number of plants recorded s<strong>in</strong>ce <strong>monitor<strong>in</strong>g</strong> began<br />
<strong>in</strong> 1994. The <strong>population</strong> <strong>in</strong>crease observed <strong>in</strong> 1999 was due to an <strong>in</strong>crease <strong>in</strong> L. <strong>cookii</strong> plants <strong>in</strong> all<br />
patches except G and H (Table 6, Figure 18). The decl<strong>in</strong>es observed <strong>in</strong> 2000 - 2001 were largely<br />
due to losses of plants <strong>in</strong> patches B - E, while <strong>the</strong> decl<strong>in</strong>e <strong>in</strong> 2002 was primarily due to large losses<br />
<strong>in</strong> patches A and G. While ORV damage near <strong>the</strong> roadside <strong>in</strong> patch A likely affected some L.<br />
<strong>cookii</strong> plants <strong>in</strong> 2004, <strong>the</strong> loss was mitigated by an <strong>in</strong>crease <strong>in</strong> plants <strong>in</strong> o<strong>the</strong>r patches <strong>in</strong> 2005 and<br />
2006, especially <strong>in</strong> patches E and F. In 2010, <strong>in</strong>creases were seen <strong>in</strong> all patches except C and E.<br />
Increases and decreases <strong>in</strong> patch sizes might reflect actual fluctuations, but <strong>the</strong>y could also result<br />
from differential placements of <strong>the</strong> survey tapes demarcat<strong>in</strong>g <strong>population</strong> boundaries <strong>in</strong> different<br />
years.<br />
The proportion of reproductive plants <strong>in</strong> <strong>the</strong> <strong>population</strong> <strong>in</strong> 2010 (40%) was close to <strong>the</strong><br />
long-term average of 48% (Figure 17). Large vegetative plants (V2 and V3) and small<br />
reproductive plants (R1) were <strong>the</strong> most abundant stages at Rough and Ready Creek <strong>in</strong> 2010.<br />
Table 6. Number of <strong>Lomatium</strong> <strong>cookii</strong> <strong>in</strong>dividuals <strong>in</strong> each patch at Rough and Ready<br />
Creek. Patches A and G conta<strong>in</strong> permanently-marked <strong>monitor<strong>in</strong>g</strong> transects. The total<br />
number of plants <strong>in</strong> all patches comb<strong>in</strong>ed represents a census of <strong>the</strong> <strong>population</strong>. Totals<br />
<strong>in</strong>clude plants <strong>in</strong> all stages from seedl<strong>in</strong>gs to large reproductive plants.<br />
Number of Plants<br />
Patch<br />
Total<br />
Year A B C D E F G H<br />
1994 144 6 3 15 13 10 80 7 278<br />
1995 177 79 22 85 127 53 135 14 692<br />
1996 259 82 44 82 30 42 119 14 670<br />
1997 167 56 104 315 91 131 119 12 990<br />
1998 141 82 93 180 128 48 106 7 785<br />
1999 223 237 201 308 393 197 81 14 1,654<br />
2000 228 167 105 171 102 296 61 11 1,141<br />
2001 292 113 102 189 245 119 64 24 1,148<br />
2002 88 153 104 135 274 217 16 18 1,005<br />
2003 298 93 217 64 34 382 73 25 1,186<br />
2004 251 114 123 46 271 174 74 25 1,078<br />
2005 248 146 124 56 148 369 72 25 1,188<br />
2006 98 271 235 69 424 540 50 28 1,715<br />
2007 127 141 67 132 217 197 23 20 924<br />
2008 397 250 477 157 433 325 79 9 2,127<br />
2009 567 363 430 424 347 526 102 17 2,776<br />
2010 346 567 758 300 133 382 60 11 2,557<br />
<strong>Lomatium</strong> <strong>cookii</strong> <strong>population</strong> <strong>monitor<strong>in</strong>g</strong> progress report, 2010 27
Figure 17. Population trends for reproductive plants and <strong>the</strong> total number of plants<br />
(reproductive and vegetative) at Rough and Ready Creek, 1994-2010. There were only<br />
26 reproductive plants recorded <strong>in</strong> 1994.<br />
Figure 18. Population fluctuations <strong>in</strong> <strong>Lomatium</strong> <strong>cookii</strong> patches A-H at Rough and Ready<br />
Creek, 1994 – 2010.<br />
<strong>Lomatium</strong> <strong>cookii</strong> <strong>population</strong> <strong>monitor<strong>in</strong>g</strong> progress report, 2010 28
Indian Hill<br />
The total <strong>population</strong> size of L. <strong>cookii</strong> at Indian Hill has rema<strong>in</strong>ed relatively stable s<strong>in</strong>ce<br />
<strong>monitor<strong>in</strong>g</strong> was <strong>in</strong>itiated <strong>in</strong> 1997 (Figure 19). The <strong>population</strong> has cont<strong>in</strong>ually <strong>in</strong>creased s<strong>in</strong>ce 2007,<br />
add<strong>in</strong>g approximately 975 plants <strong>in</strong> 2010 for a total of 10,948. This is <strong>the</strong> third highest <strong>population</strong><br />
recorded s<strong>in</strong>ce <strong>monitor<strong>in</strong>g</strong> began. On average, reproductive plants have comprised 34% of <strong>the</strong><br />
<strong>population</strong> (m<strong>in</strong>imum, 16% <strong>in</strong> 1997; maximum, 46% <strong>in</strong> 2003). In 2010, reproductive plants<br />
composed 32% of <strong>the</strong> total <strong>population</strong>. The 1997 - 1998 and 1999 - 2000 decl<strong>in</strong>es <strong>in</strong> total<br />
<strong>population</strong> size are <strong>the</strong> result of attrition of vegetative plants, while <strong>the</strong> <strong>in</strong>crease <strong>in</strong> density from<br />
2002 - 2005 can be attributed to a higher proportion of reproductive plants. The mean density of<br />
reproductive plants <strong>in</strong> <strong>the</strong> <strong>population</strong> <strong>in</strong>creased steadily from 0.4 plants/m 2 <strong>in</strong> 1997 to 0.81<br />
plants/m 2 <strong>in</strong> 2004, 2005, and 2006. In 2010, <strong>the</strong>re were approximately 0.87 reproductive plants/m 2 ,<br />
<strong>the</strong> highest recorded density s<strong>in</strong>ce <strong>monitor<strong>in</strong>g</strong> began.<br />
The majority of plants at Indian Hill are vegetative. The V1-V2 and V3 stages comprised<br />
26% and 32% of <strong>the</strong> <strong>population</strong>, respectively. The R1 stage also made a substantial contribution<br />
(25%) to <strong>the</strong> <strong>population</strong> <strong>in</strong> 2010. Many of <strong>the</strong> V3 and R1 plants are likely a result of <strong>the</strong> prolific<br />
seedl<strong>in</strong>g recruitment event <strong>in</strong> 2005. The number of seedl<strong>in</strong>gs at <strong>the</strong> site has varied substantially.<br />
No seedl<strong>in</strong>gs were recorded at this site <strong>in</strong> 1999 or 2000. The highest proportion of seedl<strong>in</strong>gs <strong>in</strong> <strong>the</strong><br />
<strong>population</strong> was 8.5% <strong>in</strong> 2004. In 2010, seedl<strong>in</strong>gs accounted for 5% of <strong>the</strong> <strong>population</strong>, an <strong>in</strong>crease<br />
from 3% <strong>in</strong> 2009.<br />
Figure 19. The number of vegetative and reproductive plants at Indian Hill, 1997-2010.<br />
<strong>Lomatium</strong> <strong>cookii</strong> <strong>population</strong> <strong>monitor<strong>in</strong>g</strong> progress report, 2010 29
Table 7. Summary of <strong>population</strong> density and size (mean ± 90% confidence limit) for <strong>the</strong><br />
Indian Hill <strong>population</strong>.<br />
density (per m 2 ) <strong>population</strong> size<br />
year reproductive total reproductive total<br />
1997 0.4 ± 0.17 2.56 ± 1.07 1,840 ± 764 11,776 ± 4,801<br />
1998 0.46 ± 3.4 1.41 ± 0.84 2,134 ± 1,541 6,477 ± 3,737<br />
1999 0.39 ± 0.25 1.54 ± 0.80 1,803 ± 1,117 7,084 ± 3,580<br />
2000 0.46 ± 0.3 1.24 ± 0.73 2,098 ± 1,400 5,704 ± 3,266<br />
2001 0.58 ± 0.48 1.54 ± 1.05 2,686 ± 2,144 7,084 ± 4,685<br />
2002 0.60 ± 0.44 1.42 ± 0.88 2,778 ± 1,980 6,477 ± 3,931<br />
2003 0.73 ± 0.50 1.58 ± 1.23 3,349 ± 2,232 7,250 ± 5,485<br />
2004 0.82 ± 0.632 1.91± 1.36 3,772 ± 2,834 8,795 ± 6,074<br />
2005 0.81 ± 0.53 2.8 ± 2.2 3,735 ±2,364 12,898 ± 9,936<br />
2006 0.80 ± 0.5 2.1 ± 1.47 3,680 ± 2,225 9,862 ± 6,568<br />
2007 0.48 ± 0.37 1.89 ± 1.87 2,226 ± 1,647 8,685 ± 8,319<br />
2008 0.60 ± 0.45 2.04 ± 1.71 2,870 ± 1,986 9,623 ± 7,546<br />
2009 0.76 ± 0.51 2.17 ± 1.62 3,478 ± 2,277 9,973 ± 7,229<br />
2010 0.87 ± 0.48 2.38 ± 2.11 3,993 ± 3,502 10,948 ± 9,424<br />
Herbivory on <strong>Lomatium</strong> <strong>cookii</strong><br />
Herbivory by voles is relatively frequent on <strong>Lomatium</strong> <strong>cookii</strong>, but <strong>the</strong> frequency of damage<br />
to <strong>the</strong> plants has varied substantially among sites and years. Typically, damage to <strong>the</strong> plants ranges<br />
from consumption of leaf tips and <strong>in</strong>florescences, to removal of nearly all aboveground plant<br />
material. Consumption of <strong>the</strong> flower clusters results <strong>in</strong> little damage to <strong>the</strong> <strong>in</strong>dividual plant, but<br />
elim<strong>in</strong>ates seed production and, <strong>the</strong>refore, recruitment of seedl<strong>in</strong>gs <strong>in</strong> <strong>the</strong> follow<strong>in</strong>g year. The<br />
long-term impact of herbivory on L. <strong>cookii</strong> plants is unknown, but appears to play an important<br />
role <strong>in</strong> <strong>population</strong> growth and seedl<strong>in</strong>g dynamics. Environmental parameters (e.g., ra<strong>in</strong>fall,<br />
average maximum daily temperature, and average m<strong>in</strong>imum daily temperature) may <strong>in</strong>fluence vole<br />
<strong>population</strong>s similarly across <strong>the</strong> region and <strong>in</strong> turn affect <strong>the</strong> number of <strong>in</strong>dividuals of L. <strong>cookii</strong> that<br />
are grazed.<br />
In general, herbivory has <strong>in</strong>creased at French Flat South, French Flat Middle, and Indian<br />
Hill from <strong>the</strong> time <strong>monitor<strong>in</strong>g</strong> was <strong>in</strong>itiated to 2007. In 2008, graz<strong>in</strong>g was relatively low at all<br />
sites. In 2009, <strong>the</strong> frequency of graz<strong>in</strong>g cont<strong>in</strong>ued to fall at French Flat South and Indian Hill, but<br />
it <strong>in</strong>creased at French Flat Middle and Rough and Ready. In 2010, graz<strong>in</strong>g decreased at French<br />
<strong>Lomatium</strong> <strong>cookii</strong> <strong>population</strong> <strong>monitor<strong>in</strong>g</strong> progress report, 2010 30
Flat Middle and South, but <strong>in</strong>creased at Indian Hill and Rough and Ready (Figure 20). In our<br />
observations s<strong>in</strong>ce 1993, <strong>the</strong> highest recorded herbivory was 50% detected at Indian Hill <strong>in</strong> 2003,<br />
while <strong>the</strong> lowest was 1% at French Flat Middle <strong>in</strong> 1994.<br />
<strong>Lomatium</strong> <strong>cookii</strong> <strong>population</strong> <strong>monitor<strong>in</strong>g</strong> progress report, 2010 31
<strong>Lomatium</strong> <strong>cookii</strong> <strong>population</strong> <strong>monitor<strong>in</strong>g</strong> progress report, 2010 32
Current <strong>population</strong> status<br />
DISCUSSION<br />
In 2010, <strong>the</strong> number of <strong>Lomatium</strong> <strong>cookii</strong> <strong>in</strong>creased at every site except Rough and Ready.<br />
French Flat<br />
Current <strong>population</strong> estimates at this site are approximately 90,825 plants at <strong>the</strong> Middle<br />
sub<strong>population</strong> and 64,326 at <strong>the</strong> South sub<strong>population</strong>. The Population Viability Analysis suggests<br />
that <strong>the</strong> South sub<strong>population</strong> may be at risk of long term decl<strong>in</strong>e if current conditions persist. ORV<br />
use rema<strong>in</strong>s frequent and damag<strong>in</strong>g (Figure 21). In addition, analysis of environmental variables<br />
suggests that both herbivory by voles and heavy fall precipitation may have negative effects on <strong>the</strong><br />
<strong>population</strong> dynamics of this species and cause <strong>population</strong> decl<strong>in</strong>es.<br />
The Middle sub<strong>population</strong> hosted an estimated 231,600 <strong>in</strong>dividuals <strong>in</strong> 1998 when <strong>the</strong><br />
<strong>population</strong> was at its highest, up from 88,688 when <strong>monitor<strong>in</strong>g</strong> began <strong>in</strong> 1993 and twice <strong>the</strong> current<br />
estimate. Although <strong>the</strong>re has been some variability, <strong>the</strong> <strong>population</strong> has generally been decl<strong>in</strong><strong>in</strong>g<br />
s<strong>in</strong>ce 2000. The South sub<strong>population</strong> also peaked <strong>in</strong> 1998, with a total of 124,890 <strong>in</strong>dividuals.<br />
S<strong>in</strong>ce <strong>the</strong>n, it has generally decl<strong>in</strong>ed as well.<br />
Results from <strong>population</strong> viability analyses based on <strong>in</strong>formation from 1994 - 1999 and<br />
2008 – 2010 for Middle and 1994 - 2010 for South <strong>in</strong>dicated that <strong>the</strong>se sub<strong>population</strong>s differed <strong>in</strong><br />
<strong>the</strong>ir growth rates. The sub<strong>population</strong> at Middle was projected to grow, while <strong>the</strong> one at South was<br />
likely to decl<strong>in</strong>e. Stochastic simulations based on observed environmental variability <strong>in</strong>dicated<br />
that <strong>the</strong> risk of ext<strong>in</strong>ction or catastrophic decl<strong>in</strong>e was relatively low at <strong>the</strong> Middle sub<strong>population</strong> if<br />
past environmental and biological conditions persist. At South, however, <strong>the</strong> <strong>population</strong> appears to<br />
be at a high risk of 50% decl<strong>in</strong>e over a 20-yr period.<br />
Rough and Ready Creek<br />
We counted 2,557 plants at Rough and Ready Creek, <strong>the</strong> second highest tally we have<br />
observed s<strong>in</strong>ce <strong>monitor<strong>in</strong>g</strong> began <strong>in</strong> 1994. This <strong>population</strong> is traversed by dirt roads and <strong>the</strong><br />
habitat is quite different from <strong>the</strong> French Flat area. Instead of broad flat areas of relatively<br />
homogeneous grassland, <strong>the</strong> Rough and Ready Creek <strong>population</strong> occurs <strong>in</strong> grassy patches and<br />
roadways on gentle to moderate slopes among shrubs and trees (P<strong>in</strong>us jeffreyi). This patchy, less<br />
extensive habitat pattern is probably responsible for <strong>the</strong> large difference <strong>in</strong> <strong>population</strong> size between<br />
<strong>the</strong>se two areas. The dirt roads that dissect <strong>the</strong> Rough and Ready Creek sub<strong>population</strong> may also<br />
have reduced <strong>the</strong> number of plants that occurred here <strong>in</strong> 1994; however, most of <strong>the</strong> additional<br />
plants at this site <strong>in</strong> 1995 - 2006 were observed on <strong>the</strong> roadbeds, and were probably trampled and<br />
damaged <strong>in</strong> 1994. A large trash pile found on <strong>the</strong> western edge of Patch A <strong>in</strong> 2003 and fresh ORV<br />
tracks <strong>in</strong> 2004, 2005, and 2007 are <strong>in</strong>dicative of active road use and off-road habitat impact.<br />
<strong>Lomatium</strong> <strong>cookii</strong> <strong>population</strong> <strong>monitor<strong>in</strong>g</strong> progress report, 2010 33
Figure 21. ORV damage <strong>in</strong> <strong>the</strong> <strong>Lomatium</strong> <strong>cookii</strong> <strong>population</strong> at French Flat.<br />
Indian Hill<br />
The Indian Hill <strong>population</strong>, which is <strong>in</strong>termediate <strong>in</strong> size between <strong>the</strong> Rough and Ready and<br />
French Flat <strong>population</strong>s, decl<strong>in</strong>ed <strong>in</strong> total numbers from 1997 (when <strong>monitor<strong>in</strong>g</strong> began) to 1998,<br />
<strong>the</strong>n rema<strong>in</strong>ed relatively stable from 1998 to 2004. Overall, <strong>the</strong> <strong>population</strong> has <strong>in</strong>creased slightly<br />
from 2005 – 2010. Estimates of total plant density and reproductive plant density followed similar<br />
changes. The proportion of seedl<strong>in</strong>gs <strong>in</strong> <strong>the</strong> <strong>population</strong> has been <strong>in</strong>creas<strong>in</strong>g s<strong>in</strong>ce a low po<strong>in</strong>t <strong>in</strong><br />
2007. It is unclear why seedl<strong>in</strong>g recruitment was so low <strong>in</strong> 2007 and 2008; <strong>population</strong> size has<br />
been relatively stable <strong>in</strong> recent years, and <strong>the</strong> site does not appear to receive heavy ORV use.<br />
<strong>Lomatium</strong> <strong>cookii</strong> <strong>population</strong> <strong>monitor<strong>in</strong>g</strong> progress report, 2010 34
Management recommendations<br />
French Flat<br />
We recommend that <strong>population</strong> <strong>monitor<strong>in</strong>g</strong> at <strong>the</strong> French Flat sub<strong>population</strong>s be conducted<br />
once per year for all plots. If <strong>in</strong>sufficient time is available for <strong>the</strong>se activities, sampl<strong>in</strong>g of <strong>the</strong><br />
density plots should be conducted at least once every three years for data collection and plot<br />
ma<strong>in</strong>tenance. Sampl<strong>in</strong>g of <strong>the</strong> sub<strong>population</strong> boundary transects can occur at five-year <strong>in</strong>tervals<br />
(or when changes <strong>in</strong> <strong>population</strong> boundaries are suspected). Additional data from <strong>the</strong> demographic<br />
plots will allow improved <strong>population</strong> viability analyses, <strong>in</strong>clud<strong>in</strong>g enhancement of environmental<br />
stochasticity estimates and greater certa<strong>in</strong>ty <strong>in</strong> evaluations of <strong>the</strong> importance of environmental<br />
variables such as precipitation and vole herbivory.<br />
Ma<strong>in</strong>ta<strong>in</strong><strong>in</strong>g <strong>the</strong> motorized vehicle closure should be a priority for management of this site.<br />
Off Road Vehicles still use this area, despite official closure of <strong>the</strong> roads, mak<strong>in</strong>g this important<br />
<strong>population</strong> extremely vulnerable to damage. Also, horse-back riders that use French Flat should be<br />
warned of <strong>the</strong> presence of rebar posts <strong>in</strong>terspersed throughout <strong>the</strong> habitat.<br />
Rough and Ready Creek<br />
The road lead<strong>in</strong>g through <strong>the</strong> Rough and Ready <strong>population</strong> should be gated to protect <strong>the</strong><br />
plants and this vulnerable <strong>population</strong>. The large trash pile found on <strong>the</strong> western edge of Patch A <strong>in</strong><br />
2003 and fresh ORV tracks <strong>in</strong> 2004 and 2005 <strong>in</strong>dicate that <strong>the</strong> road is actively be<strong>in</strong>g used. If traffic<br />
were to <strong>in</strong>crease even by a small amount, this <strong>population</strong> could be severely impacted.<br />
Monitor<strong>in</strong>g at Rough and Ready Creek should be repeated each year to detect changes <strong>in</strong><br />
<strong>population</strong> size and density. However, if <strong>in</strong>sufficient resources are available for this activity,<br />
sampl<strong>in</strong>g should be conducted at least once every three years. The roads that dissect this site pose<br />
a real threat to <strong>the</strong> viability of <strong>the</strong> <strong>population</strong>, and opportunities for road closures (at least from<br />
February through August) should be evaluated.<br />
Indian Hill<br />
The habitat at Indian Hill is restricted by forest that surrounds a long strip of meadow<br />
habitat. These meadows are be<strong>in</strong>g <strong>in</strong>vaded by shrubs that may eventually have detrimental impacts<br />
on <strong>the</strong> L. <strong>cookii</strong> <strong>population</strong> through competition for light, water, and nutrients. Monitor<strong>in</strong>g at<br />
Indian Hill should be repeated annually to detect changes <strong>in</strong> <strong>population</strong> size and density. If<br />
<strong>in</strong>sufficient resources are available for annual <strong>monitor<strong>in</strong>g</strong>, sampl<strong>in</strong>g should be conducted at least<br />
once every three years.<br />
<strong>Lomatium</strong> <strong>cookii</strong> <strong>population</strong> <strong>monitor<strong>in</strong>g</strong> progress report, 2010 35
LITERATURE CITED<br />
Caswell, H. and T.N. Kaye. 2001. Stochastic demography and conservation of an endangered<br />
perennial plant (<strong>Lomatium</strong> bradshawii) <strong>in</strong> a dynamic fire regime. Advances <strong>in</strong> Ecological<br />
Research 32:1-51.<br />
Ferson, S. 1991. RAMAS/stage: generalized stage-based model<strong>in</strong>g for <strong>population</strong> dynamics.<br />
Applied Bioma<strong>the</strong>matics. Setauket, New York.<br />
Kagan, J. 1980. The biology of <strong>Lomatium</strong> bradshawii (Apiaceae), a rare plant of Oregon. M.S.<br />
<strong>the</strong>sis, University of Oregon, Eugene.<br />
Kagan, J. 1986. A new species of <strong>Lomatium</strong> (Apiaceae), from southwestern Oregon. Madroño<br />
33 (1): 71-75.<br />
Kagan, J. 1994. Habitat management plan for <strong>Lomatium</strong> <strong>cookii</strong> (Cook's desert-parsley) <strong>in</strong> <strong>the</strong><br />
Ill<strong>in</strong>ois <strong>Valley</strong>, Joseph<strong>in</strong>e County, OR. Oregon Natural Heritage Program. Portland,<br />
Oregon 97210.<br />
Kaye, T.N. 1992. Bradshaw's desert-parsley: <strong>population</strong> <strong>monitor<strong>in</strong>g</strong> and poll<strong>in</strong>ation biology.<br />
Kalmiopsis 2:1-4.<br />
Kaye, T.N. 2001. Population viability analysis of Bradshaw's lomatium (<strong>Lomatium</strong> bradshawii)<br />
and a comparison of matrix model<strong>in</strong>g techniques. PhD Dissertation. Department of<br />
Botany and Plant Pathology, Oregon Sate University.<br />
Kaye, T.N. and M. Blakeley-Smith. 2002. Vegetation survey of French Flat ACEC, Medford<br />
District, BLM. Institute for Applied Ecology, Corvallis, Oregon and USDI Bureau of Land<br />
Management, Medford District.<br />
Kaye, T.N., K. Pendergrass, K. F<strong>in</strong>dley and J.B. Kauffman. 2001. The effect of fire on <strong>the</strong><br />
<strong>population</strong> viability of an endangered prairie plant. Ecological Applications 11:1366-<br />
1380.<br />
Kaye, T.N. and M. Kirkland. 1994. Population biology of <strong>Lomatium</strong> bradshawii. II. Sexual<br />
expression, breed<strong>in</strong>g system, and <strong>in</strong>sect <strong>in</strong>teractions. Unpub. Cooperative Challenge Cost<br />
Share report, Oregon Department of Agriculture, Plant Conservation Biology Program and<br />
Eugene District, BLM.<br />
Kaye, T.N. and M. Kirkland. 1995. <strong>Lomatium</strong> <strong>cookii</strong> <strong>population</strong> <strong>monitor<strong>in</strong>g</strong> at French Flat and<br />
Rough and Ready Botanical Wayside, Ill<strong>in</strong>ois <strong>Valley</strong>, Joseph<strong>in</strong>e County, Oregon. Unpub.<br />
Challenge Cost Share report, Oregon Department of Agriculture, Plant Conservation<br />
Biology Program and Medford District BLM.<br />
Kaye, T.N. and D.A. Pyke. 2003. The effect of stochastic technique on estimates of <strong>population</strong><br />
viability from transition matrix models. Ecology 84:1464-1476.<br />
Knight, L. 1992. Basel<strong>in</strong>e <strong>monitor<strong>in</strong>g</strong> of <strong>Lomatium</strong> <strong>cookii</strong>. Bureau of Land Management,<br />
Medford District. Medford, Oregon.<br />
Menges, E.S. 1986. Predict<strong>in</strong>g <strong>the</strong> future of rare plant <strong>population</strong>s: demographic <strong>monitor<strong>in</strong>g</strong> and<br />
model<strong>in</strong>g. Natural Areas Journal 6:6-17.<br />
Tong, B. 1993. <strong>Lomatium</strong> <strong>cookii</strong> <strong>monitor<strong>in</strong>g</strong> at French Flat, Freeman claim. Unpub. Medford<br />
District BLM staff report.<br />
<strong>Lomatium</strong> <strong>cookii</strong> <strong>population</strong> <strong>monitor<strong>in</strong>g</strong> progress report, 2010 36
APPENDIX A. GEAR LIST.<br />
Field Gear<br />
Last year’s report<br />
Last year’s datasheets<br />
Density plot datasheets<br />
French Flat South and Middle demographic datasheets<br />
Rite-<strong>in</strong>-<strong>the</strong>-ra<strong>in</strong> paper<br />
Jepson guide<br />
Clipboards/pencils<br />
Maps<br />
3 100+ feet tapes, 2 smaller (50ft) tapes<br />
3-4 candy canes<br />
2 rulers<br />
2 large b<strong>in</strong>der clips<br />
Bundle of p<strong>in</strong>flags<br />
Quadrat frames: 1x1m for Rough and Ready, .5x.5m for French Flat<br />
Extra rebar, hammer, and flagg<strong>in</strong>g to replace lost/bent<br />
Compass<br />
First Aid Kit/Tecnu<br />
Water jug *2<br />
Prun<strong>in</strong>g tool<br />
Health and Safety box<br />
Note for plann<strong>in</strong>g:<br />
• Indian Hill – 10 transects took about 3-4 hours. Park at turn-off for dirt road, unless<br />
conditions have been improved s<strong>in</strong>ce 2010.<br />
• Rough and Ready – Population census for T1 and T2. T3 is “loosely” sampled, <strong>in</strong> order to<br />
obta<strong>in</strong> census. This took about 4 hours.<br />
• Need vehicle with clearance.<br />
<strong>Lomatium</strong> <strong>cookii</strong> <strong>population</strong> <strong>monitor<strong>in</strong>g</strong> progress report, 2010 37